
 Open Access Article
 This Open Access Article is licensed under a Creative Commons Attribution-Non Commercial 3.0 Unported Licence
Studies of the binding properties of the food preservative thiabendazole to DNA by computer simulations and NMR relaxation
Qiaomei Suna,
Zili Suoa,
Hongyu Pua,
Peixiao Tang *a,
Na Gana,
Ruixue Gana,
Yuanming Zhai*b,
Xiaohui Dinga and
Hui Lia
*a,
Na Gana,
Ruixue Gana,
Yuanming Zhai*b,
Xiaohui Dinga and
Hui Lia
aSchool of Chemical Engineering, Sichuan University, Chengdu 610065, China. E-mail: tangpeixiao@126.com; Fax: +86 028 85401207; Tel: +86 028 85405220
bAnalytical & Testing Center, Sichuan University, Chengdu 610065, China. E-mail: yuanmingzhai@scu.edu.cn
First published on 4th June 2018
Abstract
Thiabendazole (TBZ) is a commonly used food preservative and has a wide range of anthelmintic properties. In this study, computer simulations and experiments were conducted to investigate the interaction mechanism of TBZ and herring sperm DNA (hsDNA) at the molecular level. Molecular docking showed that TBZ interacted with DNA in groove mode and bound in A-T and C-G base pair regions. Molecular dynamics (MD) was used to evaluate the stability of the TBZ–DNA complex and found that the three phases in MD and the hydrogen bonds helped maintain the combination. NMR relaxation indicated that TBZ had a certain affinity to hsDNA with a binding constant of 462.43 L mol−1, and the thiazole ring was the main group bound with DNA. Results obtained from fluorescence experiments showed that the binding of TBZ and hsDNA was predominantly driven by enthalpy through a static quenching mechanism. Circular dichroism and viscosity measurements proved the groove binding mode. The FTIR results clarified the conformational changes of DNA, that the DNA helix became shorter and compact, and the DNA structure transformed from B-form to A-form.
1. Introduction
Thiabendazole [2-(4-thiazolyl) benzimidazole, TBZ] is a commonly used food preservative that is widely applied in various fruits and vegetables to slow down putridity caused by fungi.1 The structure of TBZ was shown in Fig. 1. Although the use of TBZ can provide benefits, its unreasonable use or excessive consumption leads to health risks; for example, TBZ can disrupt microtubules and induce anaphase–telophsae chromosomal aberrations.2,3 Thus, many researchers have focused on the binding properties of food additives and physiological macromolecules to preliminarily evaluate the safety and physiological properties of food additives.4–6 | ||
| Fig. 1 Structure of thiabendazole (TBZ). | ||
Deoxyribonucleic acid (DNA) is an important biomacromolecule that has potential therapeutic activity against many diseases, given that it is the pharmacological target of many drugs.7–9 The bindings of ligand and DNA have been indicated to affect DNA duplication and culminating transcription.10 The non-covalent interaction binding mode between ligands and the double helix of DNA include (i) groove binding where the ligand is located outside of the DNA helix groove with hydrogen bonds and (or) van der Waals interactions, and (ii) intercalation binding between ligand and the stacked base pairs of DNA, which usually have a greater impact on the structure and function of DNA compared with groove binding.11,12 The DNA damage and genotoxic and mutagenic effects of some food additives have been recently considered, and some of their adverse effects on DNA have been revealed.13 Moreover, there are some studies indicated that the difference in DNA structure had some effect on the binding process of ligand and receptor.14,15 Hence, studies on the interaction between food additives and DNA can provide theoretical knowledge for the physiological properties of food additives and are beneficial to promote the development of safe food preservatives.
Receptor-ligand interactions have caught many researchers' attention, especially in the field of chemistry and life sciences. Many methods have developed to investigate these interactions.16–18 Among these methods, computer simulations including molecule docking and molecular dynamic (MD) simulation, are a powerful tool to determine the orientation and binding site for visualization of the binding properties and to monitor the dynamics behavior of the ligand/receptor structures during combination.19,20 Complementarily, nuclear magnetic resonance (NMR) provides reasonable and reliable data to clarify the binding properties of ligand at the molecular level by identifying ligand epitope and structure affinity.21,22 Relaxation time technique is an effective method to investigate the binding affinity and dynamic properties on the basis of the quantitative analysis of spin–lattice relaxation rate changes of proton.23–25
Given that the binding mode of TBZ and calf thymus DNA (ctDNA) had been researched by fluorescence, UV absorbance and circular dichroism (CD) spectra,26 the main aim of this work was to further investigate the binding mechanism between TBZ and herring sperm DNA (hsDNA) and probe into the effects on the binding properties for different DNA models by combining theories and experiments. The interaction characteristics of TBZ–hsDNA would be clarified from the point of the superior groups and proton affinity abilities of TBZ. Molecular docking and MD were conducted to estimate the binding mode, binding region, and structural characteristics and to evaluate the dynamics behavior and stability of TBZ–DNA complex. NMR relaxation experiments probed into the binding mechanism (including binding constant and affinity) from the point of ligand molecule. The binding mode and structural feature of TBZ to hsDNA were corroborated by spectroscopy. This study will help us understand the physiological pharmacokinetic behavior of TBZ at the molecular level and will provide interesting insights into the interactions of food additives and DNA.
2. Materials and methods
2.1. Reagents and chemicals
Herring sperm DNA (hs-DNA) was obtained from Solarbio (Beijing, China) and was dissolved in a phosphate buffer solution (PBS, 0.01 M). The purity of the DNA was checked by a ratio of UV absorbance at 260 and 280 nm. The ratio was larger than 1.8, indicating that the hs-DNA was sufficiently free from any protein contamination.27 The stock solution of the DNA was stored in the dark at 4 °C and used within a week.TBZ was purchased from Aladdin Chemical Reagent (Shanghai, China). All of the other reagents were of analytical grade and used without further purification. Ultrapure water was used throughout the experiment.
2.2. Molecule docking and molecule dynamics simulation
FlexX docking program interfaced within LeadIT was used to examine possible binding modes and active site of TBZ and DNA.20 The 3D structure of TBZ was obtained from PubChem (Pub-Chem CID: 5430), and the crystallographic structure of DNA duplex (PBD ID: 1BNA) was downloaded from PCSB protein data bank with the sequence of (CGCGAATTCGCG)2. The hydrogen atoms of DNA were added using Receptor Wizard module. The FlexX hybrid algorithm was selected to perform the docking with a radius of 20 Å binding site definition. The docking binding modes of the top five highest scored docking poses were evaluated, and the optimal binding poses were used for molecular dynamics simulation.MD simulations were conducted using YASARA v16.7.22 package with the AMBER14 force field, to determine the optimal binding conformation and assess the system stability.19 The simulation was performed at a NPT ensemble with a constant temperature at 298 K and constant pressure (1 bar) at pH 7.4. Counter ions (Na+ or Cl−) were added by randomly replacing water molecules to obtain a charge-neutral system. Periodic boundary conditions were applied in the MD process. Simulations were carried out after initial energy minimization procedures were conducted, by using a pre-defined macro (md_run) within the YASARA package. According to the MD trajectories, root mean square deviations (RMSD) were analyzed.
2.3. NMR measurements
All data were acquired using a Bruker Advance 400 MHz NMR spectrometer, operated at 400.13 MHz at 25 °C. The spin–lattice relaxation rates were measured using the standard inversion-recovery (180°–τ–90°–t)n sequence. The τ values used for the experiments were 0.01, 0.02, 0.04, 0.06, 0.1, 0.2, 0.4, 0.8, 1, 3, 5, 7, 20, and 25 s. The delay time t in this case was 25 s. The 180° selective inversion of the proton spin population was obtained through a selective soft Gaussian perturbation pulse (width: 20 ms, power: 60 dB) with an excitation width of about 45 Hz. The addition of HSA did not change the viscosity of the system, and the observed Rsei enhancements were mainly affected by the ligand–protein complex formation. All NMR data processing and analyses were performed using Topspin 2.1 software (Bruker BioSpin, Ltd.).2.4. Fluorescence spectroscopy
Fluorescence intensities were recorded using a Cary Eclipse fluorophotometer (Varian, USA) equipped with 0.1 cm quartz cells. Each solution was left to stand for 1 hour to achieve equilibrium. The wavelength range from 310 nm to 550 nm with excitation wavelength at 300 nm was selected. The slit widths for both excitation and emission were set to 10.2.5. Fluorescence lifetime measurements
The fluorescence lifetimes were determined by time-correlated single photon counting (TCSPC) using a Horiba Jobin Yvon FluoroMax-4 spectrofluorometer (HORIBA, FRA). The time-resolved intensity decay of TBZ was measured in the absence and presence of hs-DNA in PBS buffer (pH = 7.4) at an excitation and emission wavelengths of 317 nm and 360 nm. The TBZ concentration was fixed at 2.0 × 10⁻⁵ mol L−1, and the hs-DNA concentrations were varied from 4.0 × 10⁻⁴ mol L−1 to 1.2 × 10⁻³ mol L−1 at room temperature.2.6. Circular dichroism spectra
Far UV-CD spectra were recorded using a Hitachi-F7000 fluorescence spectrometer with a 1.0 cm path length quartz cell at 298 K. The spectra were obtained at wavelength ranging from 190 nm to 320 nm with a step size of 1.0 nm, and average time of 0.5 s. The concentration of hsDNA was fixed at 4.0 × 10⁻⁴ mol L−1, whereas that of TBZ ranged from 0 M to 4.0 × 10⁻⁵ mol L−1. Each CD spectrum was recorded from the average values of three scans.2.7. Viscosity measurements
Viscosity was measured using the Discovery HR-2 hybrid rheometer (TA Instruments, New Castle, DE, USA) at 298 K. The concentration of hsDNA was fixed at 4.0 × 10⁻⁵ mol L−1 and added with different concentrations of TBZ. The viscosities of samples were calculated by averaging three measurements. The values of relative specific viscosity (η/η0)1/3 were plotted against the ratios of [TBZ]/[hsDNA] (r = 0.0, 0.1, 0.2, 0.4, 0.8, 1.2), where η0 and η are the viscosity of DNA in the absence and presence of TBZ, respectively.2.8. FTIR spectrum measurements
The FTIR spectrum measurements were conducted on a Nicolet-6700 FTIR spectrometer (Thermo, USA) with a smart OMNI-sampler accessory. The FTIR spectra of TBZ with hs-DNA at molar ratios of TBZ to hs-DNA of 1![[thin space (1/6-em)]](https://www.rsc.org/images/entities/char_2009.gif) :0, 1:20, 1:40, and 1:80 were obtained. All the spectra were collected in the range of 1800–700 cm−1 by averaging 128 scans with a resolution of 4 cm−1. All the measurements were conducted at room temperature, and the background spectra were collected before each measurement.
:0, 1:20, 1:40, and 1:80 were obtained. All the spectra were collected in the range of 1800–700 cm−1 by averaging 128 scans with a resolution of 4 cm−1. All the measurements were conducted at room temperature, and the background spectra were collected before each measurement.
3. Results and discussion
3.1. Computer simulation analysis of the binding of TBZ and DNA
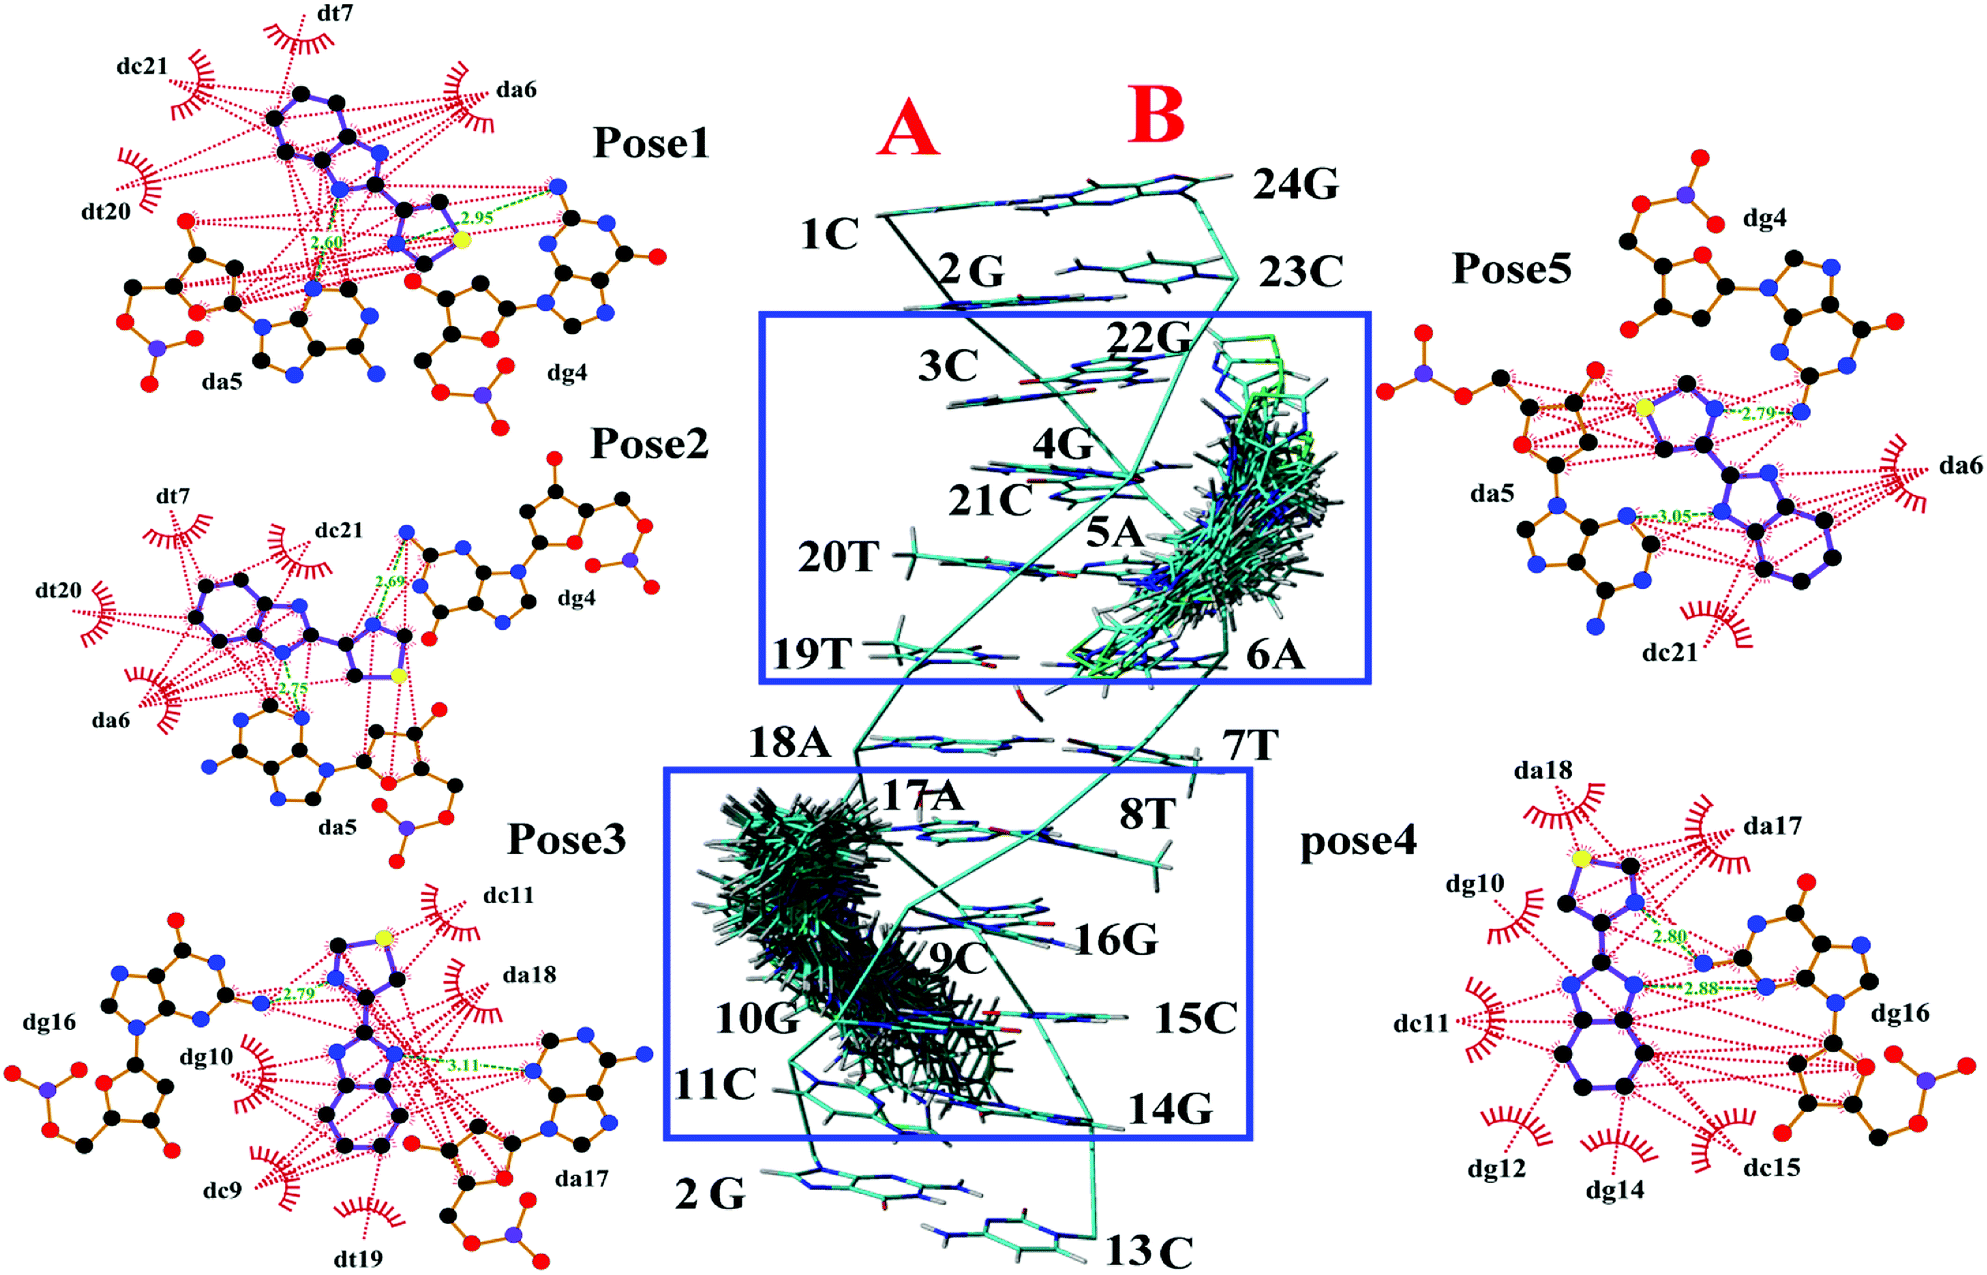 | ||
| Fig. 2 Middle image was the cluster analysis for conformations of the TBZ docking with numbered DNA [PBD ID: 1BNA, (CGCGAATTCGCG)2] generated by FlexX. The two chains (A and B) and base sequence of DNA were labeled. The five surrounded images were the top five highest-scored docking poses generated by LigPlot, wherein the hydrophobic interaction was red dashed, and the hydrogen bonds were green dashed with distance. | ||
3.1.2.1. Analysis of the systematic stabilities using RMSD. In this study, MD simulations were performed under simulated physiological conditions to further understand the stability and dynamics behavior of TBZ–DNA complex in different timescales. Root mean square deviations, which is deviation statistics on behalf of the structural changes and the atomic fluctuation from the initial position, is a parameter for assessing the stability of simulation system.28 The RMSD values of α-carbon atoms for the free DNA and TBZ–DNA complex systems versus simulation time were showed in Fig. 3. The RMSD values for free DNA fluctuated in a balanced position throughout the simulation and thus indicated the stable double helix structure of DNA. Compared with that in blank control system, the RMSD in TBZ–DNA systems displayed an apparent disturbance and eventually reached plateau at approximately 46 ns. Thus, TBZ could steadily bind with DNA and stayed at a stable binding position after a slight structural drift and low atomic fluctuations.
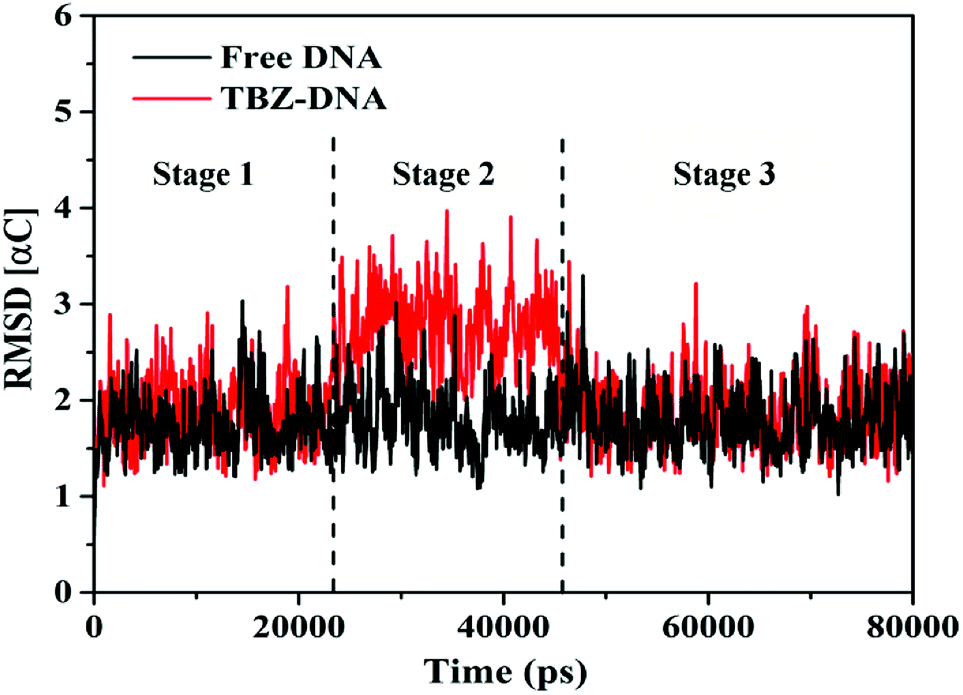 | ||
| Fig. 3 Root mean square deviations of the complex systems in the MD simulations. | ||
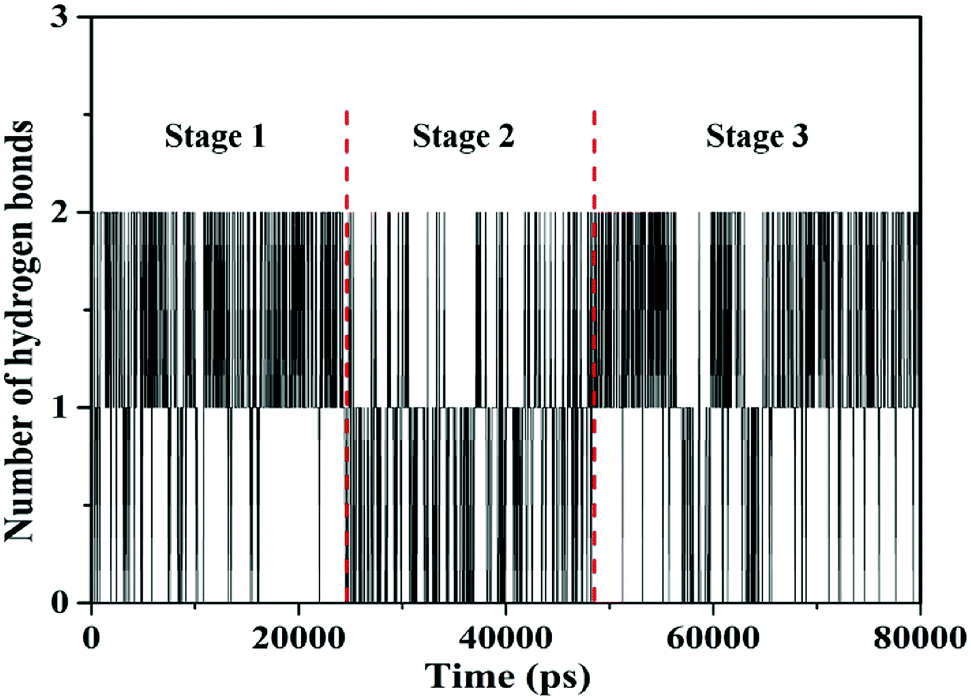
3.1.2.2. Dynamics behavior analysis of trajectory. According to the fluctuation of RMSD in 80 ns, the molecular dynamics process can be divided into three stages for trajectory analysis to evaluate the dynamics behavior of the binding (Fig. 3). The first stage (Stage 1) was from the initial state to 24 ns, the second stage (Stage 2) was from 24 ns to 46 ns, and the third stage (Stage 3) was from 46 ns to 80 ns. A representative trajectory for each stage was selected, specifically, 0 ns, 35 ns, and 80 ns represented Stage 1, Stage 2, and Stage 3, respectively. As shown in Fig. 4, the TBZ molecule moved from the center of the DNA to the edge area in the MD simulation. In the initial conformation (Stage 1, time = 0 ns), the TBZ molecule bound in the border area of A-T and C-G base pairs of DNA, and formed two hydrogen bonds with adenine and guanine in the distance of 2.99 and 2.95 Å, respectively. In Stage 2 (time = 35 ns), the hydrogen bond between TBZ and DNA fractured, and the TBZ molecule drifted from the initial binding position and was maintained by hydrophobic interaction with DNA. In the final stable state (Stage 3, time = 80 ns), TBZ steadily bound in the terminal region enriched with A-T base pairs by forming hydrogen bonds with cytosine and guanine in the distances of 2.71 and 3.14 Å, respectively. In conclusion, TBZ bound to the groove position of DNA comprising A-T and C-G base pairs. Hydrogen bonds and hydrophobic interaction were the main forces for maintaining this combination.
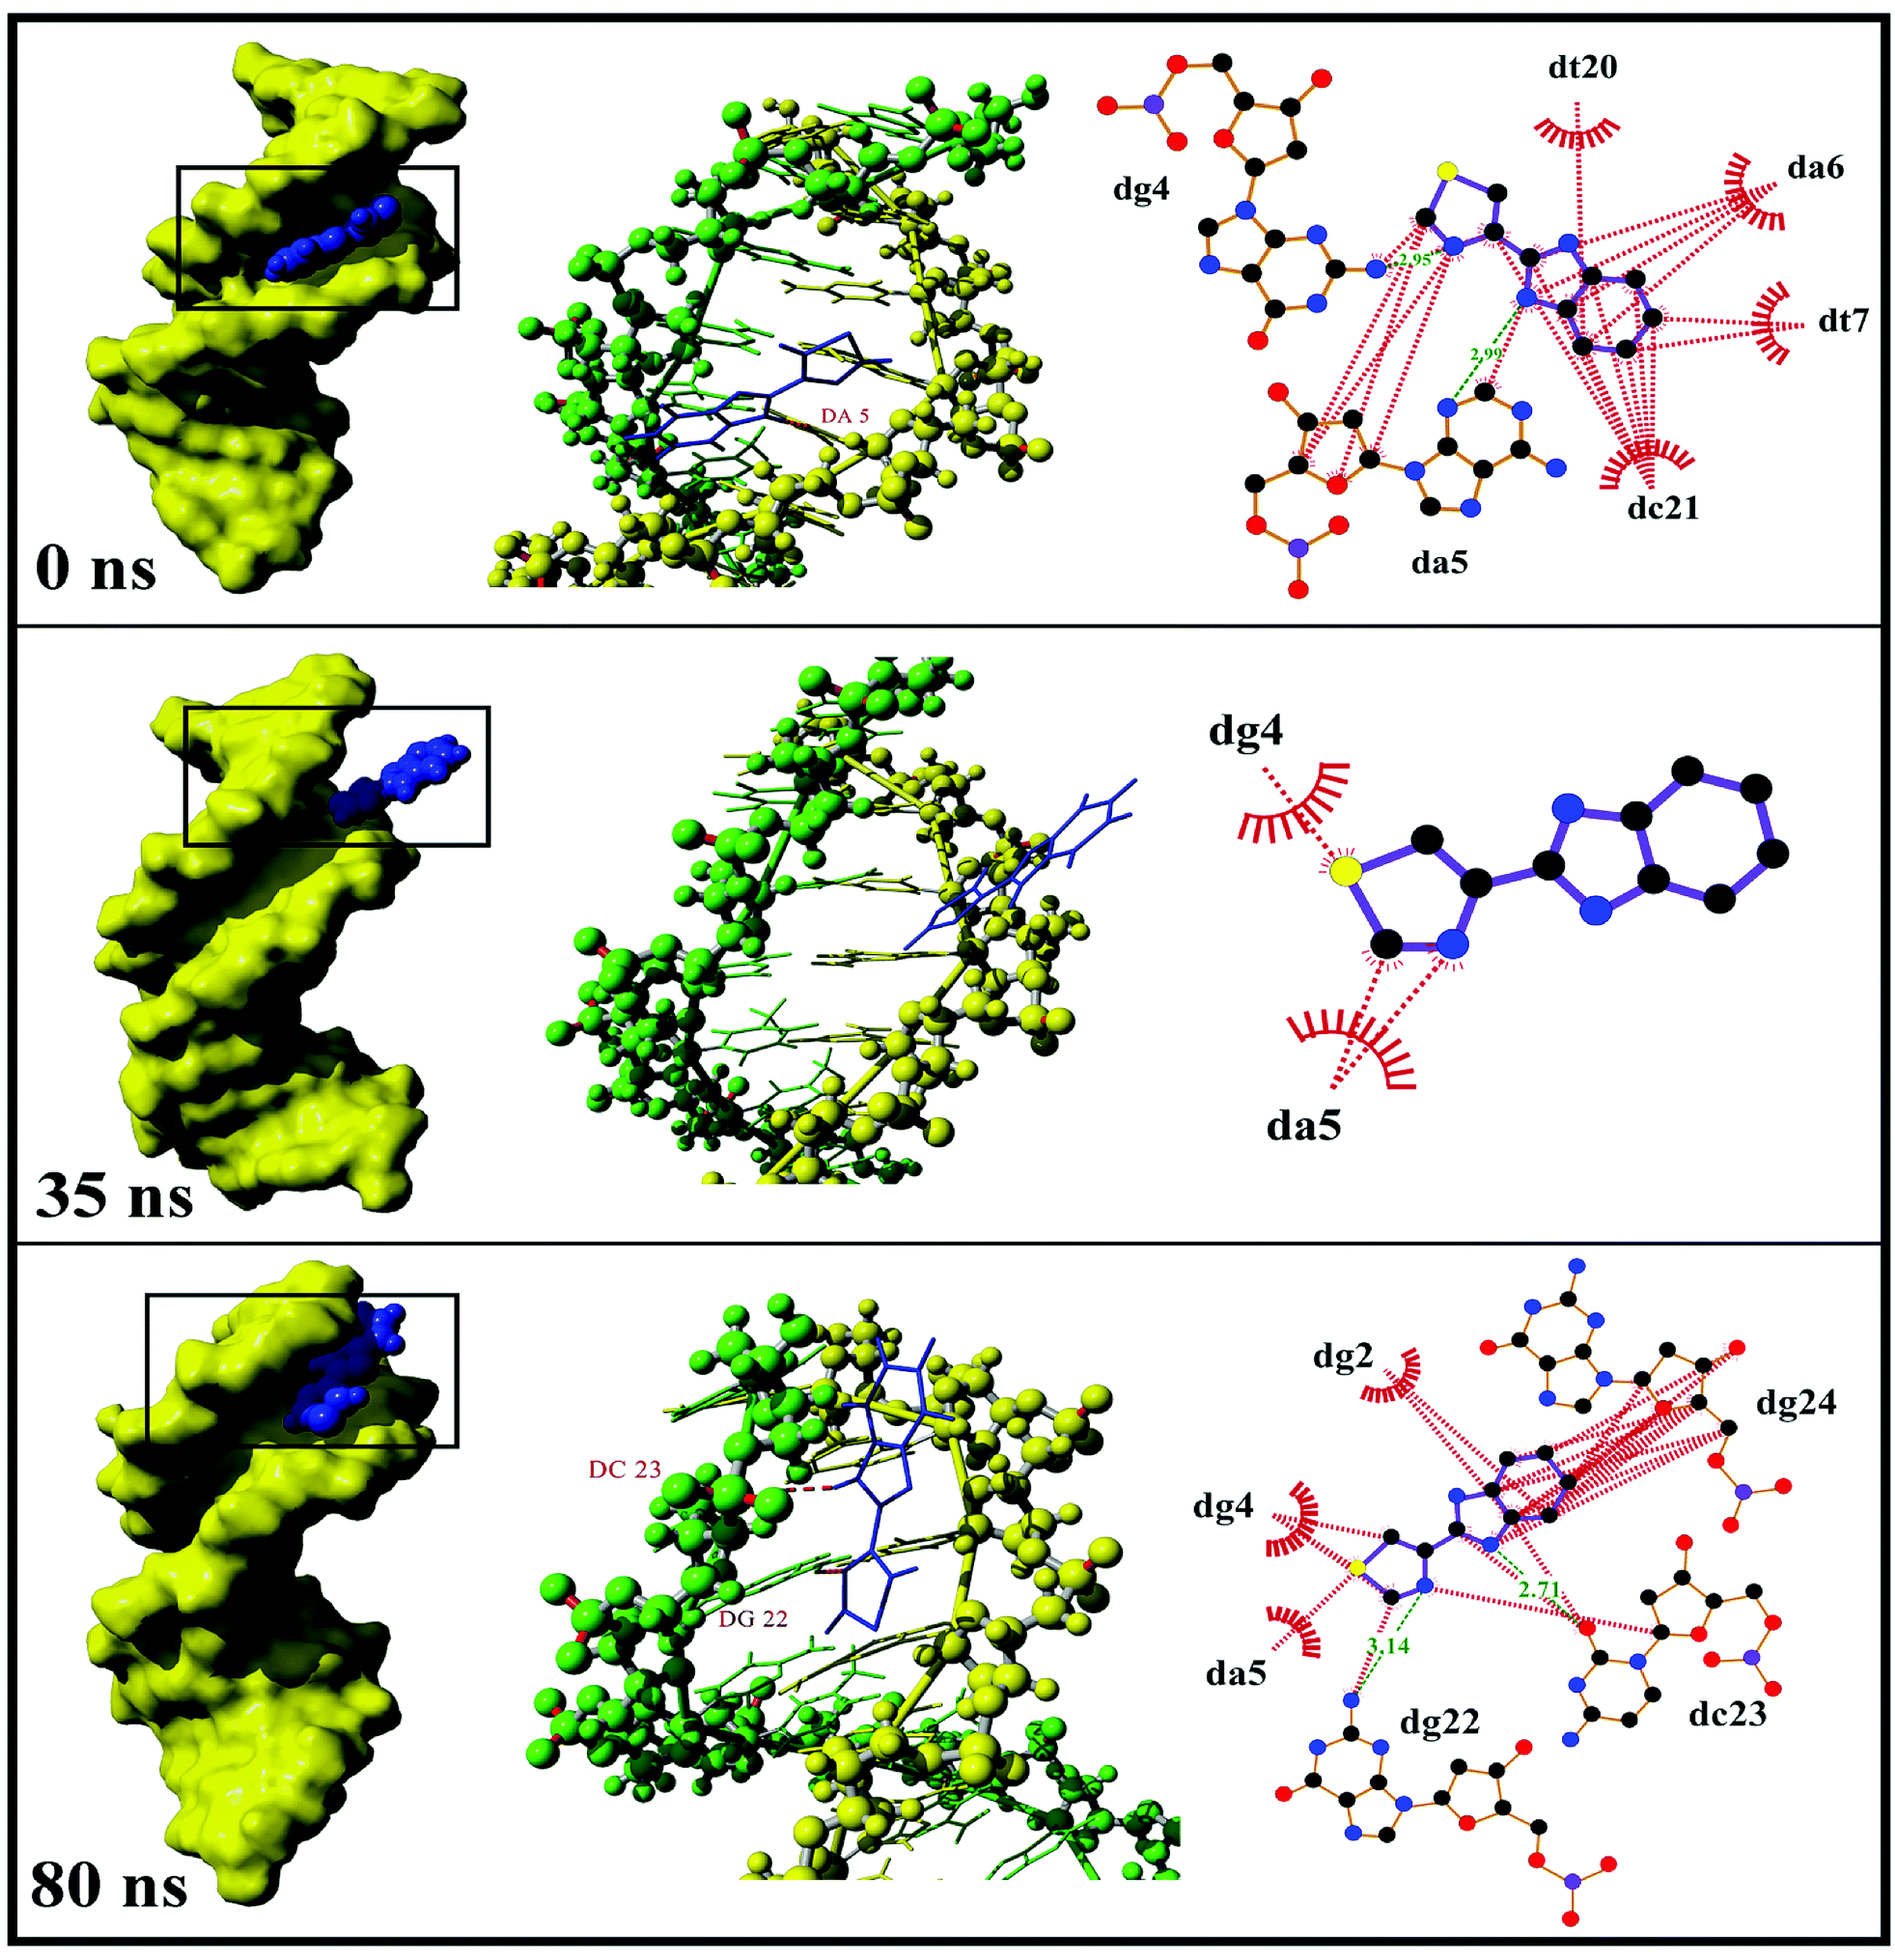 | ||
| Fig. 4 Trajectory analysis of three stages at 0, 35, and 80 ns. Left images showed the binding region and binding mode of TBZ to DNA, where DNA was showed as molecular surface and TBZ was spherical model. Middle images were the interaction conformations of complex, in which the hydrogen bonds were red dotted line and the base formed hydrogen bond with TBZ was labeled. Right images showed the schematic representation of Ligplot software, wherein hydrophobic interaction was colored red and hydrogen bond colored green with distance. | ||
The hydrogen bond numbers of TBZ–DNA system were analyzed throughout the MD simulation and were shown in Fig. 5. The numbers of hydrogen bond ranged from 0 to 2, and the variation of hydrogen bonds number could be divided into three stages similar to RMSD. In Stages 1 and 3, the numbers of hydrogen bond ranged from 1 to 2, whereas that in Stage 2 ranged from 0 to 1. The results indicated that hydrogen bonds played an important role in the binding and stabilities of TBZ and DNA.
 | ||
| Fig. 5 The number of hydrogen bonds between TBZ and DNA throughout the MD simulations. | ||
3.2. Analysis of the binding mechanism of TBZ–DNA system
| M + L = ML | (1) |
When the ligand–receptor reach equilibration, the thermodynamic equilibrium constant can be written as K = [ML]/[M][L]. Under conditions of fast chemical exchange between free and bound environments, the Rse can be expressed by the following equation:24
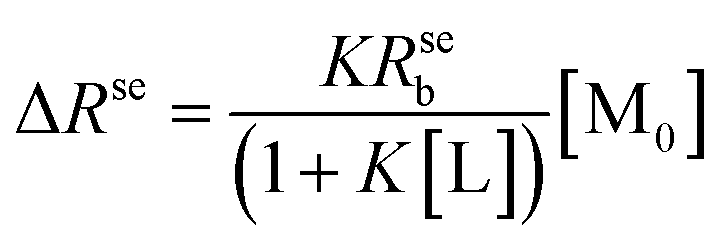 | (2) |
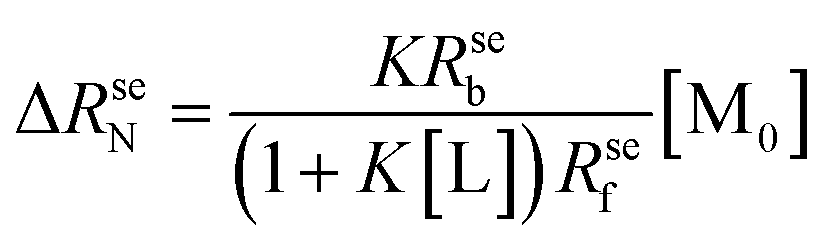 | (3) |
The normalized relaxation rate ΔRseN versus the macromolecule concentration [M0] is characterized by a positive linear correlation. The slope of the straight line passing through the origin of the axes is [AN]TL:
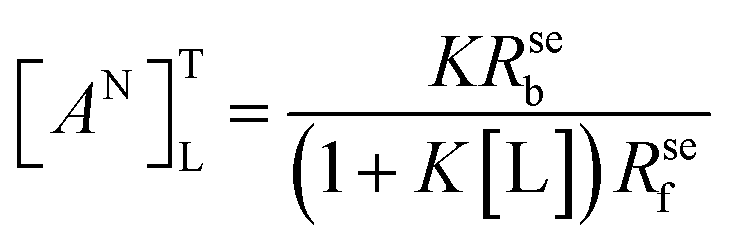 | (4) |
 | (5) |
Plotting 1/ΔRseN to the ligand concentration [L], the binding constant K can be calculated.
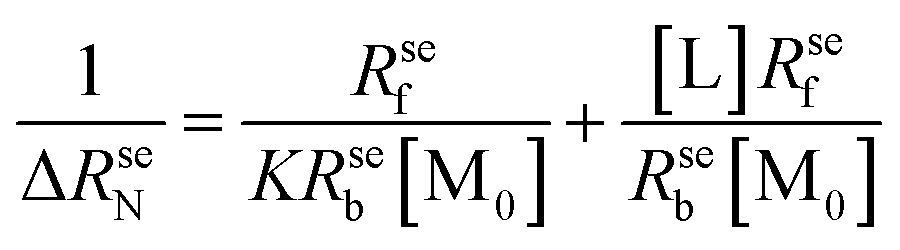
573.03 ± 4120.80, and 8498.93 ± 5.52 L mol−1, respectively. The NMR results confirmed that the thiazole ring was the main group bound with DNA, and the affinity of benzene rings was weak due to the absence of hydrogen protons on the imidazole ring.
 | ||
| Fig. 6 (A) Proton NMR spectrum of thiabendazole in DMSO-d6 solution. (B) Plots of normalized selective relaxation rate enhancements of H1/H2, H14, and H12. [TBZ] = 2 × 10⁻³ mol L−1, [DNA] = 1, 2, 5, 10, 20 × 10−5 mol L−1, pH = 7.4, T = 298 K. (C) Equilibrium constant of the TBZ–DNA system. [DNA] = 2 × 10⁻⁵ mol L−1, [TBZ] = 2, 2.5, 3, 3.5, 4 × 10⁻³ mol L−1, pH = 7.4, T = 298 K. | ||
In order to ascertain the binding mechanism between TBZ and DNA, the binding constant was calculated according to eqn (5) in Fig. 6C. The binding constant of the TBZ–DNA complex was 462.43 L mol−1 at 298 K, which was lower than that of the reported intercalate binding mode ranging from 105 L mol−1 to 106 L mol−1.29 The low binding affinity of the TBZ and DNA served as an evidence for the non-intercalative binding mode.
 | ||
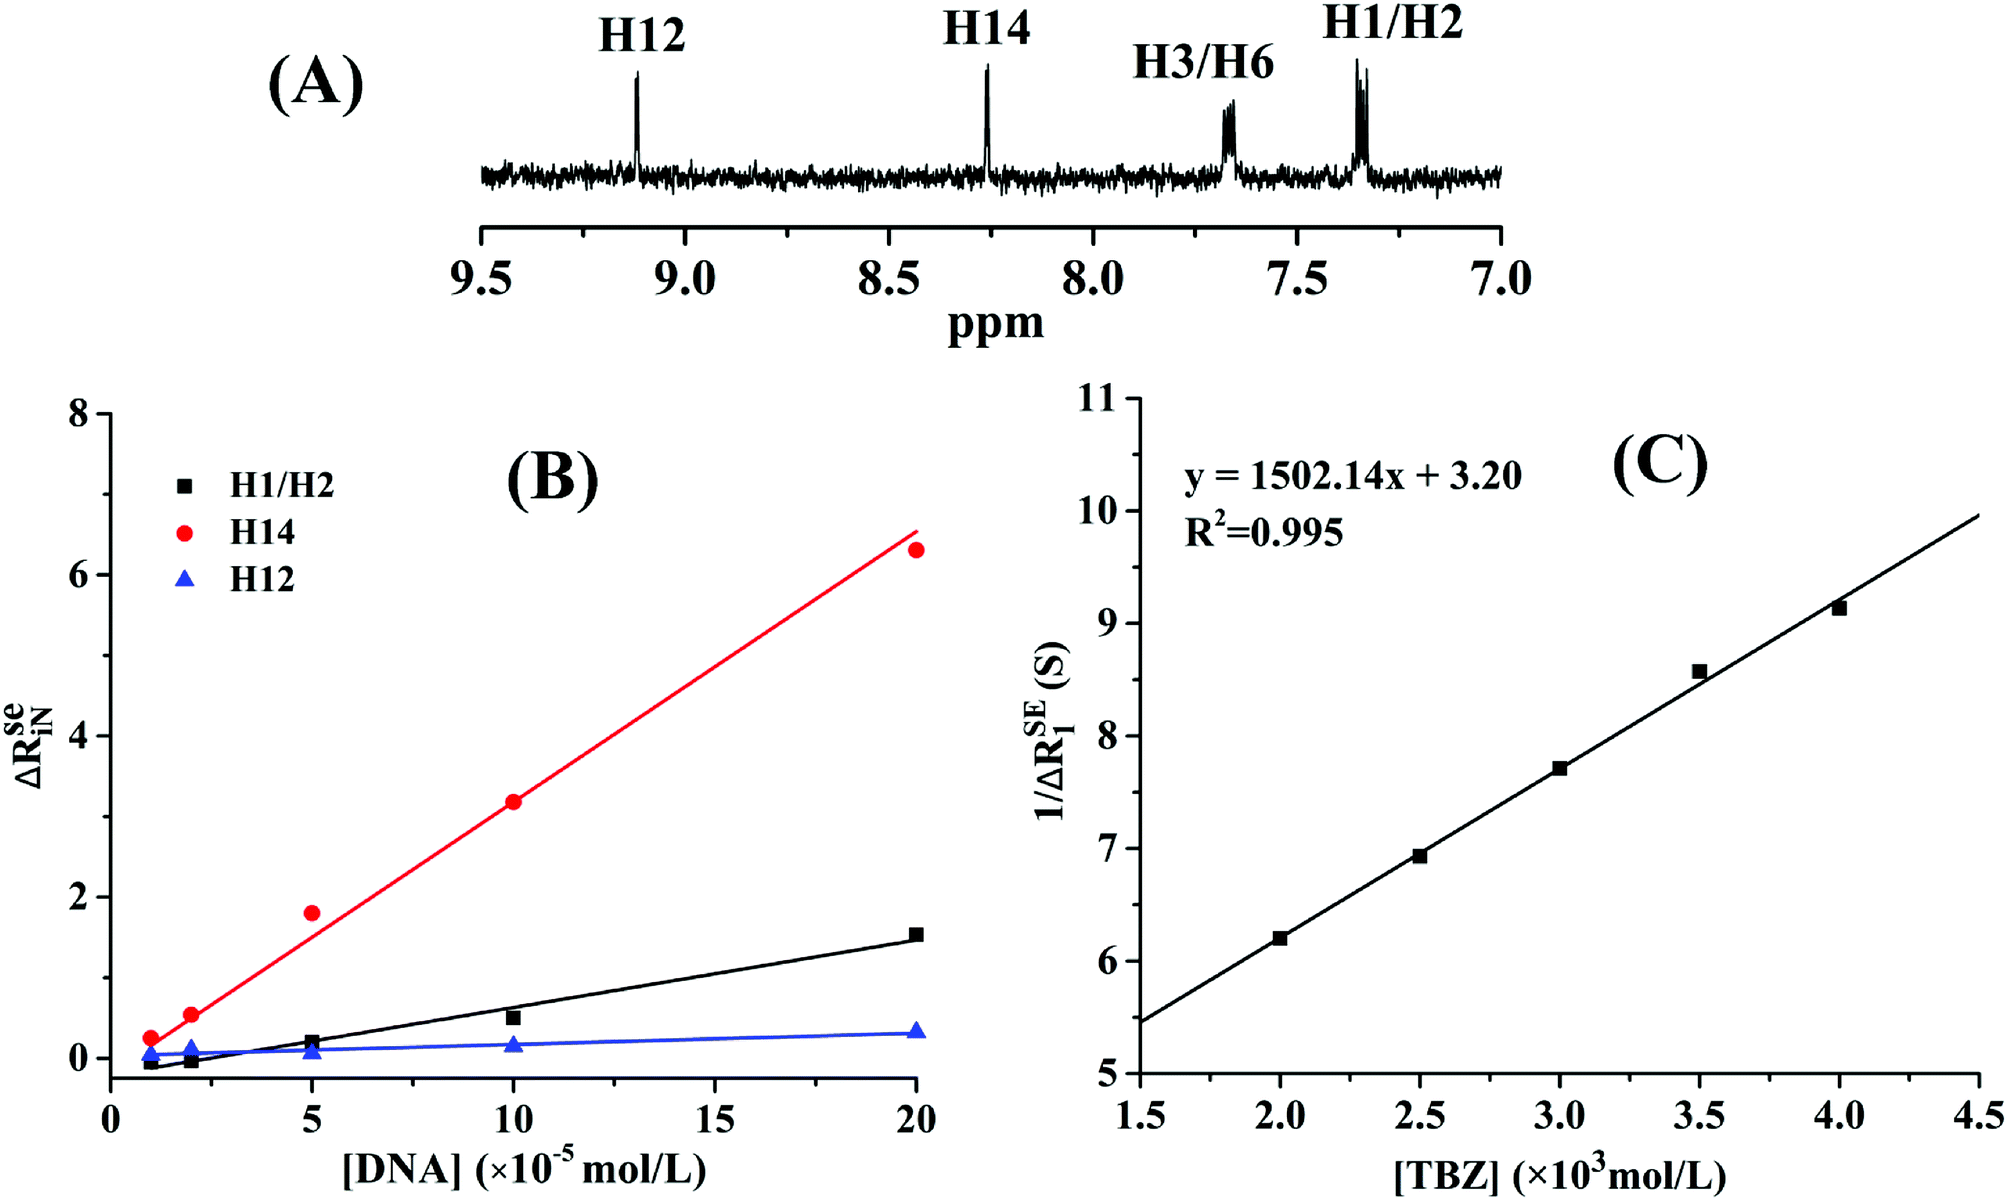
| Fig. 7 The fluorescence decay curve of TBZ in the presence and absence of hs-DNA (λex = 310 nm and λem = 360 nm). The inner figure is emission spectra of TBZ in different concentrations of DNA at 298 K. | ||
| T (K) | Ksv (L mol−1) | Ra | Ka (L mol−1) | n | Rb | ΔG (kJ mol−1) | ΔH (kJ mol−1) | ΔS [J (mol−1 K−1)] | Rc |
|---|---|---|---|---|---|---|---|---|---|
| a The correlation coefficient for the Ksv values.b Is the standard deviation for the K values.c The correlation coefficient for the van't Hoff plot. | |||||||||
| 298 | 275.63 | 0.991 | 471.56 | 1.094 | 0.996 | −15.220 | −30.779 | −52.385 | 0.975 |
| 303 | 265.23 | 0.975 | 385.75 | 1.063 | 0.999 | −14.906 | |||
| 310 | 258.06 | 0.985 | 267.44 | 1.004 | 0.994 | −14.540 | |||
| 317 | 249.94 | 0.994 | 221.65 | 0.966 | 0.995 | −14.173 | |||
As shown in Table 1, the value of K was 471.53 L mol−1 at 298 K, which was similar with NMR results. The values of K decreased with the increase of temperature, possibly indicating that the decomposition of the TBZ–DNA complex with the temperature increased. Moreover, the binding forces (including hydrogen bonds, electrostatic attraction, van der Waals forces, and hydrophobic interaction) were analyzed by the thermodynamic parameters using the Van't Hoff equation.14,34 Hydrogen bonds and van der Waals forces played the main role in the interaction because of the negative ΔH and ΔS. These values showed that the interaction was spontaneous and predominantly driven by enthalpy; these characteristics were consistent with the other non-intercalative binding.35 A previous study26 had shown that the binding was an entropy-driven process and maintained by hydrophobic force, the different thermodynamic behavior compared with this work might be due to the model selection of DNA from different sources.
3.3. Investigation of the binding mode
 | ||
| Fig. 8 (A) CD spectra of hsDNA with the increasing concentrations of TBZ. (B) Effect of increasing amounts of TBZ on the relative viscosity of hsDNA at 298 K. | ||
3.4. Structural changes analysis of DNA
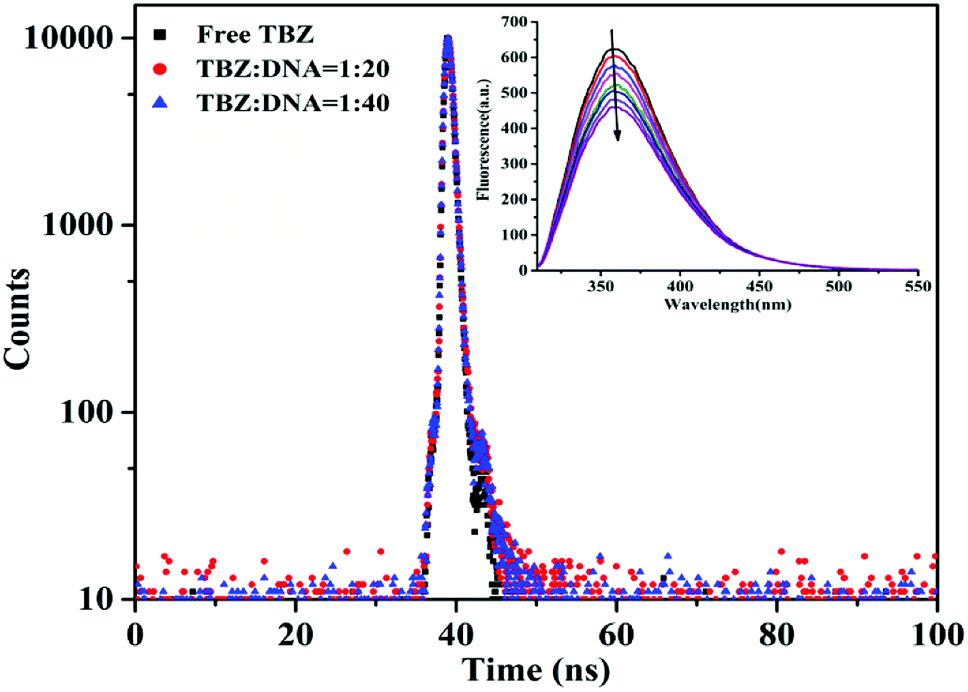
The infrared spectrum (FT-IR) is usually used to monitor the structure changes of biomacromolecules; the spectra of DNA are mainly confined from 1800 cm−1 to 700 cm−1 region to display protein secondary structure.40,41 The infrared spectral features of the free hsDNA and its complex form interacted with TBZ were shown in Fig. 9A. The band at 1712 cm−1 was related to guanine, which showed no change in wavenumber and intensity. The infrared band observed at 1639 cm−1 (thymine) showed a slight downshift. The infrared bands that appeared at 1541 (guanine and cytosine) and 1498 cm−1 (cytosine) all decreased in terms of intensity at all drug/DNA molar ratios. The deoxyribose sugar vibrations caused by C–C stretching were denoted by the infrared bands at 945 cm−1 in the spectrum of free hsDNA.42 The new negative band at 1017 cm−1 confirmed that TBZ reacted with hsDNA. | ||
| Fig. 9 (A) The difference spectra of free DNA (a) and [(DNA + TBZ) − TBZ]. (B) The difference spectra of free drug (a) and [(DNA + TBZ) − DNA]. The molar ratios ([TBZ]:[hsDNA]) for (b)–(d) were 1:20, 1:40 and 1:80, respectively. | ||
The difference spectra of [(DNA + TBZ) − DNA] (Fig. 9B) showed the remarkable negative band at 1639 cm−1 of thymine with decreasing intensity. The infrared band at 1102 cm−1 was primarily due to the phosphate symmetric vibrations; this band was assigned to the vibrations of the phosphodiester bonds (857 cm−1).43 The new band at 1410 cm−1 appeared when TBZ was added, which indicated that TBZ bound to hsDNA.
The structure of B-form is the closest with DNA in cell. FT-IR can be used to distinguish the DNA structure between B-form and A-form.44 The bands at 1461 and 1220 cm−1 were stable, revealing that the DNA conformation tend to be in B-form. In Fig. 9A, the positive band at 893 cm−1 appeared, indicating the partial perturbation of DNA conformation. Moreover, the appearance and disappearance of the band at 861 cm−1 with the addition of TBZ confirmed that the A-form DNA was unstable. Thus, the interaction of the food additive TBZ with hsDNA did not result in transitions in the DNA double helix conformation. hsDNA was in the B-form with the perturbation of B-form transformed into A-form, which meant that the DNA helix became short and compact.
4. Conclusions
In this study, the binding mechanism and conformation stability of TBZ to hsDNA were characterized by computer simulations and spectroscopic methods. Computer simulations showed that TBZ could combine with the groove region of DNA through hydrogen bonds and hydrophobic interactions. The thiazole and imidazole rings of TBZ, particularly nitrogen atoms, were the main groups that maintain the stability of the binding with DNA. According to RMSD results, MD simulations were divided into three stages. This finding indicated that TBZ moved from the middle to the terminal region of DNA to form a stable conformation. The mechanism of TBZ binding to DNA was static quenching with weak binding. The binding of TBZ induced the slight conformation changes in DNA. Through comparison of the present results with previous studies, the selection of DNA was important for the study of ligand–receptor interaction because of different binding mechanisms. This research provided an in-depth study of the binding mechanism, facilitated the application and development of computer simulations on the interactions of small molecules and bio-macromolecules, and provided information on the selection of DNA model from different sources in interaction studies.Conflicts of interest
There are no conflicts to declare.Acknowledgements
This work was supported by Sichuan Science and Technology Program (Grant No. 2018JY0188), the National Natural Science Foundation of China (NNSFC Grant 21704069), and the Fundamental Research Funds for the Central Universities (Grant No. 2018SCU12043) the Postdoctoral Foundation of Sichuan University.References
- M. Blazková, P. Rauch and L. Fukal, Biosens. Bioelectron., 2010, 25, 2122–2128 CrossRef PubMed.
- N. B. Andrioli and M. D. Mudry, Discrete Appl. Math., 2011, 22, 17–23 Search PubMed.
- N. B. Andrioli, S. Soloneski, M. L. Larramendy and M. D. Mudry, Mutat. Res., Genet. Toxicol. Environ. Mutagen., 2014, 772, 1–5 CrossRef PubMed.
- Y. Feng, M. Lv, Y. Lu, K. Liu, L. Liu, Z. He, K. Wu, X. Wang, B. Zhang and X. Wu, Food Chem., 2017, 243, 118–124 CrossRef PubMed.
- V. Ferraro, A. R. Madureira, B. Sarmento, A. Gomes and M. E. Pintado, Food Res. Int., 2015, 77, 450–459 CrossRef.
- X. Wang, Y. Liu, L. L. He, B. Liu, S. Y. Zhang, X. Ye, J. J. Jing, J. F. Zhang, M. Gao and X. Wang, Food Chem. Toxicol., 2015, 78, 42–51 CrossRef PubMed.
- A. Opar, Nat. Rev. Drug Discovery, 2009, 8, 437–438 CrossRef PubMed.
- Q. Zhang, Y. Huang, L. Guo, C. Chen, D. Guo, Y. Chen and Y. Fu, New J. Chem., 2014, 38, 4600–4606 RSC.
- N. Shahabadi and M. Maghsudi, Mol. BioSyst., 2013, 10, 338–347 RSC.
- A. Boroujeni, Z. Khorasani-Motlagh and M. Noroozifar, J. Biomol. Struct. Dyn., 2016, 34, 414–426 Search PubMed.
- Z. Aramesh Boroujeni, M. Khorasani-Motlagh and M. Noroozifar, J. Biomol. Struct. Dyn., 2016, 34, 414–426 Search PubMed.
- X. Zhou, C. Zhang, G. Zhang and Y. Liao, RSC Adv., 2016, 6, 5408–5418 RSC.
- S. Yilmaz, F. Unal, D. Yüzbaşıoğlu and M. Celik, Toxicol. Ind. Health, 2014, 30, 926–937 CrossRef PubMed.
- S. Sharma, M. Yadav, S. P. Gupta, K. Pandav and S. Kumar, Chem.-Biol. Interact., 2016, 260, 256–262 CrossRef PubMed.
- C. G. Reinhardt and T. R. Krugh, Biochemistry, 1978, 17, 4845–4854 CrossRef PubMed.
- X. Li and S. Wang, New J. Chem., 2014, 39, 386–395 RSC.
- C. Ràfols, S. Zarza and E. Bosch, Talanta, 2014, 130, 241–250 CrossRef PubMed.
- M. Šimšíková, Arch. Biochem. Biophys., 2016, 593, 69–79 CrossRef PubMed.
- K. J. Czogalla, A. Biswas, K. Höning, V. Hornung, K. Liphardt, M. Watzka and J. Oldenburg, Nat. Struct. Mol. Biol., 2016, 24, 77–85 Search PubMed.
- A. Ahmedbelkacem, L. Colliandre, N. Ahnou, Q. Nevers, M. Gelin, Y. Bessin, R. Brillet, O. Cala, D. Douguet and W. Bourguet, Nat. Commun., 2016, 7, 12777 CrossRef PubMed.
- M. P. Williamson, Prog. Nucl. Magn. Reson. Spectrosc., 2013, 73, 1–16 CrossRef PubMed.
- A. Gossert and W. Jahnke, Prog. Nucl. Magn. Reson. Spectrosc., 2016, 97, 82–125 CrossRef PubMed.
- R. Amiri, A. K. Bordbar, M. F. Garcã-A-Mayoral, A. R. Khosropour, I. Mohammadpoor-Baltork, M. MenãNdez and D. V. Laurents, J. Colloid Interface Sci., 2012, 369, 245–255 CrossRef PubMed.
- D. Wu, Y. Zhai, J. Yan, K. Xu, Q. Wang, Y. Li and H. Li, RSC Adv., 2015, 5, 11036–11042 RSC.
- Y. Wang, T. Zhang, J. Xu and W. Du, Int. J. Biol. Macromol., 2011, 48, 81–86 CrossRef PubMed.
- F. Jalali and P. S. Dorraji, Arabian J. Chem., 2013, 77, S3947–S3954 Search PubMed.
- M. Xu, Z. R. Ma, L. Huang, F. J. Chen and Z. Z. Zeng, Spectrochim. Acta, Part A, 2011, 78, 503–511 CrossRef PubMed.
- S. Fujiwara and T. Amisaki, Proteins: Struct., Funct., Bioinf., 2006, 64, 730–739 CrossRef PubMed.
- Y. Cao and X. W. He, Spectrochim. Acta, Part A, 1998, 54, 883–892 CrossRef.
- Q. Sun, H. Yang, P. Tang, J. Liu, W. Wang and H. Li, Food Chem., 2017, 243, 74–81 CrossRef PubMed.
- A. Sharma, S. Anandakumar and M. Ilanchelian, RSC Adv., 2014, 4, 36267–36281 RSC.
- L. Fotouhi and M. Zabeti, Monatsh. Chem., 2016, 147, 837–844 CrossRef.
- B. Barare, M. Yildiz, H. Ünver and K. Aslan, Tetrahedron Lett., 2016, 57, 537–542 CrossRef.
- Q. Wang, Q. Sun, P. Tang, B. Tang, J. He, X. Ma and H. Li, RSC Adv., 2015, 5, 81696–81706 RSC.
- M. M. V. Ramana, R. Betkar, A. Nimkar, P. Ranade, B. Mundhe and S. Pardeshi, Spectrochim. Acta, Part A, 2016, 152, 165–171 CrossRef PubMed.
- H. Yang, P. Tang, B. Tang, Y. Huang, X. Xiong and H. Li, RSC Adv., 2017, 7, 10242–10251 RSC.
- D. Ajloo, M. E. Moghadam, K. Ghadimi, M. Ghadamgahi, A. A. Saboury, A. Divsalar, M. Sheikhmohammadi and K. Yousefi, Inorg. Chim. Acta, 2015, 430, 144–160 CrossRef.
- N. Shahabadi and S. Amiri, Spectrochim. Acta, Part A, 2015, 138, 840–845 CrossRef PubMed.
- S. Zhang, X. Sun, R. Kong and M. Xu, Spectrochim. Acta, Part A, 2015, 136, 1666–1670 CrossRef PubMed.
- A. A. Ouameur and H. A. Tajmir-Riahi, J. Biol. Chem., 2004, 279, 42041–42054 CrossRef PubMed.
- F. A. Joozdani, F. Yari, P. A. Joozdani and S. Nafisi, PLoS One, 2015, 10, e0127541 Search PubMed.
- D. K. Jangir, G. Tyagi, R. Mehrotra and S. Kundu, J. Mol. Struct., 2010, 969, 126–129 CrossRef.
- G. Tyagi, S. Charak and R. Mehrotra, J. Photochem. Photobiol., B, 2012, 108, 48–52 CrossRef PubMed.
- L. Han, Y. Zhou, X. Huang, M. Xiao, L. Zhou, J. Zhou, A. Wang and J. Shen, Spectrochim. Acta, Part A, 2014, 123, 497–502 CrossRef PubMed.
| This journal is © The Royal Society of Chemistry 2018 |