 Open Access Article
Preparation of self-healing polyurethane/functionalized graphene nanocomposites as electro-conductive one part adhesives†
Farzaneh Hashemi Nasr a,
Mehdi Barikani*b and
Mehdi Salehirada
aChemistry and Process Department, Niroo Research Institute, P.O. Box 1468613113, Tehran, Iran
bDepartment of Polyurethane and Advanced Materials, Iran Polymer and Petrochemical Institute, P.O. Box 14965/115, Tehran, Iran. E-mail: M.Barikani@ippi.ac.ir
First published on 4th September 2018
Abstract
We report the synthesis and investigation of the electrical conductivity and self-healing properties of moisture curable polyurethane (PU) adhesives filled with functionalized graphene nanosheets and isophorone diisocyanate (IPDI) loaded poly(methyl methacrylate) (PMMA) nanocapsules. For this purpose, chemically functionalized graphene was prepared by covalently grafting 4-(4,5-diphenyl-1H-imidazol-2-yl)phenol (DIP) on the surface of graphene oxide and synthesized PMMA nanocapsules were loaded with IPDI. Both nanofillers were then dispersed in a polyurethane matrix and the effects on the adhesion properties of the adhesives in aluminum–aluminum metal joints were studied. The results showed that by surface modification and better exfoliation of graphene nanosheets, the electrical conductivity was increased from 2.2 × 10⁻⁹ S m−1 to 4.1 S m−1 for pure PU and 10 wt% graphene based nanofiller loaded PU, respectively. The thermal stability, electrical conductivity, shear strength and self-healing process of the ECAs were also studied. The results provide evidence that the prepared adhesives have the potential for applications in electronic device packaging.
Introduction
There are increasing concerns regarding the use of solder (as a conductive path) containing lead, a material harmful to humans and the environment, in the electronic industry.1,2 In this regard, nano based electrically conductive adhesives (ECAs) consisting of a polymeric resin and conductive nanofillers have been intensively employed to replace harmful metal interconnectors in the electronics industry.3–5 The lower temperature processing, lower cost, lower stress, greater flexibility, creep resistance and energy damping of polymeric materials provide advantages over inorganic eutectics.6,7 Up to now, different electrically conductive adhesives based on epoxy resins have been successfully developed and characterized owing to their ease of processing, strong adhesion to a wide range of metals, high tensile strength and modulus, good resistance to heat, chemicals and moisture, and dimensional stability.8–10 However, the resin is intrinsically brittle and susceptible to deterioration under crack formation and propagation.11 Therefore, it cannot be a good option in flexible electronic applications. In contrast to common epoxy-based, two-component or premixed and frozen single-component systems, one part conductive polyurethane adhesives can be efficiently tailored to give a diverse range of products and show more benefits such as flexibility, cost effectiveness, no need for mixing, indefinite pot life with rapid cure at room temperature and a wide application temperature range.12Considering various electrically conductive fillers, graphene related materials have received great research interest for their distinct electrical, optical, thermal, and mechanical properties.13–17 Due to the strong intermolecular van der Waals forces existing among graphene nanosheets, achieving homogenous and well exfoliated graphene sheets with single or few layers in both solvents and polymers is challenging.18–20 Therefore, physical and chemical surface modification and functionalization of nanosheets through bulk or solution-based chemical approaches have been employed for higher stabilization of dispersed nanomaterials.21,22 In this regard, by simple organic reactions, GO is able to covalently bind with polymers or small molecules and after reduction, functionalized graphene nanosheets can be more compatible with polymer matrixes and organic solvents.
Microcracking and hidden damage can lead to structural failures in polymeric matrixes. In such cases, the use of self-healing materials will be very beneficial and effective, because of their great potential for the prevention of polymer degradation and reduction of maintenance costs.23,24 The concepts of extrinsic and intrinsic self-healing exist for this process. The extrinsic healing is classified into three main groups: capsule based, vascular, and intrinsic based,25 in which the embedded healing agents are released after crack formation. In this industry, micro/nanocapsule embedment systems were observed to be one of the most effective approaches for the provision of self-healing ability.26 Nanocapsules based on polymeric materials can be applied as containers for healants. They can encapsulate a larger quantity of guest substance in their cores and release this on demand at a later stage.27,28 In these nanomaterials, healing is promoted by crack propagation through incorporating capsules in the matrix, which then release their contents into crack surfaces.29 Isocyanates are a kind of healing material which can develop one-part, catalyst-free self-healing processes while exposed to moist or aqueous environments.30 In contrast, intrinsic self-healing is based on reversible covalent31 or noncovalent supramolecular interactions32 such as π–π interactions33 or hydrogen bonding34 and takes place autonomously or with an external trigger like heat or pressure.
In this study, we report the synthesis of IPDI loaded PMMA nanocapsules and DIP functionalized graphene nanosheets for achieving the purposes of self-healing and electrical conductivity for polyurethane adhesives, respectively. Polyurethanes with different structures were prepared from polyols (PEG and PCL) and diisocyanates (HDI and TDI) and the conductive nanofillers and nanocapsules as healing materials were further dispersed into polyurethane matrixes in order to prepare the as-mentioned adhesives. The physical properties of the conductive nanofillers, nanocapsules and adhesives were investigated. In addition, the effect of graphene based nanofillers on the shear strength, thermal stability and electrical conductivity properties of ECAs was studied. The efficiency of the self-healing performance based on the nanocapsules and hydrogen bonding interactions is also demonstrated in this study.
Experimental
Materials and methods
Graphite flakes (GFs, lateral size < 50 μm), 4-dimethylaminopyridine (DMAP, 99 wt%), N,N dicyclohexylcarbodiimide (DCC, 99 wt%), hydrazine monohydrate (80 wt%), sodium dodecyl sulfate (SDS, 97 wt%), methyl methacrylate (MMA, 99 wt%), azobisisobutyronitrile (AIBN, 98 wt%), isophorone diisocyanate (IPDI, 98 wt%), toluene diisocyanate (TDI, 95 wt%), and hexamethylene diisocyanate (HDI, 98 wt%) were obtained from Sigma-Aldrich. Potassium permanganate (KMnO4, 99 wt%), concentrated sulphuric acid (H2SO4, 98 wt%), phosphoric acid (H3PO4, 85 wt%), hydrochloric acid (HCl, 32 wt%), hydrogen peroxide (H2O2, 30 wt%), benzil 98 wt%, 4-hydroxybenzaldehyde 98 wt%, ammonium acetate (NH4OAC, 98 wt%), poly ethylene glycol (PEG, BioUltra, Mn = 2000 g mol−1), glacial acetic acid (HOAC, 99.8 wt%), ε-caprolactone 99 wt%, Sn(Oct)2 92.5 wt%, ethylene glycol 99.8 wt%, ethyl acetate 99.5 wt%, isopropyl alcohol 99.5 wt%, N,N-dimethylformamide (DMF, 99 wt%), chloroform 99 wt%, and 1,4-dioxane 99.8 wt% were purchased from Merck Chemicals Co.Characterization
The synthesized structures were characterized using FT-IR (Bruker-equinox 55) and 1H NMR (Bruker, 500 MHz). Thermal properties of adhesives and the content of functional groups grafted to the nanosheets were estimated by thermogravimetric analysis (TGA) with a DuPont Instruments (TGA 951) analyzer at a heating rate of 10 °C min−1 in a nitrogen atmosphere. The crystal structures of samples were determined by X-ray diffraction (XRD, X-pert Philips, model no: PW 3040/60) analysis with Cu Kα (λ = 1.54056 Å) radiation. Raman spectra were recorded using a Horiba Jobin Yvon HR800 Raman spectrometer, which was equipped with an Ar laser (487.97 nm, 180 mW) as the excitation light source, and an Olympus BX41 microscope. The morphology of the nanosheets was studied by field emission scanning electron microscopy (FE-SEM, HITACHI S-4160). The thickness of the nanosheets was obtained using atomic force microscopy (AFM, Nanowizard II, JPK, Germany). The number-average molecular weight (Mn), weight average molecular weight (Mw) and polydispersity index (PDI) of polymers were analyzed using gel permeation chromatography (GPC, Agilent GPC 1100). For determination of the shear strength of prepared PU based adhesives, lap shear analysis was used according to ASTM D1002 using a Universal Testing Machine (Instron 5566, USA) in tension, equipped with a 30 kN load cell and the speed was 1.3 mm min−1. The volume resistivity (R) of ECA samples was measured using a U-NITUT39A multimeter (0–200 MΩ). The absorbance wavelengths of the prepared materials were recorded by UV-Vis spectrophotometry (Perkin Elmer, lambda 800).Synthesis of GO
The GO sample was prepared by chemical treatment of natural graphite powder using the improved Hummers method according to the published literature.35Synthesis of DIP-g-GO
DIP was synthesized according to a reported method.36 DMAP and DCC can perform the esterification reaction between the carboxylic acid groups within the GO molecular structure and the hydroxyl groups of DIP. First, GO (0.15 g) was dispersed in DMF by ultrasonication for 30 min. DCC (2 g, 10 mmol) and DMAP (0.15 g, 1.2 mmol) were dissolved in DMF and added to the GO nanosuspension at room temperature. After the dissolution of DMAP, DIP (0.5 g, 1.6 mmol) was added and the mixture was stirred at 50 °C for 72 h. To quench the reaction, an equimolar amount of HCl was added to the mixture to neutralize DMAP. The neutralized DIP-g-GO was then precipitated with isopropyl alcohol and DIP-g-GO powder was obtained. The precipitates were obtained by centrifugation at 5000 rpm for 10 min. The product was dried in vacuo at 70 °C for 12 hours.Synthesis of DIP-g-rGO
The chemical reduction of DIP-g-GO to DIP-g-rGO was accomplished by hydrazine monohydrate similar to the published literature.37 DIP-g-GO (0.15 g) powder was suspended in 50 ml water to give a brown dispersion, and exfoliation was achieved by ultrasonication for 1 h, to eliminate the agglomeration of GO nanosheets at the air/water interface a layer of water-immiscible liquid such as mineral oil was added to the DIP-g-GO suspension.38 The resulting homogeneous dispersion was mixed with 2.5 ml hydrazine solution and heated at 95 °C for 4 h. After the completion of the reaction, the nanosheets were collected by filtration as a black powder. For further purification, the product was washed with deionized water several times to remove excess hydrazine and dried in vacuo at 70 °C for 12 hours.Poly(methyl methacrylate) synthesis (PMMA)
PMMA was synthesized similarly to a reported process39 with some modifications. Briefly, in a round bottom flask equipped with a nitrogen inlet–outlet tube, a water-cooled condenser and a magnetic stirrer, MMA (2 g, 19 mmol) was mixed with AIBN (0.018 g, 0.1 mmol) in dioxane (10 ml) as the solvent. The resulting solution was heated at 60 °C for 14 h under nitrogen, and after cooling, the mixture was poured into methanol and the formed precipitated high molecular weight polymer chains and suspended low molecular weight ones were separated. For further purification, each part was dissolved in dioxane and precipitated using n-hexane (3 times). The products were dried in vacuo at 90 °C for 12 hours.Synthesis of IPDI loaded PMMA nanocapsules
Encapsulation of self-healing agents in PMMA nanocapsules occurred by the combination of solvent evaporation and miniemulsion techniques.27 Briefly, PMMA (250 mg) and IPDI (250 mg) were dissolved in 5 ml chloroform as the oil phase and stirred at 600 rpm for 20 min. Then, the aqueous phase was prepared by the dissolution of 0.03 g SDS in 30 ml deionized water to give a concentration of 1 mg ml−1. The oil phase was added dropwise to the aqueous solution and an oil-in-water (O/W) type emulsion was formed by ultrasonication for 2 min. The sample was kept in an ice bath to prevent overheating. Then, the organic solvent was evaporated by stirring in an oil bath at 40 °C overnight. Finally, the mixture was freeze dried to produce the nanocapsules.Preparation of one part moisture curable polyurethane adhesives
For this investigation, different types of prepolymers were synthesized according to the procedures in our previous studies40 by the step-growth polymerization of the polyols PEG (Mn = 2000 g mol−1) and PCL (Mn = 5000 g mol−1)) and the diisocyanates (HDI and TDI). PCL was synthesized according to the literature.41 All four different compositions of prepolymers (PU1, PU2, PU3 and PU4) were prepared under the same conditions (Table 2). The polyol was placed into a four-necked reaction kettle equipped with a mechanical stirrer, heating oil bath, reflux condenser, dropping funnel and N2 inlet–outlet. The temperature of the oil bath was increased to 60 °C. Then, diisocyanate was added and the temperature was increased to 90 °C. The molar ratio of polyol to diisocyanate was 1![[thin space (1/6-em)]](https://www.rsc.org/images/entities/char_2009.gif) :
:![[thin space (1/6-em)]](https://www.rsc.org/images/entities/char_2009.gif) 1.3. It almost took 2 h to obtain NCO-terminated prepolymers. Finally, acetone as the solvent was added to the polyurethane prepolymer and the product was kept tightly closed in a dry place. In all cases, the NCO content of the prepolymer was determined by a di-n-butylamine back-titration method according to ASTM D5155.
1.3. It almost took 2 h to obtain NCO-terminated prepolymers. Finally, acetone as the solvent was added to the polyurethane prepolymer and the product was kept tightly closed in a dry place. In all cases, the NCO content of the prepolymer was determined by a di-n-butylamine back-titration method according to ASTM D5155.
Fabrication of self-healing electrically conductive adhesives (ECAs)
For the preparation of ECAs, various amounts of DIP-g-rGO nanosheets (3, 7 and 10 wt%) were dispersed into each PU matrix in acetone by sonication to play the role of a network to provide a carrier transfer pathway. In addition, a constant percentage of IPDI encapsulated PMMA nanocapsules (2.5 wt%) was added to the matrix to achieve the self-healing ability. Finally, the formulated pastes were manually printed on pre-cleaned glass molds to form samples of 10 × 10 mm with a thickness of 1 mm and then cured at room temperature for 24 h to prepare the desired PU films.Results and discussion
Synthesis and characterization of conductive nanofillers
In this study, one aim was to synthesize new conductive nanofillers based on graphene with exfoliated layers to be used in conductive adhesives. In this regard, the condensation of benzil with an aromatic aldehyde in the presence of ammonium acetate was adopted as a convenient synthetic method for the preparation of a triaryl imidazole (DIP) (Scheme 1a). Then, the improved Hummers method was used to prepare graphene oxide from pristine graphite. As presented in Scheme 1b, GO nanosheets have reactive oxygen functional groups, such as hydroxyl and epoxy groups on the basal planes and carboxylic acid groups at their edges. Hence, GO nanosheets were successfully functionalized with DIP groups by the Steglich esterification process using DCC and DMAP. Finally, modified graphene oxide (DIP-g-GO) was chemically reduced to a colloid state, using hydrazine monohydrate, which resulted in a black precipitate (DIP-g-rGO) from the original yellow-brown GO suspension. Presumably, this is a result of an increase in the hydrophobicity of the material due to the decrease in polar functionality on the surface of the nanosheets.42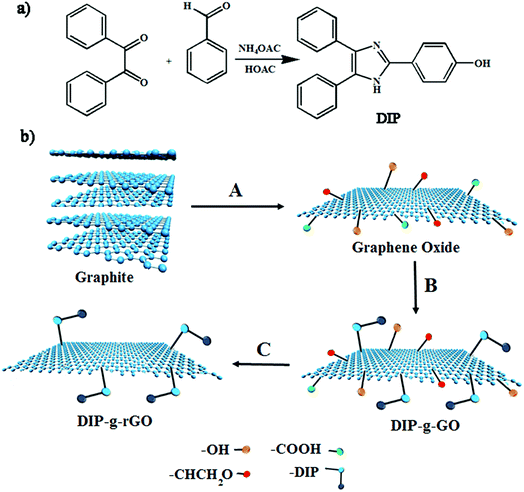 | ||
| Scheme 1 Synthesis pathways for the preparation of (a) DIP and (b) GO, DIP-g-GO and DIP-g-rGO. (A) H2SO4, H3PO4, KMNO4; (B) DIP, DCC, DMAP; (C) NH2–NH2. | ||
Raman spectroscopy is an appropriate and powerful tool to determine the structure of graphene-based materials.43 According to Fig. 1a, both materials had two characteristic peaks at around 1350 cm−1 (D band) and 1590 cm−1 (G band). For DIP-g-GO, the D and G bands were at 1352 cm−1 and 1599 cm−1, respectively. However, the D band of DIP-g-rGO was located around 1347 cm−1, while the corresponding G mode was shifted to 1589 cm−1. In addition, the ID/IG intensity ratio of DIP-g-GO had a value of approximately 0.97, whereas the value for DIP-g-rGO was almost 1.04. The increase of the ID/IG intensity ratio has been reported for GO after covalent functionalization.44 In addition, the increase could be attributed to the partial removal of oxygen moieties and conversion of sp2 carbon atoms in GO to sp3 carbon atoms in graphene.45 According to reported results, this may be due to the creation of some structural defects which are produced simultaneously during the reduction process.46,47 The observed peaks at ∼2700 cm−1 are named the 2D band in carbon based materials. Consistent with the literature,48 bilayer sheets or sheets with fewer than five layers show a broader and symmetrical 2D band, whereas bulk graphite or graphene sheets with more than five layers cause the 2D band to split into several overlapping modes. As shown in Fig. 1a, a broad and symmetrical 2D band in the 2500–3200 cm−1 region was observed, which indicates that graphene nanosheets with fewer than five layers were obtained in DIP-g-rGO samples.
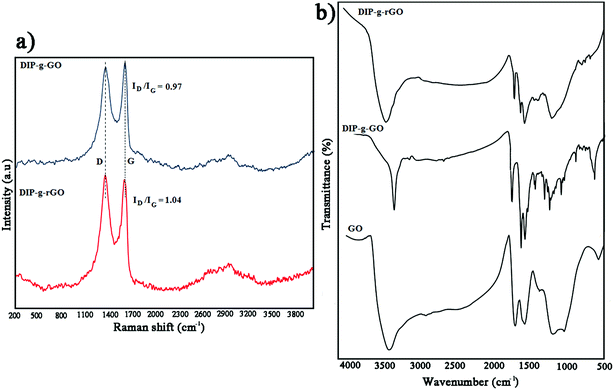 | ||
| Fig. 1 (a) Raman spectra of DIP-g-GO and DIP-g-rGO and (b) FT-IR spectra of GO, DIP-g-GO and DIP-g-rGO. | ||
FT-IR analyses were performed to prove the presence of pendant DIP groups in DIP-g-GO and DIP-g-rGO samples (Fig. 1b). The FT-IR spectrum of GO confirms the formation of hydroxyl, carbonyl, epoxy and alkoxy groups during the oxidation process at 3000–3700 cm−1, 1730 cm−1, 1217 cm−1 and 1056 cm−1, respectively.35 The main absorption bands for DIP were observed at 1065, 1550, 1620, 3100 and 3450 cm−1 related to the stretching vibrations of C–O, C![[double bond, length as m-dash]](https://www.rsc.org/images/entities/char_e001.gif) C, C
C, C![[double bond, length as m-dash]](https://www.rsc.org/images/entities/char_e001.gif) N, C–H and N–H bands (Fig. S1a†). In addition, the assigned 1H NMR spectrum of DIP is shown in Fig. S1b.† As can be seen from Fig. 1b, the appearance of absorption bands at 1750 cm−1 assigned to the stretching vibration of carbonyl groups corroborates the formation of ester groups by the Steglich esterification process in DIP-g-GO samples. In addition, the absence of a broad band between 3000–3700 cm−1 related to carboxylic acids in the GO structure and the appearance of a new peak at 3450 cm−1 (N–H) confirms the formation of DIP-g-GO. After the reduction reaction, the absence of absorption bands at 1056 cm−1 and 1217 cm−1 indicates the deletion of alkoxy and epoxy groups from the nanosheets. The presence of characteristic peaks of DIP in the DIP-g-rGO spectrum proves that the grafted DIP was not considerably affected by hydrazine.
N, C–H and N–H bands (Fig. S1a†). In addition, the assigned 1H NMR spectrum of DIP is shown in Fig. S1b.† As can be seen from Fig. 1b, the appearance of absorption bands at 1750 cm−1 assigned to the stretching vibration of carbonyl groups corroborates the formation of ester groups by the Steglich esterification process in DIP-g-GO samples. In addition, the absence of a broad band between 3000–3700 cm−1 related to carboxylic acids in the GO structure and the appearance of a new peak at 3450 cm−1 (N–H) confirms the formation of DIP-g-GO. After the reduction reaction, the absence of absorption bands at 1056 cm−1 and 1217 cm−1 indicates the deletion of alkoxy and epoxy groups from the nanosheets. The presence of characteristic peaks of DIP in the DIP-g-rGO spectrum proves that the grafted DIP was not considerably affected by hydrazine.
The XRD patterns of GO, DIP-g-GO, DIP and DIP-g-rGO are shown in Fig. S2.† The diffraction peak at 2θ = 26.71° with a d spacing of 0.34 nm was assigned to the crystalline and characteristic (002) reflection of pristine GF. After the oxidation reaction, the considerable shift of the (002) reflection from 0.34 nm to 0.70 nm proves the formation of GO nanosheets (Fig. S2a†). The increase in the d spacing of GO compared to GF is due to the incorporation of various oxygen functional groups in between the (002) planes of GF. After DIP attachment on GO nanosheets, the (002) reflection shifted to a lower value (2θ = 8.85°) and the d spacing increased to 1.01 nm, indicating that the introduction of DIP groups gave rise to the interlayer spacing of the GO nanosheets (Fig. S2b†). In the case of DIP-g-rGO, the absence of a peak at 8.85° and the appearance of a new reflection at 25.4° confirmed the successful reduction reaction due to the removal of water and other oxygenated functional groups from the GO surface (Fig. S2d†).42
TGA analysis was used to investigate thermal stability and the grafting ratio of functional groups on synthesized structures, as shown in Fig. 2 (left). In the TGA curve of GO, there is about a 12 wt% weight loss below 160 °C, and a major weight loss of about 20 wt% between 100 and 250 °C which correspond to the removal of absorbed water and the release of CO and CO2 from the most labile functional groups. Between 250 and 600 °C, a slower mass loss was observed which can be attributed to the removal of more stable oxygenated functional groups.35 The decomposition temperature for DIP was about 210 °C (Fig. S3†), which overlapped with the release temperature of oxygenated functional groups in the case of DIP-g-GO. The improved thermal stability of GO after modification is due to the inter and intramolecular interactions of GO and DIP. As observed in the TGA curve, a weight loss of about 70 wt% starts to appear at a higher peak temperature about ∼230 °C to 600 °C. According to these data, there was about 33.3 wt% of DIP and 66.7 wt% of GO in DIP-g-GO structures. Due to the elimination of oxygen containing groups through the reduction process, the weight loss of DIP-g-rGO was mostly related to the loss of DIP (∼30 wt%).
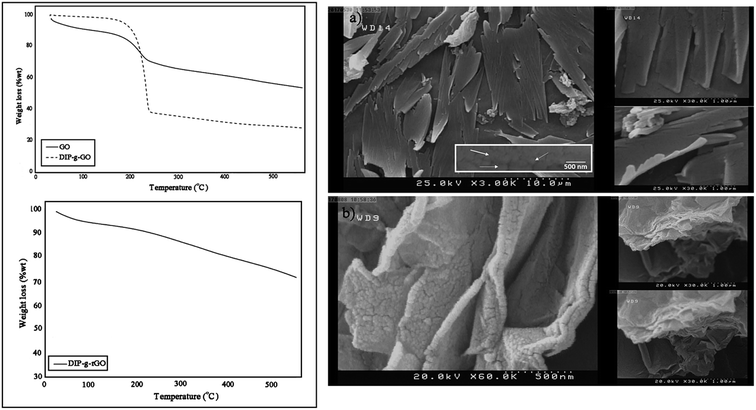 | ||
| Fig. 2 TGA thermograms of GO, DIP-g-GO and DIP-g-rGO (left) and SEM images of (a) DIP-g-GO and (b) DIP-g-rGO (right). | ||
In order to obtain morphological information for DIP-g-GO and DIP-g-rGO, FE-SEM observations were conducted. As illustrated in Fig. 2 (right), DIP-g-GO nanosheets exhibited uniform flakes with a few wrinkles and protrusions with many small dots, which correspond to DIP groups. In some regions, a little folding and sticking was observed which is due to the intermolecular interactions between oxygenated functional groups and the amine group in the imidazole ring. After the reduction process, the surfaces of nanosheets became rough and debundled which demonstrates that the surfaces of DIP-g-rGO nanosheets were still densely functionalized by small sized groups, which is the evidence for DIP molecules on the nanosheets.
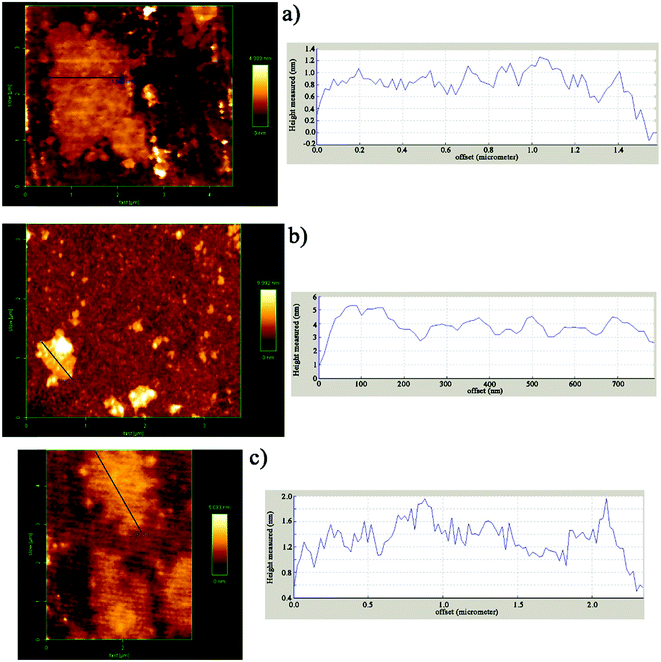
AFM was used in tapping mode to determine the thickness as a criterion of the exfoliation degree of nanosheets (Fig. 3). The height profile shown in Fig. 3a is related to GO with an average thickness of about 1 nm which is in accordance with published studies.49–51 On the basis of AFM measurements on DIP-g-GO, the nanosheets were of a similar size to the GO sheets, but they were much thicker than GO (4–5 nm). This clearly demonstrates that the presence of DIP groups on the surface of GO nanosheets resulted in much more intermolecular interaction between GO nanosheets due to the presence of hydroxyl, carboxyl and amine groups of GO and DIP, respectively. In contrast, the AFM height image for DIP-g-rGO provides convincing evidence that individual graphene nanosheets with a thickness of 1–1.2 nm could be prepared by chemical reduction of surface functionalized GO nanosheets.
PMMA and PMMA based nanocapsule characterization
The molar mass averages of the number (Mn) and weight (Mw) and polydispersity index (PDI) of the synthesized PMMA were determined by GPC (Table 1). The GPC curves are shown in Fig. S4.†| Polymer | Mn (g mol−1) | Mw (g mol−1) | PDI |
|---|---|---|---|
| PMMA-LMW | 7148 | 9645 | 1.34 |
| PMMA-HMW | 21![[thin space (1/6-em)]](https://www.rsc.org/images/entities/char_2009.gif) 969 969 |
29![[thin space (1/6-em)]](https://www.rsc.org/images/entities/char_2009.gif) 637 637 |
1.34 |
IPDI loaded nanocapsules were prepared by a general and facile method achieved by the combination of solvent evaporation and miniemulsion techniques. To evaluate the properties of the nanocapsules, the morphology of PMMA-LMW and PMMA-HMW based nanocapsules was investigated using FE-SEM (Fig. 4). As shown in Fig. 4a, the preparation conditions and surfactant content for LMW nanocapsules are appropriate and the nanocapsules are spherical and stable with non-collapsed structures. In contrast, this method was not appropriate for HMW nanocapsules as these were aggregated due to the lack of enough surfactant. Hence, PMMA-LMW nanocapsules were used for self-healing purposes.
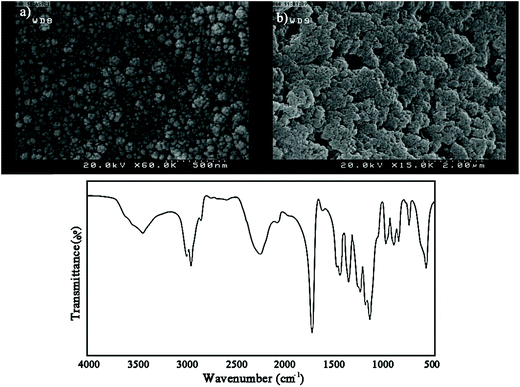 | ||
| Fig. 4 (a and b) Representative SEM micrographs of the prepared nanocapsules and (c) FT-IR spectrum of IPDI loaded PMMA-LMW nanocapsules. | ||
The chemical structure of IPDI loaded PMMA-LMW nanocapsules was investigated using FT-IR. Based on Fig. 4b, in addition to the main PMMA absorption bands at 1150–1275, 1393, 1735, 2957, 2996 and 3452 cm−1 related to the stretching vibrations of C–O–C, α-methyl groups, C![[double bond, length as m-dash]](https://www.rsc.org/images/entities/char_e001.gif) O, CH2, CH3 and –OH (physisorbed moisture), the large –NCO stretching peak at 2259 cm−1 confirmed that IPDI was encapsulated in the nanocapsules.
O, CH2, CH3 and –OH (physisorbed moisture), the large –NCO stretching peak at 2259 cm−1 confirmed that IPDI was encapsulated in the nanocapsules.
Preparation of one part moisture curable polyurethane adhesives
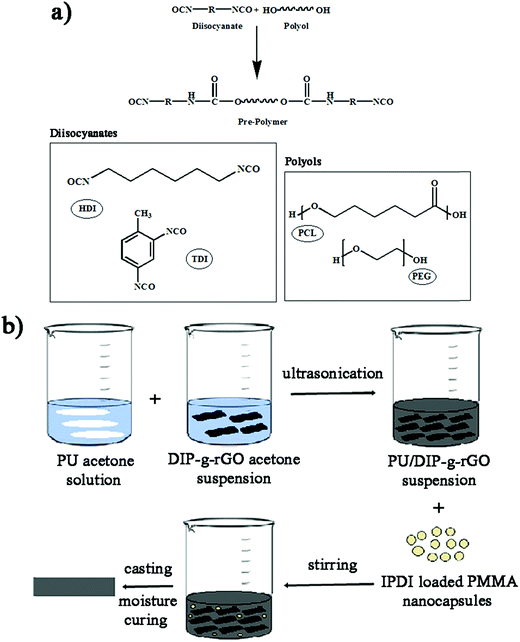
NCO terminated PUs were synthesized through a prepolymerization method using different polyols and diisocyanates (Scheme 2a).The formulations used for preparing moisture curable PUs are given in Table 2. The experimental values of NCO content of the prepolymers were also determined and found to be close to the theoretical values.
| Sample codes | NCO content | PEG (g) | PCL (g) | HDI (g) | TDI (g) | |
|---|---|---|---|---|---|---|
| Experimental | Theoretical | |||||
| PU1 | 5.42 | 5.40 | 3.33 | — | — | 0.75 |
| PU2 | 7.81 | 7.78 | 3.33 | — | 0.73 | — |
| PU3 | 8.55 | 8.51 | 3.00 | 0.33 | — | 0.75 |
| PU4 | 10.60 | 10.56 | 3.00 | 0.33 | 0.73 | — |
Fabrication of self-healing and electrically conductive adhesives
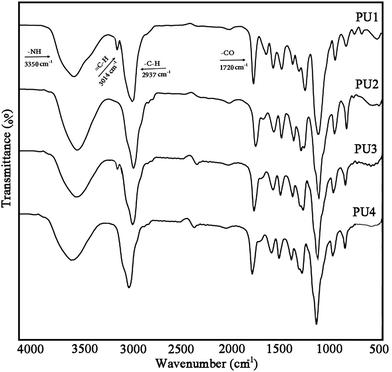
Scheme 2b illustrates the preparation process of self-healing ECAs in this study. At first, a PU acetone solution and DIP-g-rGO acetone suspension were mixed together in a certain ratio. Then, IPDI loaded PMMA nanocapsules in a constant amount were added and stirred at room temperature after complete mixing. Finally, the formulated pastes were manually printed on pre-cleaned glass molds and cured at room temperature for the preparation of the one part adhesives.FT-IR analysis was performed to detect the formation of urethane linkages by the reaction between polyols and diisocyanates through monitoring the absorption peaks of –NH and –CO at ∼3350 and ∼1720 cm−1, indicating the synthesis of a product which has –NHCOO groups (Fig. 5). In addition, the disappearance of the peak at ∼2260 cm−1 (NCO) in all samples confirmed that the urethane prepolymers had an average isocyanate functionality which was sufficient to allow the preparation of crosslinked polyurethanes upon curing with moisture. Free NCO groups would yield amines and CO2 in the presence of moisture that in turn would lead to polymerization and self-healing reactions.
Shear strength investigation via lap shear testing
The shear strength of adhesively bonded metal plates (108 mm × 25.4 mm × 1.62 mm) for PU1–PU4 was evaluated by means of standard test method ASTM D1002. Adhesive joints were pulled together by pressing the two plate surfaces coated with the degassed PU adhesives to make a lap area of 25.4 mm × 12.5 mm. Shear strength, reported in units of shear stress was calculated according to eqn (1):| Shear strength = failure load/adhesive lap area | (1) |
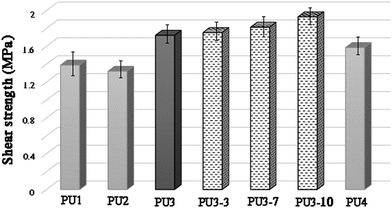
As can be seen from Fig. 6, the chemical structure and molecular weight of components are important factors for the adhesion of PU1–PU4 to the metal surface. The maximum loads for PU1–PU4 were 441.96, 420.05, 547.68 and 504.19 N, respectively. The shear strength test results showed that the adhesion strength of all the kinds of adhesive were in the range from 1.32 to 1.72 MPa, depending on the structure of the polyol and the diisocyanate. The highest shear strength was observed for PU3 which is mainly due to the increase in the number of OH groups of the adhesive due to the presence of two different polyols in its structure in comparison to PU1 and PU2. In addition, as aromatic isocyanates (TDI) give more rigid PUs than aliphatic ones (HDI), PU3 showed enhanced mechanical properties compared to PU4. According to these results, PU3 was selected in an optimized formulation for PU-ECAs. The shear strength of PU3 based adhesives containing 3, 7 and 10 wt% DIP-g-rGO nanosheets and 2.5 wt% IPDI loaded nanocapsules was also tested. Compared with neat PU3, the shear strength was enhanced from 1.755 MPa to 1.931 MPa when the graphene based nanosheet loading increased from 3 to 10 wt%. This increase may result from the increased interaction between hydroxyl groups on the metal surface, oxygen and nitrogen functionalities on the graphene based nanofiller and the PU matrix that helps with the interfacial strength.
Thermal stability of ECAs
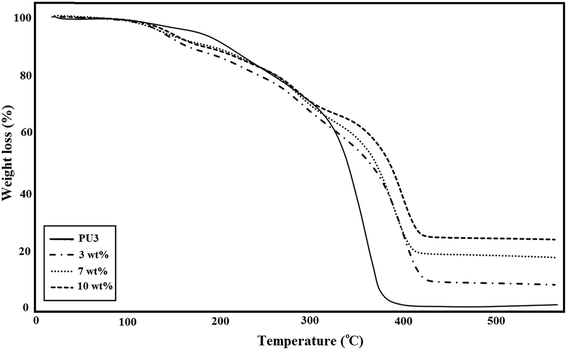
A comparison of the TGA curves of three different types of ECA based on PU3 is shown in Fig. 7. The amount of IPDI loaded PMMA nanocapsules was constant (2.5 wt%) in all samples. As illustrated in this figure, for all of the ECA samples, the thermal stability and remaining ash were higher than those of neat PU3. According to the literature52 the early stage degradation for PU occurred mainly in hard segments where urethane groups first undergo depolymerization, which results in individual monomers, and then, their further reaction produces carbon dioxide. The TGA curves showed that the degradation of PU started at about 260 °C and ended at 600 °C. The major decomposition of PMMA occurred in the temperature range 270–450 °C (∼85%) which is attributed to main chain scission.53 The mass loss onset point of IPDI as the core material is nearly 125 °C.54 After high temperature treatment, neat PU3 has ∼2.5 wt% residual, while the residual for ECA nanocomposites was around 10.3, 19.6, and 25.5 wt%, for 3, 7 and 10 wt% nanofiller, respectively which suggests the good stability of ECAs. The results showed that the temperature of maximum weight loss rate increased with the increase of nanofiller content. It was found that the thermal stability of these samples gradually improved, which is possibly because the interaction between DIP-g-rGO nanosheets and PU matrix at high content can effectively restrict the movement of PU chains. In fact, the physical interactions between both oxygenated groups on the graphene nanosheets and –NH functionalities on the grafted DIP with the PU3 matrix may lead to the formation of physical crosslinking between the nanofiller and polymer chains and an increase in char residues.Electrical conductivity measurements
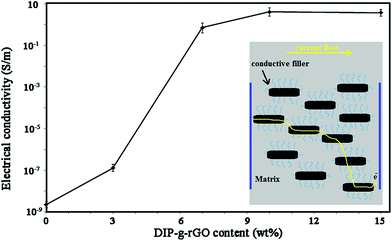
The conductive behavior of DIP-g-rGO based adhesives drove us to explore the effects of the nanofiller on the conductivity of the resulting ECAs. The electrical conductivity of moisture-cured adhesives was obtained by the following equation (eqn (2)):| ρ = l/RS = l/Rtw | (2) |
![[double bond, length as m-dash]](https://www.rsc.org/images/entities/char_e001.gif) C bonds and n–π* transitions of CHO bonds, respectively. The DIP compound exhibited a high energy absorption band with maxima from 205 nm to 300 nm which can be attributed to π–π* transitions resulting from conjugation between the aromatic rings and nitrogen atoms (data not shown). After the preparation of DIP-g-rGO (Fig. S5b†), three absorption peaks at 212, 231 and 303 nm, corresponding to DIP absorption in the ultraviolet region, were observed in the spectrum which confirmed the presence of DIP groups. Also, the absorption band at 298 nm was completely removed which confirmed the elimination of oxygen containing functional groups on the surface of GO during the reduction process.57 In addition, the characteristic absorption peak for graphene at 262 nm redshifts to 268 nm as a result of possible electron-transfer from the DIP moiety, an electron donor, to rGO, an electron acceptor. Therefore, the incorporation of DIP functional groups on graphene can prevent the restacking of graphene nanosheets, and improve the interfacial charge transfer process. However, the conductivity decreased when the content of nanofiller reached 15 wt%. It seems that by increasing the content of conductive nanofiller, fewer effective conductive networks will be formed and at the same time, the contact points among conductive fillers will be increased which are due to the agglomeration of nanofillers.13 In summary, the optimum amount of the conductive nanofiller was shown to be 10 wt%.
C bonds and n–π* transitions of CHO bonds, respectively. The DIP compound exhibited a high energy absorption band with maxima from 205 nm to 300 nm which can be attributed to π–π* transitions resulting from conjugation between the aromatic rings and nitrogen atoms (data not shown). After the preparation of DIP-g-rGO (Fig. S5b†), three absorption peaks at 212, 231 and 303 nm, corresponding to DIP absorption in the ultraviolet region, were observed in the spectrum which confirmed the presence of DIP groups. Also, the absorption band at 298 nm was completely removed which confirmed the elimination of oxygen containing functional groups on the surface of GO during the reduction process.57 In addition, the characteristic absorption peak for graphene at 262 nm redshifts to 268 nm as a result of possible electron-transfer from the DIP moiety, an electron donor, to rGO, an electron acceptor. Therefore, the incorporation of DIP functional groups on graphene can prevent the restacking of graphene nanosheets, and improve the interfacial charge transfer process. However, the conductivity decreased when the content of nanofiller reached 15 wt%. It seems that by increasing the content of conductive nanofiller, fewer effective conductive networks will be formed and at the same time, the contact points among conductive fillers will be increased which are due to the agglomeration of nanofillers.13 In summary, the optimum amount of the conductive nanofiller was shown to be 10 wt%.
Self-healing properties of prepared adhesives
A few articles describe the usage of micro or nano containers as self-healing agents especially in polyurethane matrixes, because polymers with urethane units are recognized as materials with self-healing properties.58 In order to investigate the self-healing behavior of ECAs, the evolution of cracks was observed qualitatively. A sample (PU3 containing 10 wt% DIP-g-rGO and 2.5 wt% IPDI loaded nanocapsules) as a dry 100 μm film was prepared and damaged with a paper knife to create a crack with 0.5 mm depth. It was stored in a climate chamber at 25 °C and 50% relative humidity (RH) and the crack evolution process was observed, as shown in Fig. 9. It was seen that the width of the crack disappeared completely when the time reached 20 h. In this experiment, two types of self-healing process (extrinsic and intrinsic) occurred which led to the reduction in self-healing time. In the extrinsic healing system, healing agent (IPDI) was embedded in PMMA nanocapsules that was released after crack formation. The encapsulated material, a monomeric aliphatic diisocyanate, is reactive with moisture and can be applied as an appropriate healing agent to synthesize one-part, catalyst-free self-healing materials.59 The intrinsic self-healing was performed by hydrogen bonding autonomously in the presence of moisture. The water molecules act as a plasticizer in polymer matrixes and lower the network density causing a plasticization effect by increasing the molecular dynamics of hydrogen bonding processes.60 The absorbed water molecules in polymeric matrixes can be present in three different states: bound to the polymeric chain, weakly bound water, and free water.61 Due to the presence of oxygenated and –NH functionalities on the graphene nanosheets and grafted DIP, respectively in the PU3 matrix, the ability to absorb moisture will be increased and as a result the self-healing time will be decreased.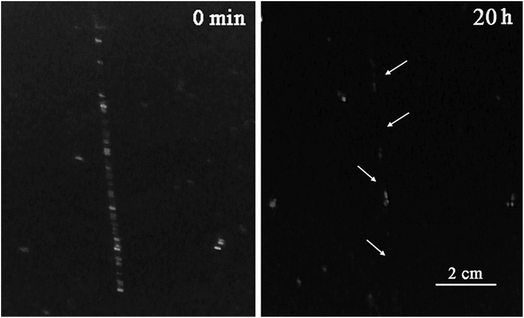 | ||
| Fig. 9 Self-healing test for a PU3 based ECA containing 10 wt% DIP-g-rGO and 2.5 wt% IPDI loaded nanocapsules. | ||
Conclusion
In summary, different moisture curable PU based adhesives were prepared and the one with the highest adhesion strength was adopted for use as an electrically conductive and self-healing adhesive. In this regard, functionalized graphene nanosheets as the conductive nanofiller and IPDI loaded PMMA nanocapsules were synthesized to be dispersed in the PU matrix to achieve these as-mentioned purposes. We found that the shear strength was mainly dependent on the chemical structure of PU and the nanofiller, which is the result of interaction between hydroxyl groups on the metal surface, oxygen, and nitrogen functionalities on the graphene based nanofiller and PU matrix that helps with the interfacial strength. In addition, by using the modification approach, we were able to facilitate the dispersion of graphene nanosheets inside the polymer matrix, which resulted in improvements to the thermal and electrical properties of ECAs at low filler content. The self-healing test result showed that the presence of conductive nanofillers would help the healing process due to an increase in the moisture absorption ability. The prepared adhesive has the potential application to be used as a flexible packaging material in power electronic and microwave applications, or as a conductive paste for wearable radio-frequency devices, chip bonding and thermal interface materials.Conflicts of interest
There are no conflicts to declare.Acknowledgements
The authors want to express their sincere gratitude to Iran’s National Elites Foundation (INEF), the Niroo Research Institute (NRI) and the Iran Polymer and Petrochemical Institute (IPPI) for financially supporting this work.References
- L. Bauermann, E. Fokuhl, S. Stecklum, D. Philipp, T. Geipel, A. Kraft, U. Eitner, T. Fischer and D. Breitenbücher, Energy Procedia, 2017, 124, 554–559 CrossRef.
- K. Suzuki, O. Suzuki and M. Komagata, IEEE Trans. Compon., Packag., Manuf. Technol., Part A, 1998, 21, 252–258 CrossRef.
- E. Messina, N. Leone, A. Foti, G. Di Marco, C. Riccucci, G. Di Carlo, F. Di Maggio, A. Cassata, L. Gargano, C. D’Andrea, B. Fazio, O. M. Maragò, B. Robba, C. Vasi, G. M. Ingo and P. G. Gucciardi, ACS Appl. Mater. Interfaces, 2016, 8, 23244–23259 CrossRef PubMed.
- Y. Li, K. Moon and C. Wong, Nano-conductive Adhesives for Nano-electronics Interconnection, Nano-Bio-Electronic, Photonic and MEMS Packaging, ed. C. Wong, K. S. Moon and Y. Li, Springer, Boston, 2010 Search PubMed.
- J. Luo, Z. Cheng, C. Li, L. Wang, C. Yu, Y. Zhao, M. Chen, Q. Li and Y. Yao, Compos. Sci. Technol., 2016, 129, 191–197 CrossRef.
- Y. Li and C. P. Wong, Mater. Sci. Eng., R, 2006, 51, 1–35 CrossRef.
- I. Mir and D. Kumar, Int. J. Adhes. Adhes., 2008, 28, 362–371 CrossRef.
- Z. A. Ghaleb, M. Mariatti, Z. M. Ariff and J. Ervina, J. Mater. Sci.: Mater. Electron., 2018, 29, 3160–3169 CrossRef.
- H. Kishi, S. Tanaka, Y. Nakashima and T. Saruwatari, Polymer, 2016, 82, 93–99 CrossRef.
- J. Gu, C. Liang, X. Zhao, B. Gan, H. Qiu, Y. Guo, X. Yang, Q. Zhang and D. Y. Wang, Compos. Sci. Technol., 2017, 139, 83–89 CrossRef.
- A. Q. Barbosa, L. F. M. da Silva, J. Abenojar, M. Figueiredo and A. Öchsner, Composites, Part B, 2017, 114, 299–310 CrossRef.
- Z. Li, R. Zhang, K. Moon, Y. Liu, K. Hansen, T. Le and C. P. Wong, Adv. Funct. Mater., 2013, 23, 1459–1465 CrossRef.
- H. Ma, M. Ma, J. Zeng, X. Guo and Y. Ma, Mater. Lett., 2016, 178, 181–184 CrossRef.
- Y. Lai and N. Tai, ACS Appl. Mater. Interfaces, 2015, 7, 18553–18559 CrossRef PubMed.
- H. Kim and S. Lee, Fibers Polym., 2017, 18, 1304–1313 CrossRef.
- Y. Guo, G. Xu, X. Yang, K. Ruan, T. Ma, Q. Zhang, J. Gu, Y. Wu, H. Liu and Z. Guo, J. Mater. Chem. C, 2018, 6, 3004–3015 RSC.
- M. Casa, M. Sarno, R. Liguori, C. Cirillo, A. Rubino, E. Bezzeccheri, J. Liu and P. Ciambelli, J. Nanosci. Nanotechnol., 2018, 18, 1176–1185 CrossRef PubMed.
- W. Ai, J. Liu, Z. Du, X. Liu, J. Shang, M. Yi, L. Xie, J. Zhang, H. Lin, T. Yu and W. Huang, RSC Adv., 2013, 3, 45–49 RSC.
- T. Kuila, S. Bose, A. Mishra, P. Khanra, N. Kim and J. Lee, Prog. Mater. Sci., 2012, 57, 1061–1105 CrossRef.
- F. V. Ferreira, L. D. S. Cividanes, F. S. Brito, B. R. Canuto de Menezes, W. Franceschi, E. A. N. Simonetti and G. P. Thim, Functionalization of graphene and applications, in Functionalizing graphene and carbon nanotubes, Springer Briefs in Applied Sciences and Technology. Springer, Cham, 2016 Search PubMed.
- L. Gan, S. Shang, C. Wah, M. Yuen and S. Jiang, RSC Adv., 2015, 5, 15954–15961 RSC.
- V. Georgakilas, M. Otyepka, A. B. Bourlinos, V. Chandra, N. Kim, K. Christian Kemp, P. Hobza, R. Zboril and K. S. Kim, Chem. Rev., 2012, 112, 6156–6214 CrossRef PubMed.
- K. G. Nathalie, K. O. Kim, Z. Jiawen, H. Stefan, G. S. Friedrich and B. Christopher, Macromol. Chem. Phys., 2011, 212, 131–143 Search PubMed.
- C. Suryanarayana, K. ChowdojiRao and D. Kumar, Prog. Org. Coat., 2008, 63, 72–78 CrossRef.
- S. Ghosh, Self-healing Materials: Fundamentals, design strategies, and applications, Wiley-VCH Verlag Gmbh & Co., KGaA, 2009 Search PubMed.
- M. Samadzadeh, S. H. Boura, M. Peikari, S. M. Kasiriha and A. Ashrafi, Prog. Org. Coat., 2010, 68, 159–164 CrossRef.
- Y. Zhao, J. Fickert, K. Landfester and D. Crespy, Small, 2012, 8, 2954–2958 CrossRef PubMed.
- J. A. Syrett, C. R. Becer and D. M. Haddleton, Polym. Chem., 2010, 1, 978–987 RSC.
- Y. C. Yuan, T. Yin, M. Z. Rong and M. Q. Zhang, eXPRESS Polym. Lett., 2008, 2, 238–250 CrossRef.
- J. Yang, M. W. Keller, J. S. Moore, S. R. White and N. R. Sottos, Macromolecules, 2008, 41, 9650–9655 CrossRef.
- G. Deng, C. Tang, F. Li, H. Jiang and Y. Chen, Macromolecules, 2010, 43, 1191–1194 CrossRef.
- F. Herbst, D. Dohler, P. Michael and W. H. Binder, Macromol. Rapid Commun., 2013, 34, 203–220 CrossRef PubMed.
- S. Burattini, H. M. Colquhoun, J. D. Fox, D. Friedmann, B. W. Greenland, P. J. F. Harris, W. Hayes, M. E. Mackay and S. J. Rowan, Chem. Commun., 2009, 6717–6719 RSC.
- Q. Wang, J. L. Mynar, M. Yoshida, E. Lee, M. Lee, K. Okuro, K. Kinbara and T. Aida, Nature, 2010, 463, 339–343 CrossRef PubMed.
- H. Raghubanshi, S. M. Ngobeni, A. O. Osikoya, N. D. Shooto, C. W. Dikio, E. B. Naidoo, E. D. Dikio, R. K. Pandey and R. Prakash, J. Ind. Eng. Chem., 2017, 47, 169–178 CrossRef.
- A. Hariharasubramanian and Y. D. Ravichandran, RSC Adv., 2014, 4, 54740–54746 RSC.
- Z. Kachoei, S. Khoee and N. Sharifi, Iran. Polym. J., 2015, 24, 203–217 CrossRef.
- D. Li, M. B. Müller, S. Gilje, R. B. Kaner and G. G. Wallace, Nat. Nanotechnol., 2008, 3, 101–105 CrossRef PubMed.
- S. Khoee and Z. Kachoei, RSC Adv., 2015, 5, 21023–21032 RSC.
- K. M. Zia, M. Barikani, M. Zuber, I. A. Bhatti and H. N. Bhatti, Iran. Polym. J., 2008, 17, 61–72 Search PubMed.
- S. Khoee and M. Kardani, Eur. Polym. J., 2014, 58, 180–190 CrossRef.
- S. Pei and H. Cheng, Carbon, 2012, 50, 3210–3228 CrossRef.
- L. M. Malarda, M. A. Pimentaa, G. Dresselhaus and M. S. Dresselhaus, Phys. Rep., 2009, 473, 51–87 CrossRef.
- S. Niyogi, E. Bekyarova, M. E. Itkis, H. Zhang, K. Shepperd, J. Hicks, M. Sprinkle, C. Berger, C. N. Lau, W. A. deHeer, E. H. Conrad and R. C. Haddon, Nano Lett., 2010, 10, 4061–4066 CrossRef PubMed.
- T. Kuila, S. Bose, P. Khanra, N. H. Kim, K. Y. Rhee and J. H. Lee, Composites, Part A, 2011, 42, 1856–1861 CrossRef.
- H. Hu, X. Wang, J. Wanga, L. Wana, F. Liu and H. Zheng, Chem. Phys. Lett., 2010, 484, 247–253 CrossRef.
- P. Lin, L. Meng, Y. Huang, L. Liu and D. Fan, Appl. Surf. Sci., 2015, 324, 784–790 CrossRef.
- O. Akhavan, E. Ghaderi, S. Aghayee, Y. Fereydoonia and A. Talebi, J. Mater. Chem., 2012, 22, 13773–13781 RSC.
- Y. Geng, S. J. Wang and J. K. Kim, J. Colloid Interface Sci., 2009, 336, 592–598 CrossRef PubMed.
- C. Chen, Q. Yang, Y. Yang, W. Lv, Y. Wen, P. Hou, M. Wang and H. Cheng, Adv. Mater., 2009, 21, 3007–3011 CrossRef.
- G. Shao, Y. Lu and F. Wu, J. Mater. Sci., 2012, 47, 4400–4409 CrossRef.
- K. M. Zia, M. Barikani, I. A. Bhatti, M. Zuber and H. N. Bhatti, J. Appl. Polym. Sci., 2008, 109, 1840–1849 CrossRef.
- A. Singhal, K. A. Dubey, Y. K. Bhardwaj, D. Jain, S. Choudhury and A. K. Tyagi, RSC Adv., 2013, 3, 20913–20921 RSC.
- W. Wang, L. Xu, F. Liu, X. Lia and L. Xing, J. Mater. Chem. A, 2013, 1, 776–782 RSC.
- Y. Wang, J. Yu, W. Dai, Y. Song, D. Wang, L. Zeng and N. Jiang, Polym. Compos., 2015, 36, 556–565 CrossRef.
- J. Ma, Q. Meng, A. Michelmore, N. Kawashima, Z. Izzuddin, C. Bengtsson and H. Kuan, J. Mater. Chem. A, 2013, 1, 4255–4264 RSC.
- T. Bai, C. Li, J. Sun, Y. Song, J. Wang, W. J. Blau, B. Zhang and Y. Chen, Chem.–Eur. J., 2015, 21, 1–7 CrossRef.
- Y. J. Kim, P. H. Huh and B. K. Kim, J. Polym. Sci., Part B: Polym. Phys., 2015, 53, 468–474 CrossRef.
- P. Kardar, Prog. Org. Coat., 2015, 89, 271–276 CrossRef.
- P. Cordier, F. Tournilhac, C. Soulie-Ziakovic and L. Leibler, Nature, 2008, 451, 977–980 CrossRef PubMed.
- C. Rodehed and B. Ranby, J. Appl. Polym. Sci., 1986, 32, 3309–3315 CrossRef.
Footnote |
| † Electronic supplementary information (ESI) available. See DOI: 10.1039/c8ra03685c |
| This journal is © The Royal Society of Chemistry 2018 |

