
 Open Access Article
 This Open Access Article is licensed under a Creative Commons Attribution-Non Commercial 3.0 Unported Licence
Tailoring the reducibility and catalytic activity of CuO nanoparticles for low temperature CO oxidation
Abdallah F. Zedan *ab,
Assem T. Mohameda,
M. Samy El-Shall*c,
Siham Y. AlQaradawia and
Amina S. AlJabera
*ab,
Assem T. Mohameda,
M. Samy El-Shall*c,
Siham Y. AlQaradawia and
Amina S. AlJabera
aDepartment of Chemistry and Earth Sciences, Qatar University, Doha 2713, Qatar. E-mail: azedan@qu.edu.qa
bNational Institute of Laser Enhanced Science, Cairo University, Giza 12613, Egypt
cDepartment of Chemistry, Virginia Commonwealth University, Richmond, VA 23284, USA. E-mail: mselshal@vcu.edu
First published on 29th May 2018
Abstract
Copper oxide (CuO) nanoparticles have received considerable interest as active and inexpensive catalysts for various gas–solid reactions. The CuO reducibility and surface reactivity are of crucial importance for the high catalytic activity. Herein, we demonstrate that the reducibility and stability of CuO nanoparticles can be controlled and tailored for the high catalytic activity of CO oxidation. The synthesized CuO nanoparticles possessed enhanced reducibility in CO atmosphere at lower reduction temperature of 126 °C compared to 284 °C for that of reference CuO particles. Moreover, the CuO catalysts with tailored reducibility demonstrated a reaction rate of 35 μmol s−1 g−1 and an apparent activation energy of 75 kJ mol−1. Furthermore, the tailored catalysts exhibited excellent long-term stability for CO oxidation for up to 48 h on stream. These readily-reducible CuO nanoparticles could serve as efficient, inexpensive and durable catalysts for CO oxidation at low temperatures.
1. Introduction
The catalytic oxidation of carbon monoxide (CO) to carbon dioxide (CO + 1/2 O2 → CO2) is an important model reaction that is often used to investigate the basic properties of different catalysts. Moreover, CO oxidation is practically important in many industrial and environmental applications such as air quality industries, closed-cycle carbon dioxide lasers, removal of CO traces from H2 fuel for polymer electrolyte membrane fuel cell systems1 and removal of poisonous CO gas in exhaust and flue emissions.2 Supported precious noble metals such as Au, Pt, Ru and Pd typically possess high catalytic activity for CO oxidation reaction. However, they are expensive and suffer from deactivation and deterioration particularly at high temperatures due to the enhanced mobility and sintering of individual particles.3 Therefore, there is a great need to develop inexpensive, yet active and durable catalysts for catalytic CO oxidation reaction at low temperatures.Copper oxide (CuO) nanostructures constitute a fascinating class of nanomaterials that has been the subject of intensive research over the past two decades. They have received considerable interest as abundant, non-plasmonic and low-cost materials for various applications such as gas adsorbents, gas sensors, electrode materials and efficient catalysts for many heterogeneous catalytic reactions.4–7 In particular, CuO nanoparticles have shown excellent catalytic activity for the standard and preferential CO oxidation reaction.8,9 Accordingly, great efforts have been devoted to the controlled synthesis of CuO nanomaterials of different particle size and morphologies and to the understanding of the key factors underlying their activity.10 In this regard, the rational control of the physicochemical and surface reduction properties of the CuO catalysts for improved activity is of great importance and remains a challenge. Such a rational control of the properties that are inherited from the preparation process could allow the tuning of the activity of CuO catalysts not only for CO oxidation but also for other heterogeneous catalytic reactions such as water-gas shift or CO2 conversion to methanol.11 In this paper, we report on the development of CuO catalysts with tailored reducibility and enhanced activity for CO oxidation. Our approach for the synthesis of CuO nanoparticles is based on the urea-assisted homogenous precipitation (UAHP) method employing various pre- and post-synthesis processing conditions to probe their influence on the surface reactivity and reduction behavior. Here, we validate the hypothesis that increasing the reducibility of the CuO catalysts could enhance their catalytic activity for CO oxidation at lower temperatures and thus minimize the energy consumption.
2. Materials and methods
2.1. Materials
Chemicals were purchased from Sigma-Aldrich (Taufkirchen, Germany) and used without further treatment including copper(II) nitrate trihydrate (purum, 98%, Sigma-Aldrich) and urea (purum p.a.: >99.0%, Fluka). The water used in all preparations and washing treatment was ultrapure (type 1) deionized water (Direct-Q 5UV, Millipore S.A.S., Molsheim, France).2.2. Methods
![[thin space (1/6-em)]](https://www.rsc.org/images/entities/char_2009.gif) :10. The reaction mixture was aged under stirring for pre-determined aging time at ambient temperature. Upon aging, the mixture was heated to 90 °C and was kept at this temperature under stirring for 2 h to allow the hydrolysis of urea and the homogenous precipitation of copper. After the UAHP treatment, the products were separated by centrifuge and rinsed three times with deionized water. Then, the products were dried in an electric oven (Isotemp 282A, Fisher Scientific, Marietta, OH, USA) at 80 °C overnight under ambient air. Finally, the products were calcined in muffle furnace (Nabertherm, Controller B 170, Bremen, Germany) in ambient air at 400 °C with a heating rate of 5° min−1 for pre-determined time. To understand the effect of aging time of the copper nitrate-urea mixture on the processing-inherited properties and the catalytic performance of the final CuO nanoparticles, we have synthesized various CuO nanoparticles without aging and with aging time of 2 h, 24 h and 72 h. For the samples aged for 24 h, the effect of calcination time was also studied by calcining samples at 400 °C for different calcination time of 1 h, 2 h and 4 h. For convenience, the different catalysts are given names as CuO(Ax h–Cx h) where Ax h denotes for the time of solution aging and Cx h denotes for the time of calcination. Table 1 lists all names and corresponding pre- and post-processing parameters for the different catalysts.
:10. The reaction mixture was aged under stirring for pre-determined aging time at ambient temperature. Upon aging, the mixture was heated to 90 °C and was kept at this temperature under stirring for 2 h to allow the hydrolysis of urea and the homogenous precipitation of copper. After the UAHP treatment, the products were separated by centrifuge and rinsed three times with deionized water. Then, the products were dried in an electric oven (Isotemp 282A, Fisher Scientific, Marietta, OH, USA) at 80 °C overnight under ambient air. Finally, the products were calcined in muffle furnace (Nabertherm, Controller B 170, Bremen, Germany) in ambient air at 400 °C with a heating rate of 5° min−1 for pre-determined time. To understand the effect of aging time of the copper nitrate-urea mixture on the processing-inherited properties and the catalytic performance of the final CuO nanoparticles, we have synthesized various CuO nanoparticles without aging and with aging time of 2 h, 24 h and 72 h. For the samples aged for 24 h, the effect of calcination time was also studied by calcining samples at 400 °C for different calcination time of 1 h, 2 h and 4 h. For convenience, the different catalysts are given names as CuO(Ax h–Cx h) where Ax h denotes for the time of solution aging and Cx h denotes for the time of calcination. Table 1 lists all names and corresponding pre- and post-processing parameters for the different catalysts.
| Catalysta | Solution aging time (h) | Calcination time (h) |
|---|---|---|
| a For all catalysts, urea-hydrolysis was carried out for 2 h at 90 °C and calcination was performed in ambient air at 400 °C with temperature ramp of 5 °C min−1. | ||
| CuO(A0 h–C2 h) | None | 2 h |
| CuO(A2 h–C2 h) | 2 h | 2 h |
| CuO(A24 h–C2 h) | 24 h | 2 h |
| CuO(A24 h–C1 h) | 24 h | 1 h |
| CuO(A24 h–C4 h) | 24 h | 4 h |
| CuO(A72 h–C2 h) | 72 h | 2 h |
cosθ), where D is the mean crystallite grain size, k is the so-called shape factor (used as 0.9), λ is the wavelength of the X-ray used (1.54056 nm for Cu-Kα1), β is the line broadening and θ is the angle of the X-ray reflection. The analysis was performed using angle and broadening information from the 100% XRD reflection (002) that is manifested at low angular value. Nitrogen adsorption and desorption isotherms of different samples were obtained at 77 K using a Micrometrics instrument ASAP 2460 pore size analyzer (Norcross, GA, USA) in the range of 0.05 to 1 relative pressure (P/P0). The specific surface area was derived using the BET (Brunauer–Emmett–Teller) method, and the pore size distribution and average pore size were estimated from the desorption branch using the BJH (Barret–Joyner–Halenda) method. Prior to analysis measurement, all samples were degassed in an N2–He mixture at 90 °C for 1 h and at 150 °C for an additional 1 h. Thermal gravimetric analysis was conducted using a Perkin Elmer thermal gravimetric analyzer (Pyris 6 TGA) (Groningen, Netherlands) from 50 °C to 700 °C in air at a linear heating rate of 10 °C min−1. X-ray photoelectron spectroscopy (XPS) measurements were carried out on a KRATOS AXIS Ultra XPS with a monochromatic Al Kα radiation source (1486.6 eV) in a UHV environment (ca. 5 × 10⁻⁹ torr) (KRATOS Analytical, Manchester, UK). The operating conditions were kept at constant high-resolution pass energy of 20 eV, emission current of 10 mA, and anode HT of 15 kV. To subtract the surface charging effect, the C1s peak at 284.8 eV was used for calibration. Temperature-programmed reduction (CO-TPR) analysis was carried out using a customized set-up equipped with an FTIR gas analyzer to detect CO consumption and CO2 generation. For each analysis, 50 mg of the calcined catalyst was heated from ambient temperature to 400 °C, with a heating rate of 5 °C min−1 under 10% CO/He balance at a flow rate of 50 ml min−1. Raman spectra were recorded using a DXR 2 Raman Microscope (Thermo Fisher Scientific, Madison, WI, USA) equipped with a 780 nm LASER source for excitation. The spectrum acquisition consisted of 20 accumulations with a total acquisition time of 5 min at a spectral resolution of 4 cm−1 and laser power of 5 mW. FTIR spectra were collected using NICOLET iS10 (Thermo Fisher Scientific, Madison, USA).000 cm3 g−1 h−1 WHSV). The flow rate was controlled by a set of digital mass flow controllers (HI-TEC, Model-F-201CV-10K-AGD-22-V, Multi-Bus, DMFC; Bronkhorst). All experiments were carried out at atmospheric pressure (1 atm) in the temperature range of 30 to 400 °C, with a ramp rate of 5 °C min−1. The effluent gas was fed into an inline multichannel infrared gas analyzer (IR200, Yokogawa, Japan) to analyze the exit gas and simultaneously monitor the CO conversion. The volume percent of the CO, CO2, and O2 gases was determined simultaneously and logged, along with the catalyst temperature during the experiment. The long-term stability of the selected catalyst was studied at a temperature of 160 ± 5 °C for 60 h under a continuous stream of feed gas. The catalytic activity was expressed by the conversion of CO in the effluent gas and indicated as CO fractional conversion.3. Results and discussion
3.1. Morphological microstructure
Copper oxide nanoparticles and other transition metal oxides of various microstructures and surface morphologies can be synthesized by several chemical and physical techniques such as microwave-assisted synthesis,14 hydrothermal,15 sonochemical,16 electrochemical,17 photochemical,18 arc-discharge,19 chemical precipitation,20 sol–gel,21 and urea-assisted homogenous precipitation (UAHP) method.22,23 Of particular interest, the UAHP method has attracted great attention owing to the fairly simple synthesis at mild temperature and ambient pressure, low cost processing and ease scalability.24–26 In addition, this method permits the controlled formation of metal oxide structures from solution-phase precursors such as metal salts in aqueous media and the low-supersaturation conditions derived by slow urea hydrolysis give rise to formation of smaller number of nuclei formed which finally leads to well-crystallized solid material.27,28 Regarding the synthesis of CuO nanoparticles, the method of preparation and the associated processing parameters are known to affect the structural morphology, the size and the surface properties of the resulting CuO nanoparticles which in turn can modulate their physicochemical and catalytic properties.10 These parameters include for example the choice of the metal precursor species, the processing temperature and pH, the precipitating agent and the molar ratio of the reducing agent to the metal ions.29 Therefore, the aging time of the reaction mixture in our synthesis prior to the heating and the urea hydrolysis step is expected to play a role in determining the inherited properties and the catalytic activity of the prepared CuO catalysts.Fig. 1a–f shows the SEM images of CuO nanoparticles that were prepared by the UAHP method under different pre- and post-synthesis processing parameters. For an aqueous solution of the Cu(NO3)2, water molecules can utilize the electrons in their bonding orbitals to coordinate to the Cu2+ metal ions resulting in weakening of the O–H bonds of bound water molecules which leads to hydrolysis or deprotonation based on the pH of the solution. When the reaction mixture is heated, urea undergoes hydrolysis in the aqueous solution at mild temperatures (60–100 °C) resulting in a controlled rise in the pH by slow generation of ammonium cations (NH4+) which causes condensation of amorphous hydrated oxide precipitates.30 The heat treatment of these precipitates during subsequent drying and calcination causes dehydration and formation of porous nanocrystalline CuO solid materials as can be seen in SEM images shown in Fig. 1.
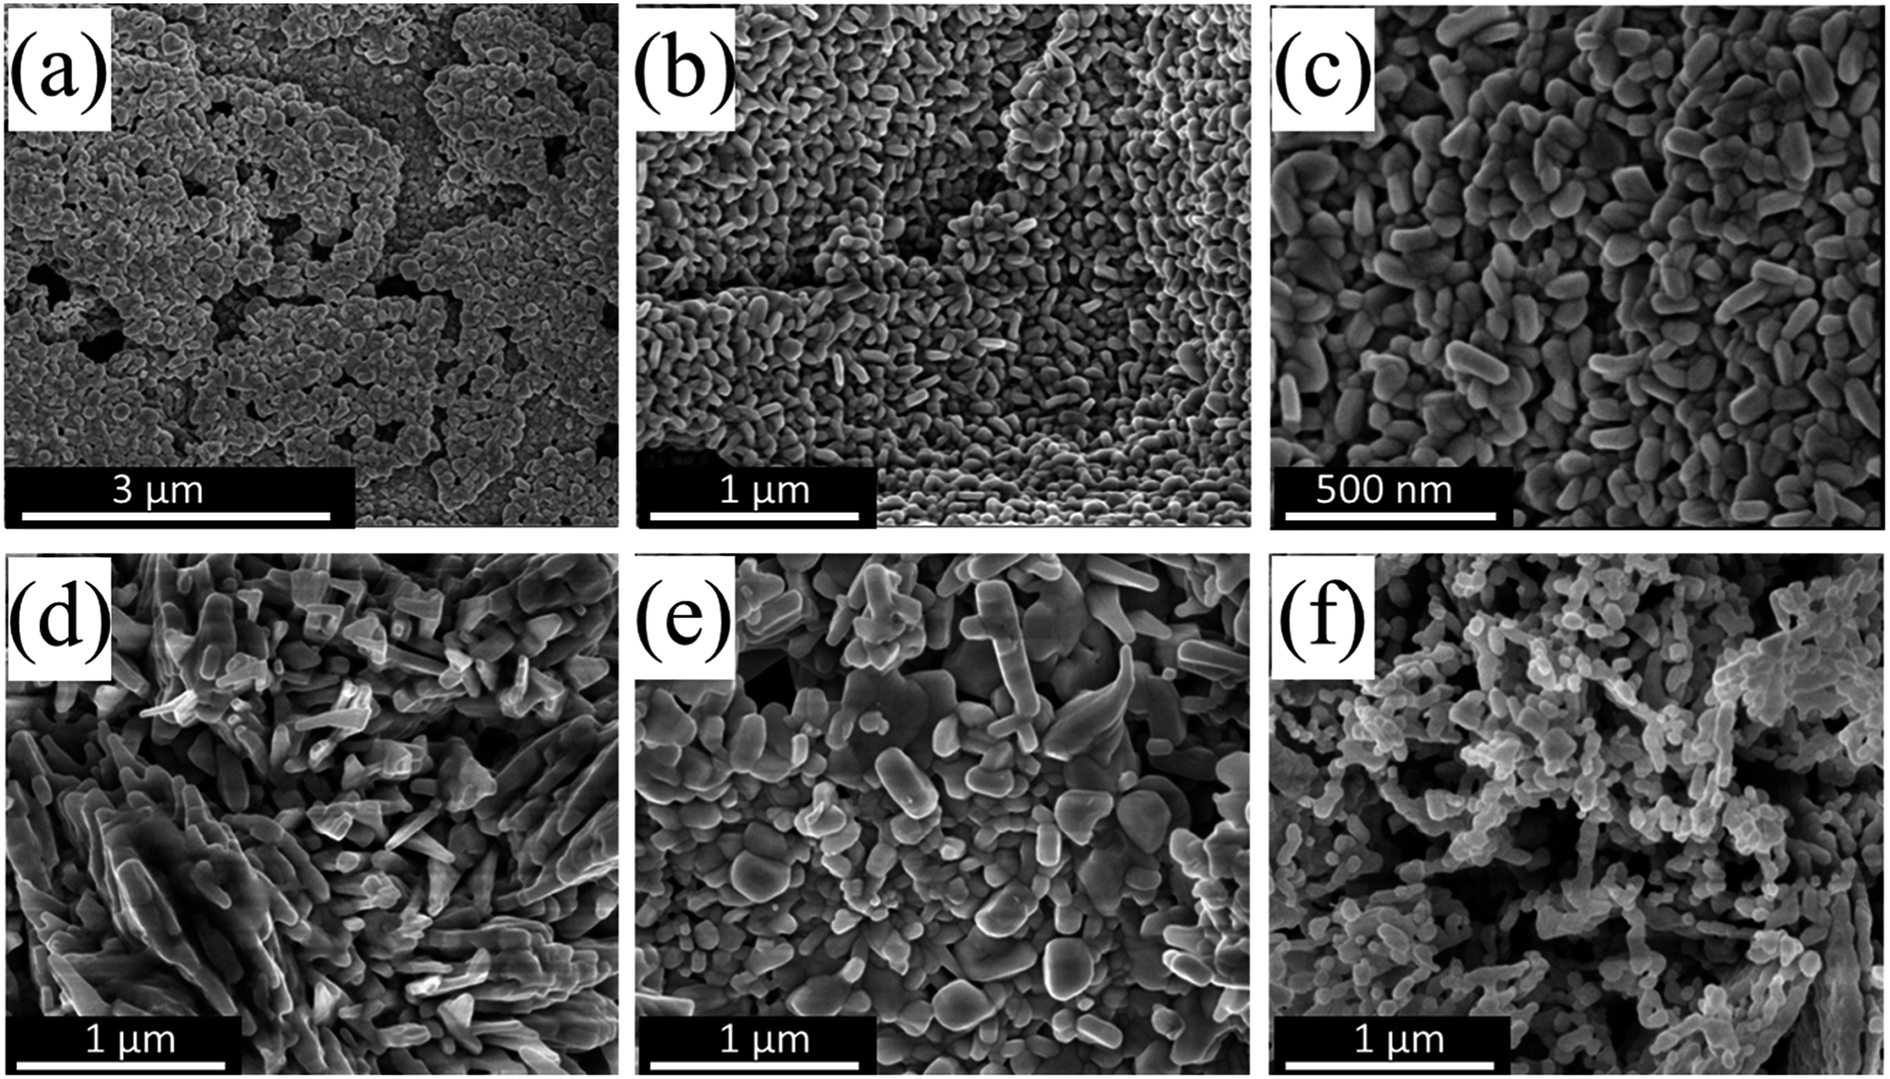 | ||
| Fig. 1 SEM images of (a–c) CuO(A24 h–C2 h), (d) CuO(A2 h–C2 h), (e) CuO(A72 h–C2 h) and (f) CuO(A24 h–C4 h) nanoparticles prepared by aging the reaction mixture for different times followed by the urea-assisted homogenous precipitation (UAHP) at 90 °C for 2 h and subsequent calcination at 400 °C in ambient air. | ||
For the CuO(A24 h–C2 h) prepared by aging the solution for 24 h prior to urea hydrolysis, the SEM images (Fig. 1a–c) reveal self-assemblies of small layers of CuO nanoparticles giving rise to porous features within the nanocrystalline solid. On the other hand the CuO(A2 h–C2 h) and CuO(A72 h–C2 h) that were aged for 2 h and 72 h rather form larger aggregates of CuO nanoparticles (Fig. 1d and e). The morphological characteristics of the CuO(A24 h–C4 h) that was aged for 24 h as CuO(A24 h–C2 h) but was annealed for 4 h is very close to that of the CuO(A24 h–C2 h) with smaller-sized CuO nanoparticles (Fig. 1f). The SEM results indicate the impact of the pre- and post-processing parameters on the microstructure of the prepared CuO nanoparticles which could translate into modulated properties and activities.
3.2. The crystal structure and thermal stability
Fig. 2 displays the powder XRD patterns of CuO(A2 h–C2 h), CuO(A24 h–C2 h), CuO(A24 h–C4 h) and CuO(A72 h–C2 h) nanoparticles compared to the reference copper oxide pattern. The diffraction patterns of all CuO catalysts exhibit three characteristic diffraction peaks in the range 32–40° at 32.5° (−110), 35.5° (002) and 38.7° (111) typical of single tenorite phase with monoclinic crystal structure as correlated with the reference pattern number (card JCPDS no. 00-045-0937) and that reported in the literature.31 The strong diffraction peaks of all samples indicate the purity and the high crystalline nature of the all CuO nanoparticles. The average crystallite sizes estimated using the Scherrer equation analysis for the selected CuO catalysts are 21 nm, 20 nm, 16 nm and 22 nm for CuO(A2 h–C2 h), CuO(A24 h–C2 h), CuO(A24 h–C4 h) and CuO(A72 h–C2 h), respectively. The relative particle sizes estimated from the XRD analysis for the different CuO nanoparticles agree with the results from the SEM imaging shown in Fig. 1.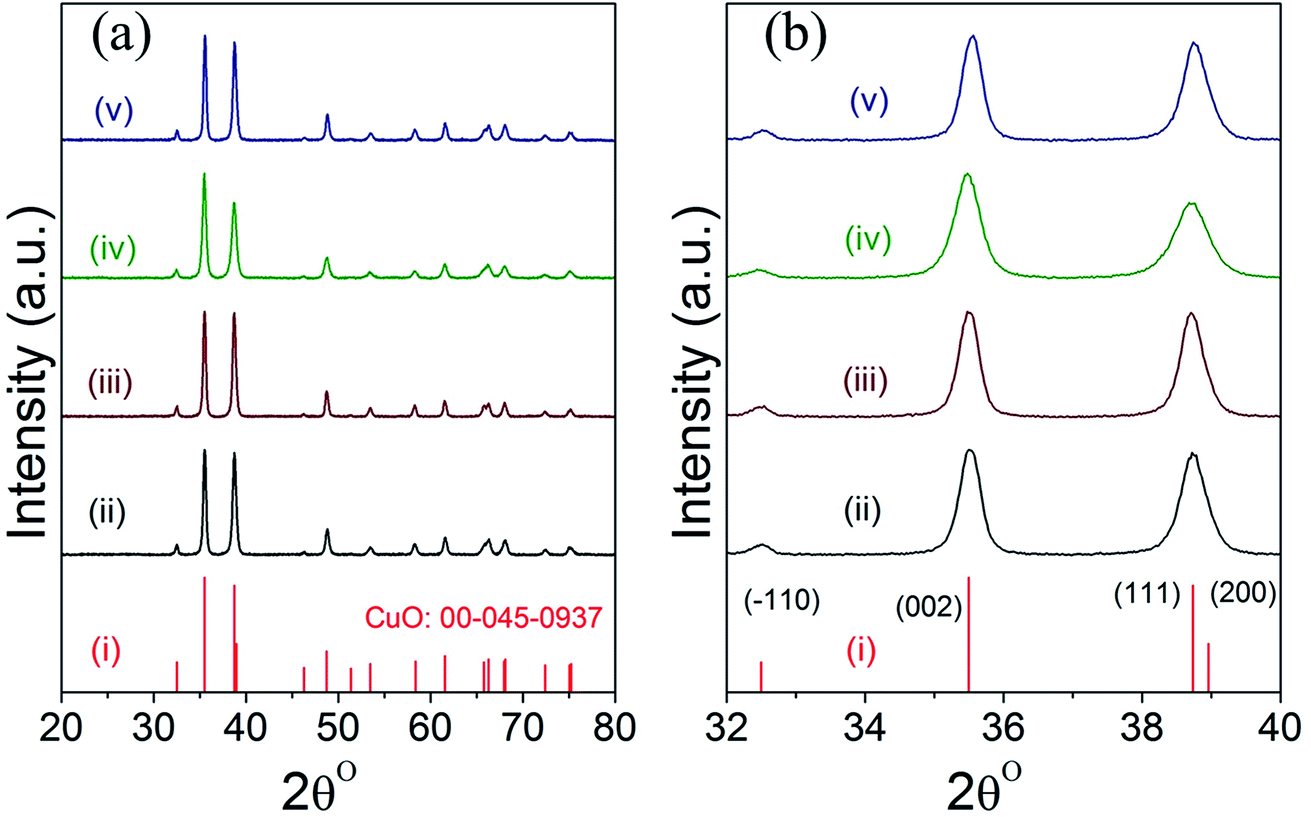 | ||
| Fig. 2 (a and b) XRD patterns of different powder CuO catalysts prepared aging for 2–72 h followed by UAHP at 90 °C for 2 h and subsequent calcination in ambient air at 400 °C for 2–4 h as compared to the reference pattern of tenorite CuO; (i) reference CuO (ii) CuO(A2 h–C2 h), (iii) CuO(A24 h–C2 h) (iv) CuO(A24 h–C4 h) and (v) CuO(A72 h–C2 h) nanoparticles. | ||
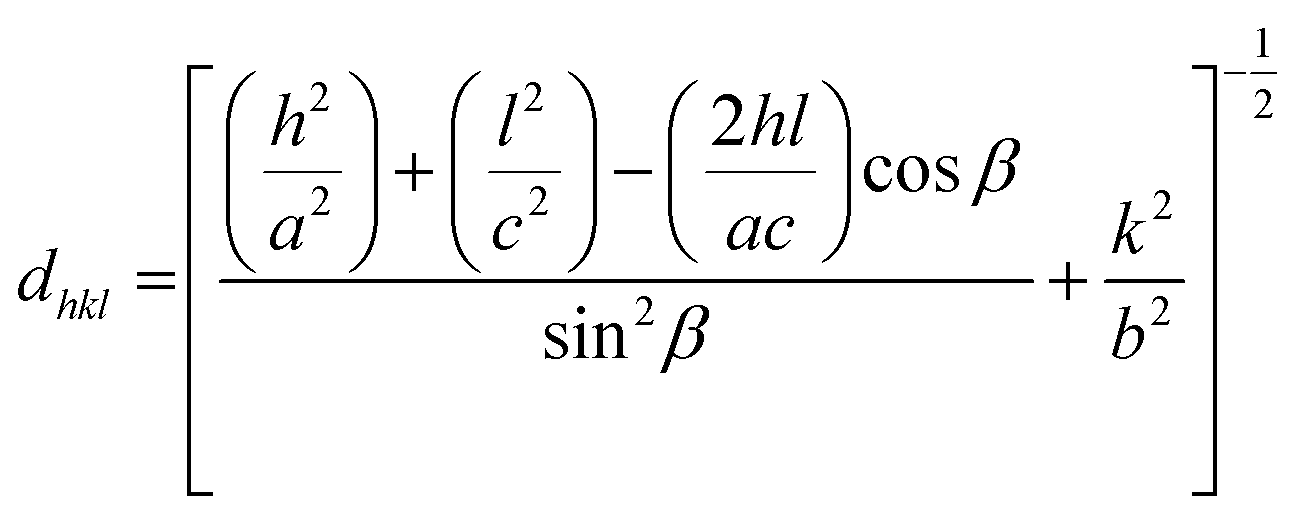
Slight shifts in the Bragg angles were noticed in {111} peaks of CuO samples indicating that the lattice parameters of the CuO are slightly changed for the different CuO samples prepared under different aging and annealing times. For the monoclinic-structured copper oxide grains, the axial translation a ≠ b ≠ c, the lattice constant α = γ = 90° and β > 90°. The interplanar d spacing of the lattice planes is related to the lattice constants by the following expression:32
The lattice constants for the different CuO samples were calculated from the powder diffraction patterns using X'pert HighScore Plus software and the a values were compared to that of the reference tenorite CuO (0.468 nm). The relative strain (s) values were estimated from the calculated lattice constant using the equation: 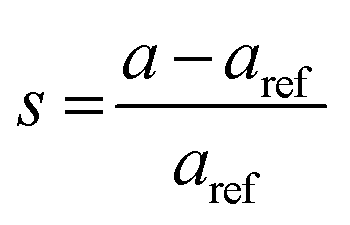 , where aref is the lattice constant value of the reference CuO. As listed in Table 2, the relative strain values are relatively small for the different CuO samples annealed for 2 h compared to the reference value and that reported the literature (0.468 nm) for tenorite CuO.33,34 The CuO(A24 h–C4 h) sample that was aged for 24 h and annealed for 4 h exhibited lattice parameters very close to the reference CuO with unstrained grains as indicated in Table 2.
| Sample | a (nm) | b (nm) | c (nm) | β (deg) | Strain (s) |
|---|---|---|---|---|---|
| CuO(A2 h–C2 h) | 0.486 | 0.351 | 0.508 | 99.42 | 0.038 |
| CuO(A24 h–C2 h) | 0.483 | 0.340 | 0.521 | 99.18 | 0.032 |
| CuO(A24 h–C4 h) | 0.468 | 0.341 | 0.509 | 99.39 | 0.00 |
| CuO(A72 h–C2 h) | 0.478 | 0.328 | 0.506 | 99.54 | 0.021 |
The thermal gravimetric (TGA) plot of CuO(A24 h–C4 h) is shown in Fig. 3. As can be seen from the graph, the CuO catalyst possessed a weight loss of ∼1% upon heating to 600 °C, compared to only ∼0.6% weight loss at temperature of 300 °C. The weight loss at temperatures lower than 300 °C could be attributed to the dehydration of the water molecules adsorbed on the CuO surface as well as the desorption of the surface hydroxyl (–OH) groups.35 The high thermal stability of the CuO nanoparticles indicated by the insignificant weight loss suggests its tolerance not only to the medium temperatures window of CO oxidation reaction (50–300 °C) but also to the extreme heating conditions up to 700 °C.
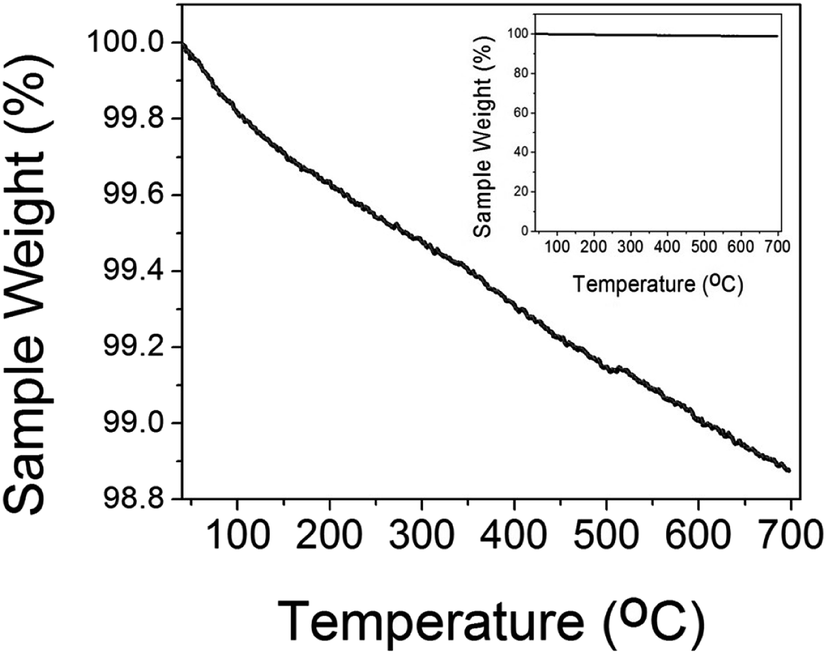 | ||
| Fig. 3 TGA data of different CuO(A24 h–C4 h) nanoparticles prepared by aging for 24 h followed by the urea-assisted homogenous precipitation at 90 °C for 2 h and subsequent calcination in ambient air at 400 °C for 4 h. The inset is the full scale TGA plot. | ||
3.3. Surface properties
Fig. 4a and b displays the multipoint BET nitrogen gas adsorption–desorption isotherm and corresponding pore size distribution for CuO(A24 h–C4 h) nanoparticles. The CuO(A24 h–C4 h) powder catalyst exhibits a nearly type IV nitrogen isotherm with a hysteresis loop in the range of 0.6–1.0 relative pressure, characteristic of mesoporous structured CuO nanomaterials.36,37 Even though the plateau is not so well defined leading to an upswing at relatively high pressure, this could be due to the presence of wider mesopores and narrow macropores. The pore size distribution (PSD) taken from the quantity desorbed shows a slightly wide distribution with a peak at a diameter of about 13–15 nm and a tail after 50 nm. This pore width distribution indicates the presence of meso-/macropores with the mesopores being more pronounced. Moreover, the sample has irregular porosity as revealed from the SEM image shown in Fig. 1f and this could lead to slight deviation from the type IV isotherm typical of pure mesoporous materials where the model assumes a cylindrical ordered porosity.38 Overall, the irregular spherical mixed meso-/macropores could give rise to an isotherm of an intermediate character with low adsorption values until relative pressure of 0.8.39,40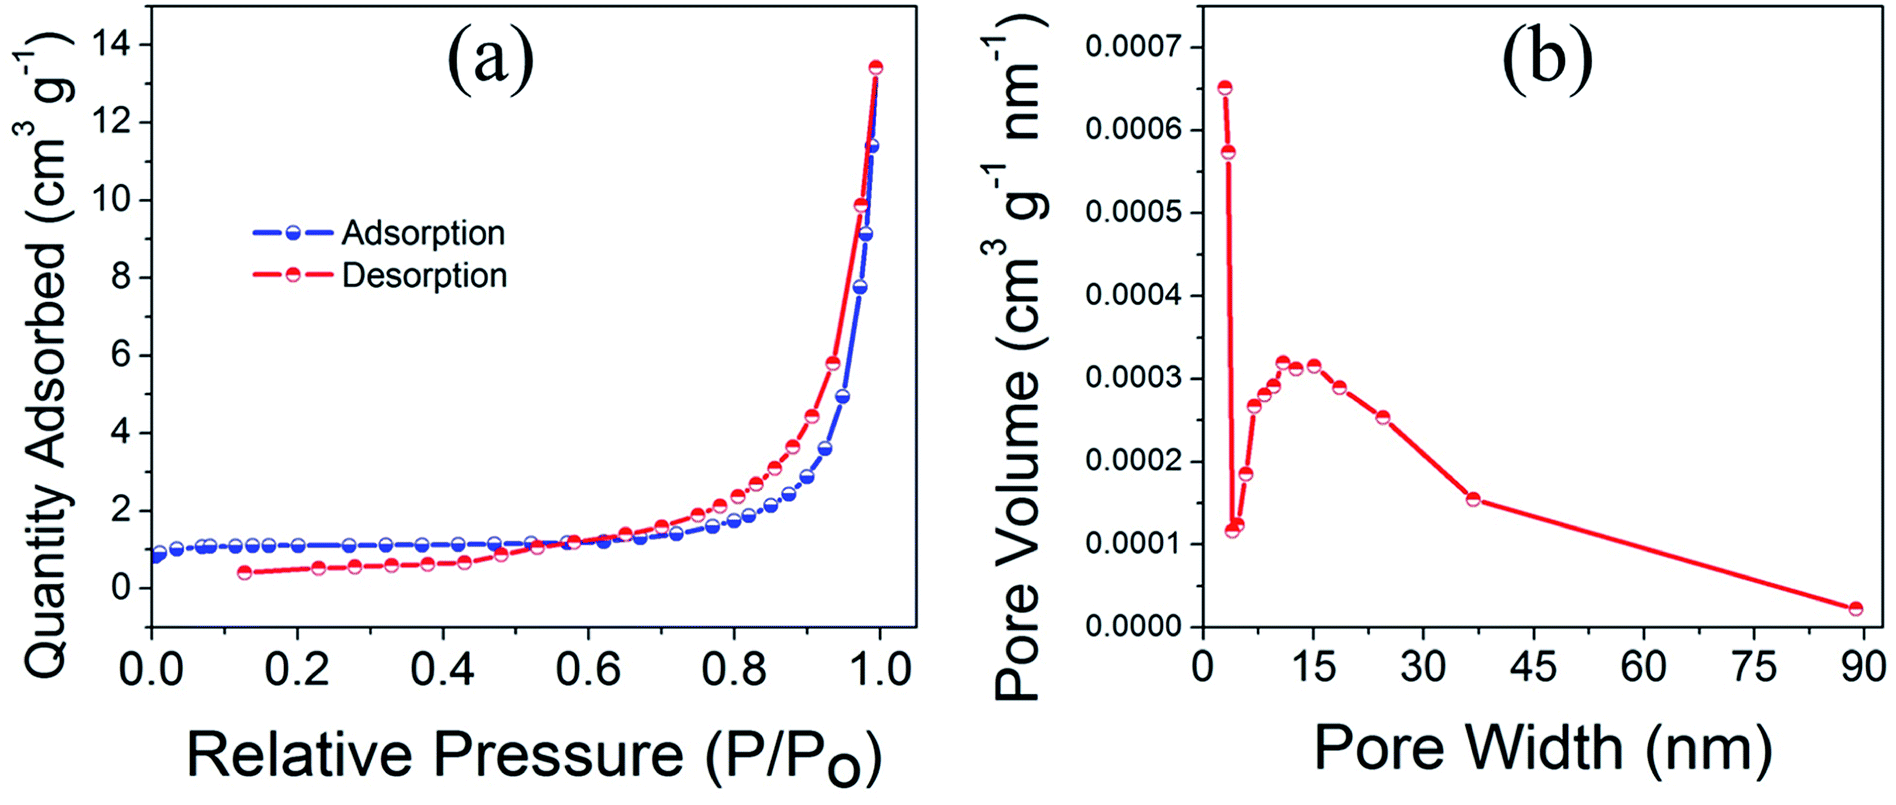 | ||
| Fig. 4 (a) Multipoint BET nitrogen adsorption–desorption isotherm and (b) corresponding pore size distribution of CuO(A24 h–C4 h) nanoparticles prepared by aging for 24 h followed by the urea-assisted homogenous precipitation at 90 °C for 2 h and subsequent calcination in ambient air at 400 °C for 4 h. | ||
The specific surface area determined using BET (Brunauer, Emmett and Teller) method is 4.3 m2 g−1 and the estimated average pore diameter is ∼19 nm. The surface area of 4.3 m2 g−1 obtained for the CuO(A24 h–C4 h) powder catalyst is similar to the value reported in the literature for CuO micro-balls (4.8 m2 g−1).41 Similarly, the average pore size (19 nm) aligns well with the pore size range reported earlier for CuO nanoparticles.12
3.4. Valence states
X-ray photoelectron spectroscopy (XPS) measurements were acquired to investigate the chemical environment and electronic structure of Cu and O in the different CuO nanoparticles. The HR-XPS scan for Cu 2p and O 1s were acquired from 927 to 970 eV and from 525 to 540 eV, respectively. The binding energy values can be used to derive information on the chemical and electronic structure state of Cu cations and O2 anions in CuO.42,43 Fig. 5 displays the high-resolution XPS spectra of Cu 2p and O 1s of CuO(A2 h–C2 h), CuO(A24 h–C2 h), CuO(A24 h–C4 h) and CuO(A72 h–C2 h) nanoparticles prepared by the UAHP at 90 °C for 2 h.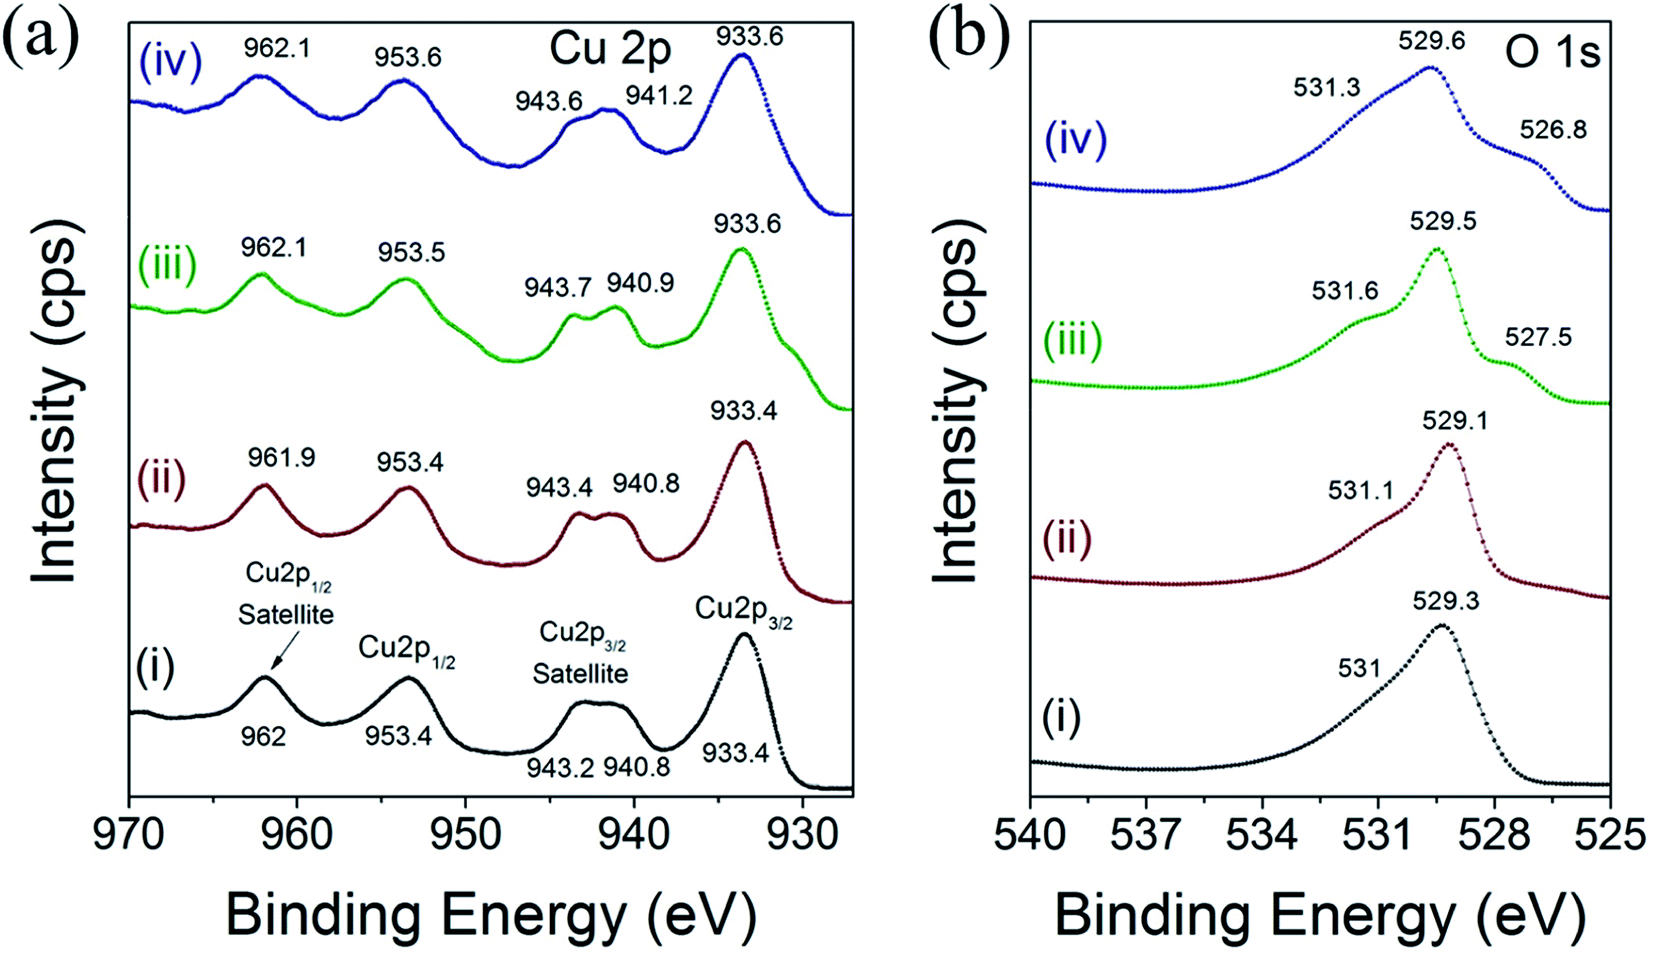 | ||
| Fig. 5 XPS spectra of high-resolution scan for (a) Cu 2p and (b) O 1s of (i) CuO(A2 h–C2 h), (ii) CuO(A24 h–C2 h) (iii) CuO(A24 h–C4 h) and (iv) CuO(A72 h–C2 h) nanoparticles prepared by aging the reaction mixture for 2–72 h followed by UAHP at 90 °C for 2 h and subsequent calcination in ambient air at 400 °C for 2–4 h. | ||
As shown in Fig. 5a, the Cu 2p XPS results indicate that the binding energies of the Cu 2p in the different CuO nanoparticles are similar and overall align well with values reported in the literature.42 The peaks centered at 933.4–933.6 eV and 953.4–953.6 eV corresponds to the Cu 2p3/2 and Cu 2p1/2, respectively. These two peaks together with the shake-up peaks present at about 938–945 eV are main XPS features of CuO, indicating the presence of Cu2+ in all samples.43 The binding energies of the Cu 2p XPS peaks are slightly higher for CuO(A24 h–C4 h) and CuO(A72 h–C2 h) compared to those of CuO(A2 h–C2 h) and CuO(A24 h–C2 h) nanoparticles, as shown in Fig. 5a. The Cu 2p3/2 peak slightly shifts from 933.4 eV for CuO(A2 h–C2 h) and CuO(A24 h–C2 h) to 933.6 eV for CuO(A24 h–C4 h) and CuO(A72 h–C2 h), corresponding to a shift of 0.2 eV to higher binding energy. This up-shift of the Cu 2p3/2 peaks is accompanied with another 0.1 and 0.2 eV up-shift of the Cu 2p1/2 peak for CuO(A24 h–C4 h) and CuO(A72 h–C2 h), respectively. The up-shift of both Cu 2p3/2 and Cu 2p1/2 peaks to higher binding energy is meaningful of slightly distinguished chemical speciation and suggests the slight change of the electronic structure of CuO(A24 h–C4 h) and CuO(A72 h–C2 h).
Fig. 5b shows the high resolution XPS spectra of O 1s for different CuO nanoparticles. For all samples, a pronounced peak at ∼529 eV is observed in the O 1s region and is ascribed to the lattice oxygen of CuO (O2− anions that are bonding to the Cu2+ cations in the Cu–O bond.44 For CuO(A24 h–C4 h) and CuO(A72 h–C2 h) nanoparticles, the O 1s peak broadens and slightly shifts to higher binding energy at ∼529.6 eV. Additionally, a weak peak is observed at around 531 eV, which can be attributed to the adsorbed oxygen anions in the hydroxyl (–OH) groups present on the surface.41
3.5. Vibrational properties
We have performed Raman scattering and FTIR analysis to reveal the electronic structure and confirm the structural phase of the prepared CuO nanoparticles. The tenorite phase CuO has monoclinic symmetry and belongs to the space group C2/c with four Cu–O molecules in each unit cell and two Cu–O chemical formula units (four atoms) in the primitive cell. Accordingly, CuO has three acoustic modes and nine optical modes, amongst them three are active Raman modes and the remaining six are infrared active modes. The three Raman active modes of tenorite CuO, namely (Ag +2Bg) are associated with the Cu–O stretching and bending vibration and the six infrared active modes, identified as (3Au + 3Bu) are associated with motion of both the Cu and the O atoms.45,46 Fig. 6a and b shows the Raman and FTIR spectra of the CuO(A24 h–C4 h) nanoparticles. The Raman spectrum (Fig. 6a) is featured with two characteristic peaks at 294 cm−1 (Ag) and 600 cm−1 (Bg) which confirms the tenorite phase CuO and agrees well with the literature.45 The FTIR spectrum of the CuO(A24 h–C4 h) nanoparticles (Fig. 6b) features two prominent peaks positioned at ∼428 cm−1 and ∼525 cm−1 which can be assigned to the Au and the Bu modes of tenorite phase CuO, respectively.46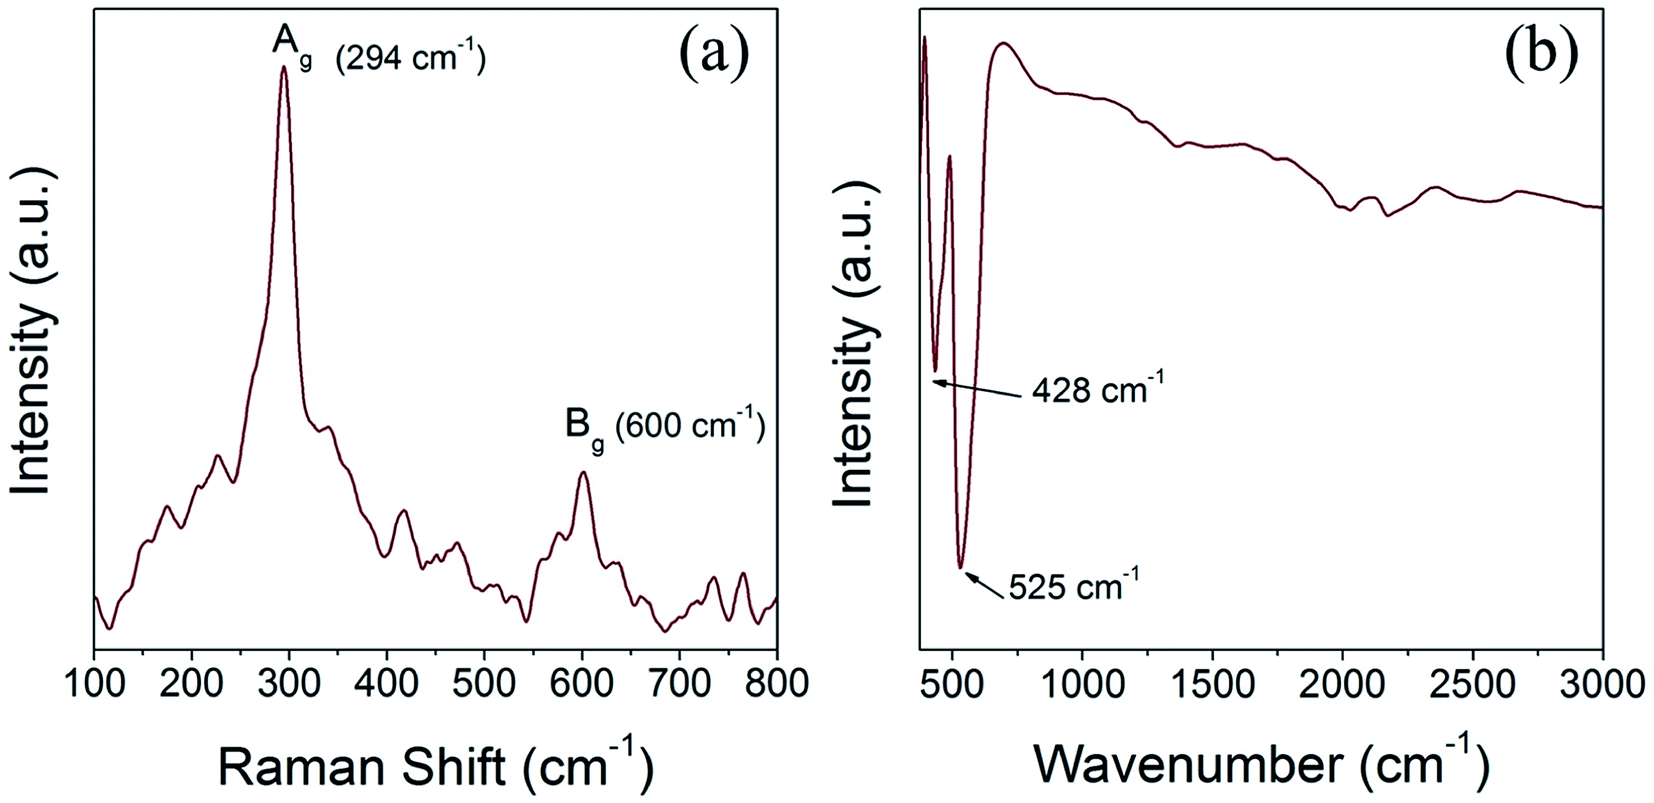 | ||
| Fig. 6 (a) Raman spectrum and (b) FTIR spectrum of CuO(A24 h–C4 h) nanoparticles prepared by aging for 24 h followed by the urea-assisted homogenous precipitation at 90 °C for 2 h and subsequent calcination in ambient air at 400 °C for 4 h, showing the Raman and IR peaks characteristics to CuO tenorite lattice vibrations. | ||
3.6. Reducibility with CO
The reducibility of heterogeneous catalysts is known to strongly correlate with their catalytic performance, particularly in gas–solid reactions.47–51 We have thus investigated the reduction behaviors of the prepared CuO catalysts to evaluate their reducibility in CO atmosphere. Fig. 7 displays the CO-TPR profiles of CuO(A24 h–Ch), CuO(A24 h–C2 h) and CuO(A72 h–C2 h) compared to that of reference CuO sample. Comparing the reduction behavior of these CuO catalysts indicate that their reducibility in CO follows the order CuO(A24 h–C4 h) > CuO(A24 h–C2 h) > CuO(A72 h–C2 h) > reference CuO sample. The reduction temperature of CuO(A72 h–C2 h) is much lower than that of reference CuO sample, where the CuO(A72 h–C2 h) catalyst possessed a slight reduction peak at 207 °C and a main reduction peak at 241 °C compared to a single reduction peak at 284 °C for the reference CuO sample. The lowered reduction temperature indicates the promoting effect of size reduction and the existence of readily accessible active sites on the surface of the CuO(A72 h–C2 h) nanoparticles prepared by the UAHP. Moreover, a further decrease in the reduction temperature is observed for the CuO(A24 h–C2 h) and CuO(A24 h–C4 h) with the lowest reduction temperature demonstrated by CuO(A24 h–C4 h) catalyst. The CuO(A24 h–C4 h) catalyst exhibited two reduction peaks positioned at 126 °C and 139 °C compared to 123 °C and 146 °C for those of the CuO(A24 h–C2 h) catalyst. The significant 55% decrease of the main reduction temperature from 284 °C for reference CuO to 126 °C for CuO(A24 h–C4 h) prepared by the UAHP, clearly reveals the impact of the rational control of the processing parameters on tuning the reducibility of the CuO nanoparticles and thus promoting their catalytic performance.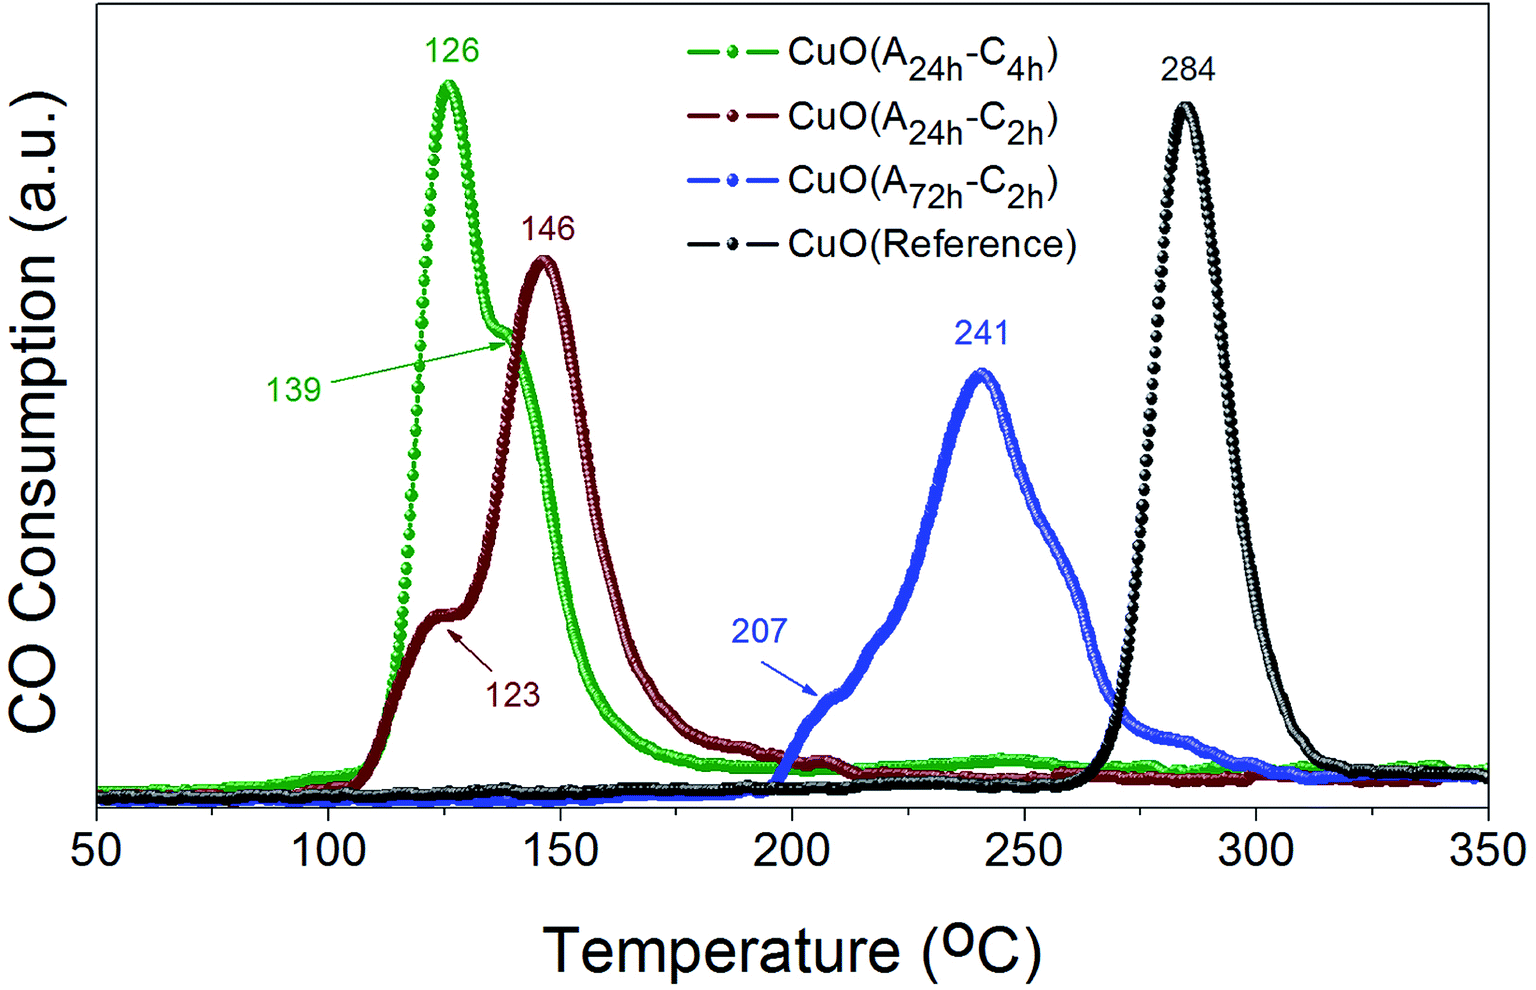 | ||
| Fig. 7 CO-TPR profiles of CuO(A24 h–Ch), CuO(A24 h–C2 h) and CuO(A72 h–C2 h) prepared by aging the reaction mixture for 24 or 72 h followed by UAHP at 90 °C for 2 h and subsequent calcination in ambient air at 400 °C for 2–4 h compared to that of reference CuO sample. The measurements were performed using 50 mg of the powder catalyst and 10% CO/He balance at a flow rate of 50 cm3 min−1. The numbers on the peaks indicate the corresponding reduction temperature (in °C). | ||
The two reduction peaks observed at low temperature in case of UAHP-prepared CuO catalysts can be attributed to the reduction of the small-sized CuO entities finely dispersed on the surface in the form of Cu2+ → Cu+ and finally Cu+ → Cu0. On the other hand, the single reduction peak at a higher temperature in case of reference CuO can be ascribed to the reduction of the larger-sized CuO entities of the bulk catalyst. The results overall demonstrate that the reaction between CuO(A24 h–C4 h) or CuO(A24 h–C2 h) and CO occurs at lower temperature than between CuO(A72 h–C2 h) and CO and therefore, the enhanced CO oxidation reaction rate over CuO(A24 h–C4 h) and CuO(A24 h–C2 h) relative to that of CuO(A72 h–C2 h) can be inferred. The differences in the reduction behaviors between CuO(A24 h–C4 h) or CuO(A24 h–C2 h) and CuO(A72 h–C2 h) reasonably arise from the different levels of surface reactivity of the CuO nanoparticles caused by the different concentrations of surface active sites.
The largely lowered reduction temperature of CuO(A24 h–C4 h) in CO atmosphere clearly demonstrates the effect of active oxygen moieties on the surface which can serve as readily-available reducible species facilitating chemisorption and activation of CO molecules which results in lower-temperature reduction at the CuO surface. When comparing the reduction behaviors of CuO(A24 h–C4 h) and CuO(A24 h–C2 h), it is clearly seen that CuO(A24 h–C2 h) is slightly more difficult to reduce in CO than CuO(A24 h–C4 h). Therefore, the promoting effect of active oxygen moieties on the surface reactivity of the CuO nanoparticles depends not only on the aging time or size effects but also on the calcination time where longer calcination time could result in more oxygenated nanoparticle surface. The nature of the active oxygen moieties present on the metal oxide surface determines its surface reactivity and reducibility which in turn determines the catalytic activity.49 Therefore, the fine tuning of the reducibility of CuO nanoparticles by the rational control of the pre- and post-synthesis parameters could be a feasible tool to promote heterogeneous catalytic reactions catalyzed by CuO catalysts with a particular emphasize on the CO oxidation reaction.
3.7. Catalytic activity, stability and kinetics
The catalytic activity of the different CuO catalysts was evaluated in CO oxidation using a customized continuous flow fixed-bed catalytic reactor as described in the experimental section. Fig. 8a compares the catalytic activities of the different CuO catalysts that were prepared by the UAHP under different pre- and post-synthesis processing parameters as described in the experimental section. It is generally accepted that the catalytic activity is strongly sensitive to the size, shape and surface composition of the nanoparticles which in turn depend on the pre- and post-synthesis treatments.52 As can be seen in Fig. 8a, the CuO(A0 h–C2 h) nanoparticles prepared without aging the solution prior to urea hydrolysis revealed an appreciable activity only at temperature higher than 150 °C where the CO oxidation light-off curve reveals T80 = 255 °C and T100 = 412 °C (T80 and T100 are the temperatures corresponding to 80% and 100% CO conversion, respectively). For the CuO(A2 h–C2 h) that was prepared by aging the solution for 2 h prior to the urea hydrolysis, the CO conversion rate is enhanced with a decrease of the associated T80 and T100 to 137 °C and 303 °C, respectively (Table 3). A further aging of the solution for 24 h prior to the urea hydrolysis resulted in further decrease of the T80 (T100) to 110 °C (141 °C) and 103 °C (125 °C) for CuO(A24 h–C2 h) and CuO(A24 h–C4 h), respectively. When the solution aging time was increased to 72 h for CuO(A72 h–C2 h), the CO conversion rate was decreased and the T80 and T100 were increased to 136 °C and 166 °C, respectively. The promoted catalytic activity for CuO(A24 h–C2 h) and CuO(A24 h–C4 h), compared to CuO(A72 h–C2 h) correlates very well with the reduction behaviors of these samples and stems from the improved reducibility caused by readily available reducible-species at the surface, as explained from CO-TPR results shown in Fig. 7. The comparison of the T80 and T100 for CuO(A24 h–C1 h), CuO(A24 h–C2 h) and CuO(A24 h–C4 h) that were prepared by aging the solution for 24 h prior to urea hydrolysis and calcined for 1 h, 2 h and 4 h, respectively, indicate that increasing the calcination time from 1 h to 2 h resulted in enhanced CO conversion rates and a significant decrease of the T100 from 240 °C for CuO(A24 h–C1 h) to 141 °C for CuO(A24 h–C2 h) is observed. A further increase of the calcination time to 4 h slightly improved the catalytic performance and the T100 decreased from 141 °C for CuO(A24 h–C2 h) to 125 °C for CuO(A24 h–C4 h). These results demonstrate that the catalytic activity can be tuned by rational design of the post-synthesis treatment of the catalysts. Overall, the CO oxidation light-off curves, shown in Fig. 8a, indicate that the CuO(A24 h–C4 h) catalyst possessed the highest catalytic activity for CO oxidation with T100 = 125 °C. This was performed under a weight-hourly space velocity (WHSV) of 72000 cm3 g−1 h−1 indicating that large CO volumes could be converted per unit weight of the catalyst at small residing times.
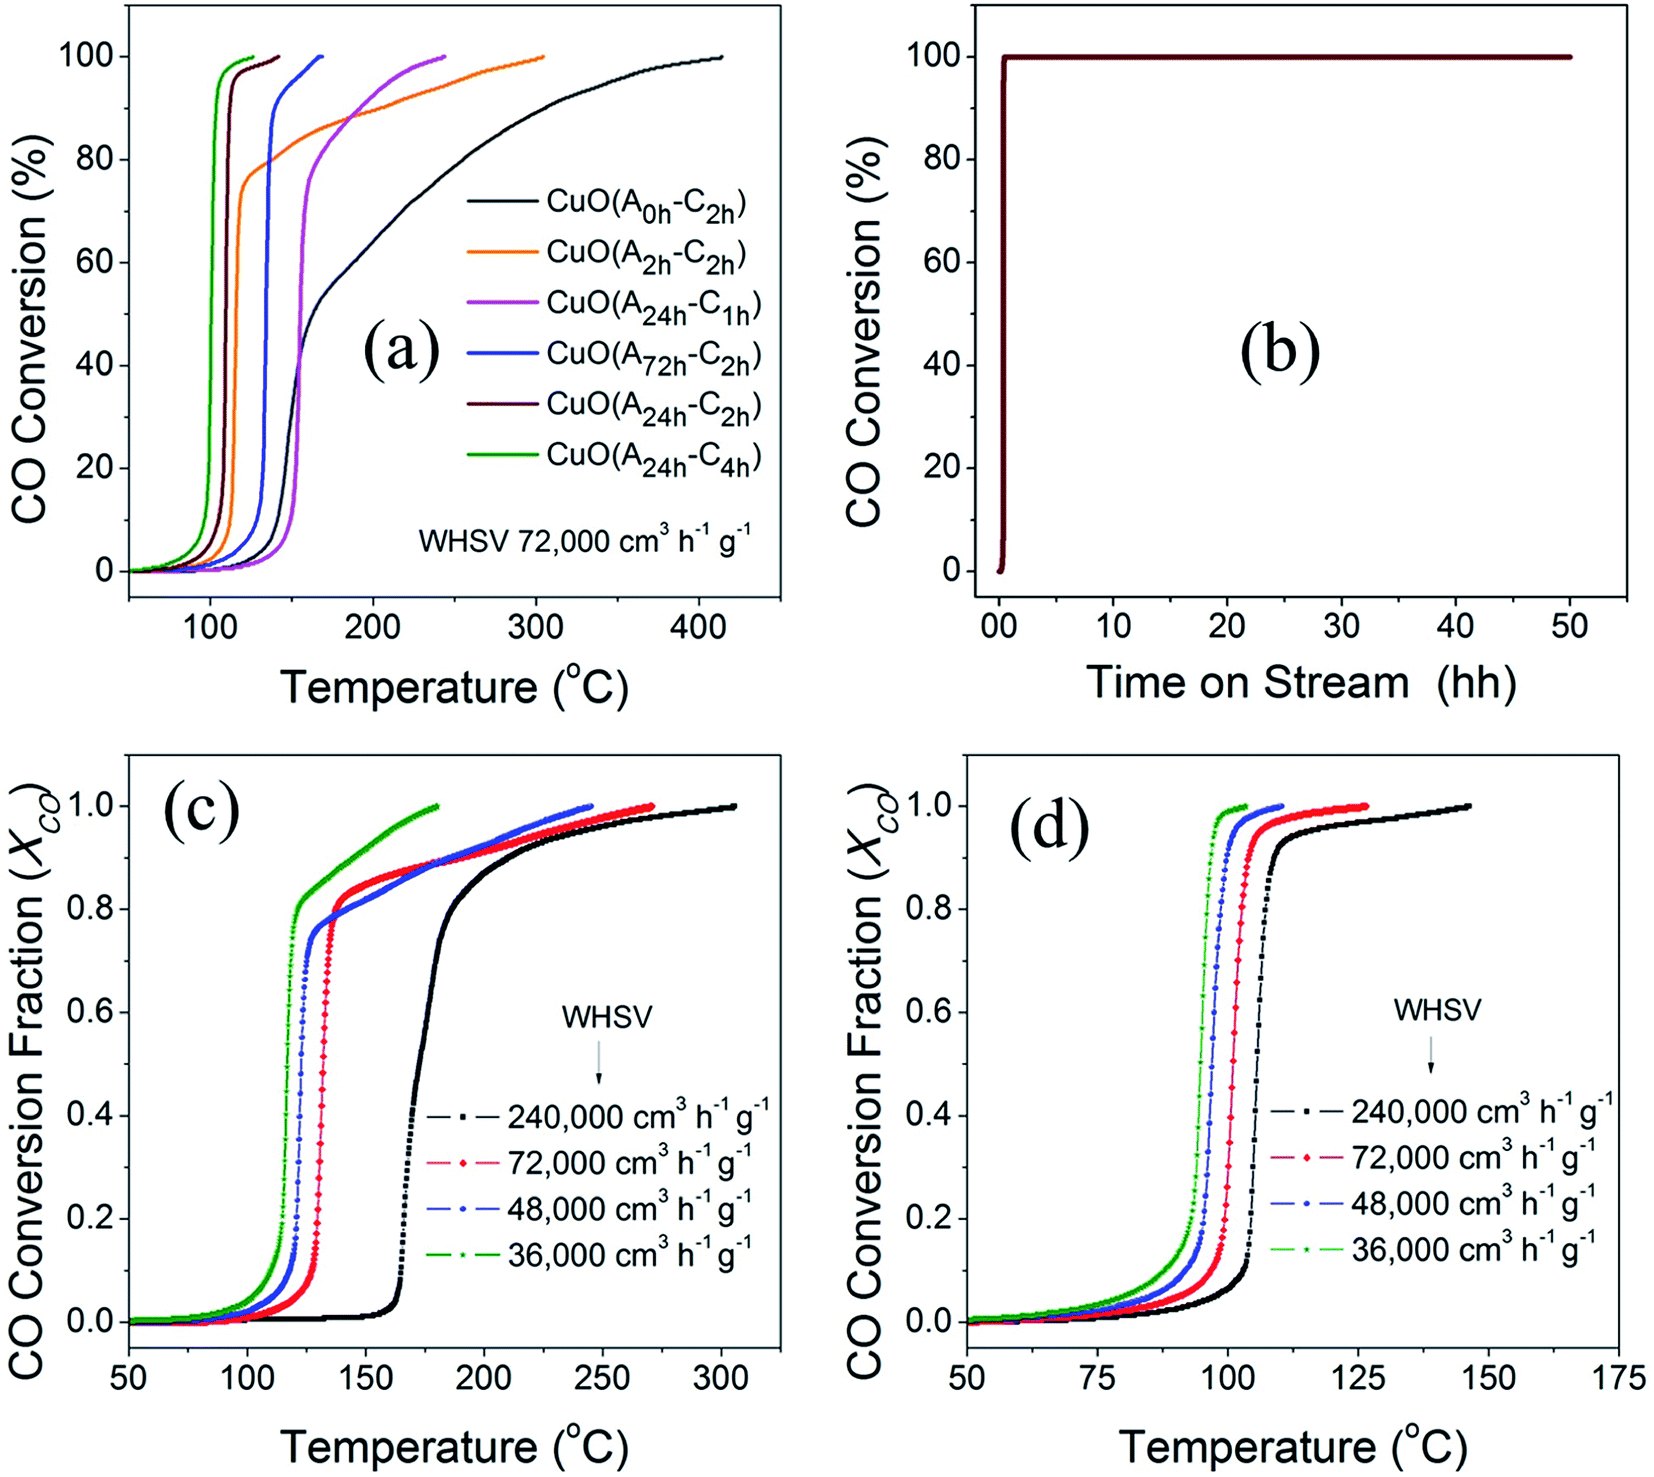 | ||
| Fig. 8 (a) CO oxidation light-off curves of different CuO catalysts prepared by UAHP at 90 °C for 2 h under different aging times of 0, 2, 24 and 72 h and calcination time of 2–4 h in ambient air at 400 °C. The feed mixture consisted of 4% CO, 20% O2 and balance He and was passed over the catalyst bed (50 mg) at a flow rate of 60 cm3 min−1 (72000 cm3 g−1 h−1 WHSV), (b) CO oxidation long–term stability of CuO(A24 h–C4 h) catalyst under continuous stream for 48 h at ∼150 ± 5 °C and (c and d) CO oxidation light-off curves of (c) CuO(A2 h–C2 h) and (d) CuO(A24 h–C4 h) catalysts showing the effect of changing the residing time on the CO conversion. | ||
| Catalysts | T50 | T80 | T100 | CO conversion at 125 °C (μmol s−1 g−1) | Ea (kJ mol −1) |
|---|---|---|---|---|---|
| CuO(A0 h–C2 h) | 162 | 255 | 412 | 0.96 | |
| CuO(A2 h–C2 h) | 116 | 137 | 303 | 27.4 | 90.2 ± 6.4 |
| CuO(A24 h–C2 h) | 109 | 110 | 141 | 34.9 | |
| CuO(A24 h–C1 h) | 155 | 166 | 240 | 0.64 | |
| CuO(A24 h–C4 h) | 100 | 103 | 125 | 35.6 | 75.7 ± 4.9 |
| CuO(A72 h–C2 h) | 135 | 136 | 166 | 2.64 |
The enhanced CO conversion rate at lower temperatures and smaller residing times can be attributed to the existence of readily-reducible oxygen moieties at the surface of the nanoparticles as revealed from the CO-TPR results. A correlation between the 100% CO conversion temperatures (T100) and the reducibility of CuO catalysts can be clearly established from the combined results of the CO-TPR behaviors and the catalytic activity measurements. This suggests that surface oxygen is an important parameter determining the rate of reaction and that the increased reducibility of CuO nanoparticles can increase the surface reactivity and CO activation and thus lead to lower CO conversion temperatures and promoted catalytic activity.53 The strong surface reactivity arising from the active oxygen moieties present on the CuO surface was evidenced from XPS and CO-TPR results, as explained earlier. Another contribution to the differences observed in surface reactivity and CO oxidation rates could arise from the different shapes and microstructures of the CuO nanoparticles and hence their exposed surface as explained in Fig. 1a–f. Compared to precious metal-based catalysts, these CuO catalysts with tuned reducibility exhibit high catalytic activity for CO oxidation and lower conversion temperatures and can be produced at lower cost of synthesis and processing. Our CuO catalysts demonstrated complete CO conversion at a temperature lower than that of CuO-supported Au catalysts54 and those of Pd catalysts supported on a CeO2–TiO2 mixed oxide55 and on ZrO2.56 Interestingly, our catalyst exhibits higher catalytic activity than pure CuO catalyst reported by Zhu et al. and the activity of our catalysts is comparable to the copper-ceria catalyst reported therein.57 In addition, our catalysts are competitive to some other catalysts composed of precious metals such as Pd and Pt. For example, they are more active for CO conversation at temperature lower than that reported very recently for graphene-supported Pd–Pt alloy nanoparticles providing the relatively lower cost of copper oxide and the simple synthesis approach.58 The great merit of the non-precious CuO catalyst with T100 = 125 °C is clearly notable given the better CO oxidation activity, lower cost, and the long-term thermal stability.
The long-term stability of the CuO(A24 h–C4 h) catalyst for CO oxidation was evaluated for more than 48 h in a continuous stream. The feed gas mixture was passed over the catalyst and the catalyst temperature was ramped to 150 °C and kept at this temperature during the stability test. As can be seen in Fig. 8b and a simultaneous CO oxidation is achieved and the 100% conversion remains constant for 48 h in continues feed gas stream indicating that it was not subject to deactivation and can maintain stable performance for CO oxidation. The CuO catalysts of tuned reducibility could be used as efficient, durable, and non-precious catalysts for CO oxidation at low temperature.
To study the effect of the residing time on the catalytic activity of the CuO catalysts, we evaluated the performance of two selected catalysts for CO oxidation under other three weight hourly space velocities (WHSV) of 36000 cm3 h−1 g−1, 48000 cm3 h−1 g−1 and 240,000 cm3 h−1 g−1, in addition to 72000 cm3 h−1 g−1. The light-off curves of CuO(A2 h–C2 h) and CuO(A24 h–C4 h) of CO oxidation measured under the four different weight hourly space velocities (WHSV) are displayed in Fig. 8c and d. Overall, when the WHSV for CO oxidation over the CuO(A2 h–C2 h) and CuO(A24 h–C4 h) was decreased from 72000 cm3 h−1 g−1 to 48000 cm3 h−1 g−1 and finally to 36000 cm3 h−1 g−1, the CO conversion rates were increased and the light-off curves shift to lower temperature. The 50% reduction of the WHSV from 72000 cm3 h−1 g−1 to 36000 cm3 h−1 g−1 resulted in lowering the T80 from 137 °C to 121 °C and from 103 °C to 95 °C for CuO(A2 h–C2 h) and CuO(A24 h–C4 h), receptively. The lowered temperatures and the enhanced CO conversion can be ascribed to the presence of larger density of adsorption sites from the increased catalyst loading. On the other hand, when the WHSV was increased by factor of 3.3 from 72000 cm3 h−1 g−1 to 240000 cm3 h−1 g−1, the T80 was increased largely from 137 °C to 186 °C and slightly from 109 °C to 107 °C for CuO(A2 h–C2 h) and CuO(A24 h–C4 h), respectively. Unlike CuO(A2 h–C2 h) catalyst whose catalytic performance was greatly affected by increasing the WHSV, the CuO(A24 h–C4 h) catalyst maintained its catalytic performance and possessed very similar catalytic CO conversion behavior even under higher molar flow of CO gas.
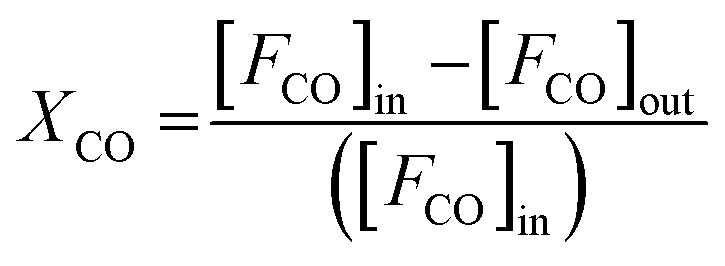
To further reveal the effect of synthesis parameters on the activation energy, kinetic measurements were carried out on CuO(A2 h–C2 h) and CuO(A24 h–C4 h) catalysts. To collect kinetic data in each case, CO oxidation experiments were carried out by varying the temperature and the catalyst loadings as 15, 50, 75, and 100 mg, while keeping the catalyst-bed length, molar flow and the gas hourly space velocity (GHSV) of the feed gas fixed (3600 cm3 h−1). The fractional CO conversion was calculated from the CO molar flow at the inlet [FCO]in and at the outlet [FCO]out using the formula:
 | (1) |
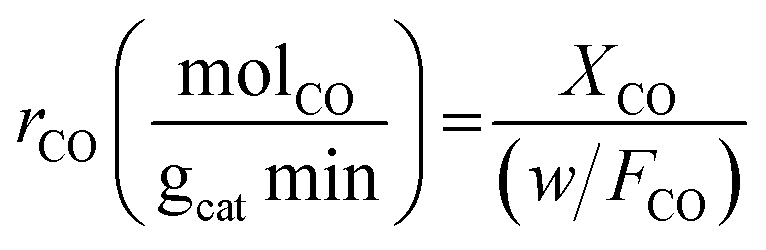
Experiments were performed under oxygen-rich conditions and at atmospheric pressure. Kinetic data were collected at steady state and in a differential regime maintaining CO conversion < 0.2. Thus, the CO oxidation reaction rates (in mol g−1 s−1) were calculated using the formula:
 | (2) |
Fig. 9 compares the variation of the CO fractional conversion (XCO) with w/FCO ratio (Fig. 9a and b) and Arrhenius plots (Fig. 9c and d) for the CuO(A2 h–C2 h) and CuO(A24 h–C4 h) catalysts. Plots in Fig. 9a and b reveal that at fixed w/FCO ratio, the CO conversion percentage increases linearly with increasing the temperature indicating that CO oxidation reaction is promoted at elevated temperatures. The promoted CO oxidation can be ascribed to the activation of oxygen moieties adsorbed on the CuO surface and their subsequent enhanced diffusion leading to enhanced CO oxidation rates. This behavior aligns well with the results from the CO-TPR measurements, which indicates the existence of surface oxygen moieties that are reducible at low temperature. The dependence of the CO conversion on the residing time in the term of w/FCO, (w = catalyst weight (g) and FCO = molar flow rate (μmol s−1)) is also presented in Fig. 9a and b. At a given temperature and a fixed gas hourly space velocity (GHSV = 3600 h−1), the CO fractional conversion increases with increasing the residing time from 0.028 to 0.056 g s μmol−1. A minimal CO fractional conversion is observed at the small residing time of 0.028 g s μmol−1, because of the smaller catalyst weight and the higher molar flow rate. This could arise from the smaller number of adsorption active sites and therefore minimal CO oxidation is possessed. When the residing time is increased to 0.042 and 0.056 g s μmol−1 by increasing the catalyst weight, larger density of active sites was available and thus increasing the CO conversion. The CO oxidation reaction features a broad range of kinetic situations with reaction rates of negative- or positive-order and a wide range of activation energy values.60 For unsupported CuO catalysts, the CO oxidation reaction over CuO catalysts is assumed to follow the Langmuir–Hinshelwood (L–H) mechanism where CO molecules and O atoms are adsorbed and react at the CuO surface.5,11
| CO(g) + Cu(surf) → CO − Cu(surf) | (3) |
| O2(g) + Cu(surf) − Cu(surf) → 2O − Cu(surf) | (4) |
| CO − Cu(surf) + O − Cu(surf) → CO2(g) + Cu(surf) − Cu(surf) | (5) |
 | ||
| Fig. 9 (a and b) The variation of the CO fractional conversion (XCO) with w/FCO ratio obtained from CO oxidation experiments using different catalyst loadings at fixed molar flow with feed gas hourly space velocity (GHSV) of 3600 cm3 h−1 and (c and d) Arrhenius plots obtained from the calculated reaction rate data by graphing (ln (rCO) vs. 1/T measured in the linear region of CO conversion (<0.2) for the CuO(A2 h–C2 h) (left panel) and CuO(A24 h–C4 h) (right panel) catalysts. | ||
Fig. 9c and d displays the Arrhenius plots obtained for CuO(A2 h–C2 h) and CuO(A24 h–C4 h) catalysts under differential reaction conditions, as described in the experimental section. The apparent activation energies (Ea) determined from the Arrhenius plots for the CuO(A2 h–C2 h) and CuO(A24 h–C4 h) are 90.2 ± 6.4 kJ mol−1 and 75.7 ± 4.9 kJ mol−1, respectively.
The order of the apparent activation energy is: Ea (CuO(A24 h–C4 h)) < Ea (CuO(A2 h–C2 h)) catalyst. The larger activation energy of the CuO(A2 h–C2 h) catalyst compared to CuO(A24 h–C4 h) suggests a hindered surface reaction and that its catalytic activity is lower than that of the CuO(A24 h–C4 h) catalyst, which aligns with the order of the CO oxidation reaction rates at 125 °C where the CuO(A24 h–C4 h) catalyst demonstrated the highest reaction rate of 35.6 μmol s−1 g−1 compared to 27.4 μmol s−1 g−1 catalyst (Table 3). The experimentally-determined Arrhenius parameters and activation energies represent the apparent values and the apparent activation energy for a bimolecular catalyzed reaction depends on the true surface activation energy and the heat of adsorption of the reactants.61 Therefore, the high values of the apparent activation energies might be due to the strong CO adsorption bond energy to the CuO catalyst surface.62
Based on the spectroscopic results, CO-TPR profiles and the performance of the catalysts, it can be concluded that the rational tuning of the reducibility of the CuO catalysts could influence the nature of the active species in the CuO catalysts. This led to a strong surface reactivity of CuO to CO and enhanced catalytic activity. In summary, the activity of CuO catalysts can be greatly improved by controlling the reducibility of the CuO nanoparticles which affects the reactivity of the CuO surface.
4. Conclusions
In summary, surface reducible oxygen species are of crucial importance for increased catalytic activity. In this study, a method to synthesize CuO nanoparticles with tailored reducibility and surface reactivity was developed. The physicochemical properties and the reduction behaviors of the different catalysts were systematically studied. The results revealed the promoting effect of the surface reactivity of the CuO nanoparticles on the reduction behavior and the CO oxidation rates, providing an insight to the influence of the processing parameters on the catalytic activity of CuO catalysts. The CuO(A24 h–C4 h) catalyst with enhanced reducibility demonstrated high catalytic activity for CO oxidation reaction with a complete CO conversion at 125 °C, a reaction rate of 35 μmol s−1 g−1 and an apparent activation energy of 75 kJ mol−1. In addition, the CuO catalysts demonstrated high conversion stability without catalytic activity deterioration for up to 48 h on stream. Therefore, CuO nanoparticles of tailored reducibility could be used as inexpensive, efficient and durable catalysts for CO oxidation reaction at low temperature. The understanding presented herein on the tailored reducibility and improved catalytic activity of CuO catalysts can be adopted to rationally formulate other metal oxide catalysts and tune their activity in various gas-phase oxidation reactions.Conflicts of interest
There are no conflicts of interest to declare.Acknowledgements
This work was made possible by the grant number NPRP 8-1912-1-354 from the Qatar National Research Fund (a member of Qatar Foundation). The statements made herein are solely the responsibility of the authors. The authors would like to thank Mr Mahmoud M. Tarfaya and Mr Belal S. Hussien for their assistance in the laboratory.References
- W. Deng and M. Flytzani-Stephanopoulos, Angew. Chem., Int. Ed., 2006, 45, 2285–2289 CrossRef PubMed.
- M. Shelef and R. W. McCabe, Catal. Today, 2000, 62, 35–50 CrossRef.
- G. M. Veith, A. R. Lupini, S. Rashkeev, S. J. Pennycook, D. R. Mullins, V. Schwartz, C. A. Bridges and N. J. Dudney, J. Catal., 2009, 262, 92–101 CrossRef.
- M. B. Gawande, A. Goswami, F.-X. Felpin, T. Asefa, X. Huang, R. Silva, X. Zou, R. Zboril and R. S. Varma, Chem. Rev., 2016, 116, 3722–3811 CrossRef PubMed.
- S. Royer and D. Duprez, ChemCatChem, 2011, 3, 24–65 CrossRef.
- Y. Wang, Z. H. Wen, H. L. Zhang, G. H. Cao, Q. Sun and J. L. Cao, Catalysts, 2016, 6, 214 CrossRef.
- T. Umegaki, Y. Kojima and K. Omata, Materials, 2015, 8, 7738–7744 CrossRef PubMed.
- A. Arango-Díaz, E. Moretti, A. Talon, L. Storaro, M. Lenarda, P. Núñez, J. Marrero-Jerez, J. Jiménez-Jiménez, A. Jiménez-López and E. Rodríguez-Castellón, Appl. Catal., A, 2014, 477, 54–63 CrossRef.
- C. Anil and G. Madras, J. Mol. Catal. A: Chem., 2016, 424, 106–114 CrossRef.
- G. Qiu, S. Dharmarathna, Y. Zhang, N. Opembe, H. Huang and S. L. Suib, J. Phys. Chem. C, 2012, 116, 468–477 Search PubMed.
- Y. Bu, J. W. H. Niemantsverdriet and H. O. A. Fredriksson, ACS Catal., 2016, 6, 2867–2876 CrossRef.
- A. Zedan, N. Allam and S. AlQaradawi, Catalysts, 2017, 7, 129 CrossRef.
- K. Polychronopoulou, A. F. Zedan, M. S. Katsiotis, M. A. Baker, A. A. AlKhoori, S. Y. AlQaradawi, S. J. Hinder and S. AlHassan, Mol. Catal., 2017, 428, 41–55 CrossRef.
- C. Yang, X. T. Su, J. D. Wang, X. D. Cao, S. J. Wang and L. Zhang, Sens. Actuators, B, 2013, 185, 159–165 CrossRef.
- M. Outokesh, M. Hosseinpour, S. J. Ahmadi, T. Mousavand, S. Sadjadi and W. Soltanian, Ind. Eng. Chem. Res., 2011, 50, 3540–3554 CrossRef.
- N. Wongpisutpaisan, P. Charoonsuk, N. Vittayakorn and W. Pecharapa, Energy Procedia, 2011, 9, 404–409 CrossRef.
- R. Katwal, H. Kaur, G. Sharma, M. Naushad and D. Pathania, J. Ind. Eng. Chem., 2015, 31, 173–184 CrossRef.
- J. Kim, W. Kim and K. Yong, J. Phys. Chem. C, 2012, 116, 15682–15691 Search PubMed.
- A. V. Uschakov, I. V. Karpov, A. A. Lepeshev and M. I. Petrov, Vacuum, 2016, 133, 25–30 CrossRef.
- K. Phiwdang, S. Suphankij, W. Mekprasart and W. Pecharapa, 10th Eco-Energy and Materials Science and Engineering Symposium, 2013, vol. 34, pp. 740–745 Search PubMed.
- P. Mallick, Proc. Natl. Acad. Sci., India, 2014, 84, 387–389 CrossRef.
- M. Dixit, G. N. Subbanna and P. V. Kamath, J. Mater. Chem., 1996, 6, 1429–1432 RSC.
- C. Henrist, K. Traina, C. Hubert, G. Toussaint, A. Rulmont and R. Cloots, J. Cryst. Growth, 2003, 254, 176–187 CrossRef.
- M. Abecassis-Wolfovich, H. Rotter, M. V. Landau, E. Korin, A. I. Erenburg, D. Mogilyansky and E. Gartstein, J. Non-Cryst. Solids, 2003, 318, 95–111 CrossRef.
- H. Tajizadegan, A. Heidary, O. Torabi, M.-H. Golabgir and A. Jamshidi, Int. J. Appl. Ceram. Technol., 2016, 13, 289–294 CrossRef.
- M. I. F. Macêdo, C. C. Osawa and C. A. Bertran, J. Sol-Gel Sci. Technol., 2004, 30, 135–140 CrossRef.
- A. E. Danks, S. R. Hall and Z. Schnepp, Mater. Horiz., 2016, 3, 91–112 RSC.
- P. Benito, M. Herrero, C. Barriga, F. M. Labajos and V. Rives, Inorg. Chem., 2008, 47, 5453–5463 CrossRef PubMed.
- S. Konar, H. Kalita, N. Puvvada, S. Tantubay, M. K. Mahto, S. Biswas and A. Pathak, J. Catal., 2016, 336, 11–22 CrossRef.
- J. Šubrt, V. Štengl, S. Bakardjieva and L. Szatmary, Powder Technol., 2006, 169, 33–40 CrossRef.
- V. Senthilkumar, Y. S. Kim, S. Chandrasekaran, B. Rajagopalan, E. J. Kim and J. S. Chung, RSC Adv., 2015, 5, 20545–20553 RSC.
- H. P. Klug and L. E. Alexander, X-Ray Diffraction Procedures: For Polycrystalline and Amorphous Materials, 2nd edn, 1974, p. 37 Search PubMed.
- N. A. Raship, M. Z. Sahdan, F. Adriyanto, M. F. Nurfazliana and A. S. Bakri, AIP Conference Proceedings, 2017, vol. 1788, p. 030121 Search PubMed.
- Non-Tetrahedrally Bonded Elements and Binary Compounds I, ed. O. Madelung, U. Rössler and M. Schulz, Springer Berlin Heidelberg, Berlin, Heidelberg, 1998, vol. 51, pp. 1–3, DOI:10.1007/10681727.
- I. Ganesh, P. P. Kumar, I. Annapoorna, J. M. Sumliner, M. Ramakrishna, N. Y. Hebalkar, G. Padmanabham and G. Sundararajan, Appl. Surf. Sci., 2014, 293, 229–247 CrossRef.
- H. Huang, L. Zhang, K. Wu, Q. Yu, R. Chen, H. Yang, X. Peng and Z. Ye, Nanoscale, 2012, 4, 7832–7841 RSC.
- X. Sang, J. Zhang, T. Wu, B. Zhang, X. Ma, L. Peng, B. Han, X. Kang, C. Liu and G. Yang, RSC Adv., 2015, 5, 67168–67174 RSC.
- J. Fraissard, Physical Adsorption: Experiment, Theory and Applications, Springer, Netherlands, 1 edn, 1997 Search PubMed.
- Q. Wang, Y. Zhang, J. Zheng, Y. Wang, T. Hu and C. Meng, Dalton Trans., 2017, 46, 4303–4316 RSC.
- B. G. Mahmoud, M. Khairy, F. A. Rashwan, C. W. Foster and C. E. Banks, RSC Adv., 2016, 6, 14474–14482 RSC.
- P. Subalakshmi, M. Ganesan and A. Sivashanmugam, Mater. Des., 2017, 119, 104–112 CrossRef.
- C. Deng, B. Li, L. Dong, F. Zhang, M. Fan, G. Jin, J. Gao, L. Gao, F. Zhang and X. Zhou, Phys. Chem. Chem. Phys., 2015, 17, 16092–16109 RSC.
- C. Huo, J. Ouyang and H. Yang, Sci. Rep., 2014, 4, 3682 CrossRef PubMed.
- O. Ola and M. Mercedes Maroto-Valer, Catal. Sci. Technol., 2014, 4, 1631–1637 Search PubMed.
- L. Debbichi, M. C. Marco de Lucas, J. F. Pierson and P. Krüger, J. Phys. Chem. C, 2012, 116, 10232–10237 Search PubMed.
- A. S. Ethiraj and D. J. Kang, Nanoscale Res. Lett., 2012, 7, 70 CrossRef PubMed.
- Q. Hua, K. Chen, S. Chang, H. Bao, Y. Ma, Z. Jiang and W. Huang, RSC Adv., 2011, 1, 1200–1203 RSC.
- J. Salmones, J.-A. Wang, J. A. Galicia and G. Aguilar-Rios, J. Mol. Catal. A: Chem., 2002, 184, 203–213 CrossRef.
- Y. Zeng, S. Zhang, Y. Wang, G. Liu and Q. Zhong, RSC Adv., 2017, 7, 23348–23354 RSC.
- A. R. Puigdollers, P. Schlexer, S. Tosoni and G. Pacchioni, ACS Catal., 2017, 7, 6493–6513 CrossRef.
- Y. Zhang, Y. Ji, J. L. Hezhi, L. X. Hu, Z. Zhong and F. Su, Nano Res., 2018, 11, 804–819 CrossRef.
- X. H. Zou, J. G. Xu, S. X. Qi, Z. H. Suo, L. D. An and F. Li, J. Nat. Gas Chem., 2011, 20, 41–47 CrossRef.
- S. Carrettin, Y. Hao, V. Aguilar-Guerrero, B. C. Gates, S. Trasobares, J. J. Calvino and A. Corma, Chem.–Eur. J., 2007, 13, 7771–7779 CrossRef PubMed.
- S. A. C. Carabineiro, N. Bogdanchikova, M. Avalos-Borja, A. Pestryakov, P. B. Tavares and J. L. Figueiredo, Nano Res., 2011, 4, 180–193 CrossRef.
- A. Satsuma, M. Yanagihara, K. Osaki, Y. Saeki, H. Liu, Y. Yamamoto, S. Arai and J. Ohyama, RSC Adv., 2014, 4, 54187–54193 RSC.
- A. A. Vedyagin, A. M. Volodin, R. M. Kenzhin, V. V. Chesnokov and I. V. Mishakov, Molecules, 2016, 21, 15 CrossRef PubMed.
- H. Zhu, Y. Chen, Z. Wang, W. Liu and L. Wang, RSC Adv., 2018, 8, 14888–14897 RSC.
- M. M. Devi, N. Dolai, S. Sreehala, Y. M. Jaques, R. S. K. Mishra, D. S. Galvao, C. S. Tiwary, S. Sharma and K. Biswas, Nanoscale, 2018, 10, 8840–8850 RSC.
- J. L. Ayastuy, A. Gurbani, M. P. González-Marcos and M. A. Gutiérrez-Ortiz, Ind. Eng. Chem. Res., 2009, 48, 5633–5641 CrossRef.
- F. Duprat, Chem. Eng. Sci., 2002, 57, 901–911 CrossRef.
- E. Roduner, Chem. Soc. Rev., 2014, 43, 8226–8239 RSC.
- A.-P. Jia, Y. Deng, G.-S. Hu, M.-F. Luo and J.-Q. Lu, React. Kinet., Mech. Catal., 2016, 117, 503–520 Search PubMed.
| This journal is © The Royal Society of Chemistry 2018 |