
 Open Access Article
 This Open Access Article is licensed under a Creative Commons Attribution-Non Commercial 3.0 Unported Licence
Inhibitory effects of natural organic matter on methyltriclosan photolysis kinetics†
Wei Liu‡
 a,
Lide Jin‡a,
Kai Chena,
Yanyan Lia,
Randy A. Dahlgrenab,
Meiping Maa and
Xuedong Wang*a
a,
Lide Jin‡a,
Kai Chena,
Yanyan Lia,
Randy A. Dahlgrenab,
Meiping Maa and
Xuedong Wang*a
aKey Laboratory of Watershed Sciences and Health of Zhejiang Province, Southern Zhejiang Water Research Institute, Wenzhou Medical University, Wenzhou 325035, People's Republic of China. E-mail: zjuwxd@163.com; Fax: +86-577-8669 9122; Tel: +86-577-8668 9733
bDepartment of Land, Air and Water Resources, University of California, Davis, California 95616, USA
First published on 11th June 2018
Abstract
This study evaluated the effects and related mechanisms of natural organic matter (NOM) on the photolysis of methyltriclosan (MTCS), a metabolite of triclosan. Addition of two representative NOM isolates, Pony Lake fulvic acid (PLFA-microbial origin) and Suwannee River fulvic acid (SRFA-terrestrial origin), significantly inhibited the direct photolytic rate of MTCS by ∼70%. The MTCS photolytic rate in the presence of PLFA was greater than for SRFA. NOM not only suppressed photolysis by light-shielding, but also produced ROS to oxidatively degrade MTCS and/or triplet NOM (3NOM*) to sensitize degradation. The dual effects of light-screening and photo-sensitization led to an overall decrease in photolysis of MTCS with a positive concentration-dependence. Upon addition of NOM, EPR documented the occurrence of 1O2 and ˙OH in the photolytic process, and the bimolecular k value for the reaction of 1O2 with MTCS was 1.86 × 10⁶ M−1 s−1. ROS-quenching experiments indicated that the contribution of ˙OH (19.1–29.5%) to indirect photolysis of MTCS was lower than for 1O2 (38.3–58.7%). Experiments with D2O further demonstrated that 1O2 participated in MTCS photodegradation. Moreover, the addition of sorbic acid and O2 gas to the reaction confirmed the participation of 3NOM* as a key reactant in the photochemical transformation of MTCS. This is the first comprehensive analysis of NOM effects on the indirect photolysis of MTCS, which provides new insights for understanding the environmental fate of MTCS in natural environments.
1. Introduction
Triclosan (5-chloro-2-(2,4-dichlorophenoxy)-phenol, TCS) is a common antimicrobial agent widely used in household-cleaning goods and personal care products such as shampoo, liquid soaps and toothpaste.1 Methyltriclosan (2,4-dichloro-1-(4-chloro-2-methoxyphenoxy) benzene; MTCS) is a methylated product of TCS produced by several decomposition pathways.2 Due to wide-spread use, TCS and MTCS have become ubiquitous contaminants in numerous environmental and animal matrices including human body fluids.3,4The degradation pathway of TCS and MTCS in natural environments includes biodegradation and photodegradation. Anaerobic and aerobic microbes can degrade TCS and MTCS, however, microbial degradation is a slow and inefficient process.5 Due to their low volatility and water solubility, the photolysis of TCS and MTCS is one of the most efficient degradation pathways in aquatic environments. In recent years, considerable research has focused on mechanistic studies of TCS photolysis and demonstrated that TCS can be transformed into highly carcinogenic chemicals, such as 2,8-dichlorodibenzo-p-dioxin.6 Moreover, the transformation of phenolic compounds into methlyation derivatives may render its lipophilic and more bioaccumulative than the parent compound itself.7,8 For example, it was reported that MTCS is more persistent, lipophilic, bio-accumulative and less sensitive towards photo-degradation in the environment than MTCS.9–11 In spite of the recent research on TCS degradation, there is a paucity of research concerning mechanistic pathways for MTCS photolysis. Therefore, additional studies are necessary to elucidate MTCS photolysis pathways and the associated environmental risks.
This study investigated the fate of MTCS in response to irradiation with simulated sunlight and focused on the indirect photolysis induced by reactive oxygen species (ROS). Due to the ubiquitous nature of dissolved natural organic matter (NOM) in the environment, it is widely used as a photosensitizer to absorb light and subsequently generate reactive triplet state NOM (3NOM*) and/or induce production of ROS, such as singlet oxygen (1O2), superoxide anions (˙O2−), hydrogen peroxide (H2O2), and hydroxyl radicals (˙OH).12 NOM can also transfer absorbed energy to other suitable receptors thereby inducing a corresponding degradation of the receptor.
Previous studies revealed that NOM interacts with hydrophobic organic contaminants (HOCs) via a variety of mechanisms.13–15 The effect of NOM on HOC photolysis is a dual action mechanism, suppressing photolysis by light-shielding and producing ROS to oxidatively degrade HOCs or produce triplet NOM (3NOM*) to sensitize degradation of HOCs.11 Therefore, it is of great practical significance to study the effects of NOM on photochemical degradation of HOCs. Xu et al. (2011) reported that the photolytic rate of amoxicillin in the presence of fulvic acid was significantly increased and the photolytic contribution ratios of singlet and triplet excited state NOM was 48–74%.14 However, the contribution of NOM on photolysis of HOCs is highly dependent on the pollutant structure and concentrations.16 MTCS is a typical HOC with low water solubility, but so far the effects of NOM on the photochemical behavior of MTCS have not been rigorously examined.
Pony Lake fulvic acid (PLFA) and Suwannee River fulvic acid (SRFA) are derived from microbial and terrestrial NOM sources, respectively, and are two of the most representative NOM isolates utilized in previous studies.17,18 SRFA has lower nitrogen and sulfur functional groups and more aromatic moieties than PLFA, and thus their effects on photolysis of HOCs are likely to differ.19,20 Herein, we investigated the effects of SRFA and PLFA on the photodegradation of MTCS. A series of experiments were conducted to elucidate the ROS generation mechanism and indirect photolysis of MTCS. To the best of our knowledge, this is the first comprehensive investigation on the indirect aqueous photolysis of MTCS in the presence of PLFA and SRFA. These results enhance our understanding of the photochemical fate of MTCS and provide a theoretical basis to predict the environmental fate of other similar emerging pollutants.
2. Materials and methods
2.1 Chemicals
Methyltriclosan (MTCS) (50 mg L−1 in methanol) was purchased from AccuStandard (New Haven, CT, USA). Sorbic acid (SA) and isopropyl alcohol (IPA) were obtained from Aladdin Industrial (Shanghai, China). Sodium azide (NaN3, 99.5%), furfuryl alcohol (FFA, 98%), rose Bengal (RB, 93%), 2,2,6,6-tetramethylpiperidine (TEMP, 99%) and 5,5-dimethyl-1-pyrroline-N-oxide (DMPO, 97%) were purchased from Sigma-Aldrich (Shanghai, China). Pony Lake fulvic acid (PLFA-microbial origin) and Suwannee River fulvic acid (SRFA-terrestrial origin) were acquired from the International Humic Substance Society (Denver, CO, USA) and dissolved in deionized water to form NOM isolate stock solution (100 mg L−1). Chromatographic-grade acetonitrile (CH3CN) and methanol (CH3OH) were obtained from Merck (Darmstadt, Germany). All other chemicals were of analytical grade and used as received without further purification. Deionized water (>18 MΩ cm) was prepared using a Millipore Milli-Q system (Bedford, MA, USA).2.2 Analytical methods
FFA was analyzed by high performance liquid chromatography (HPLC, 1260, Agilent, Wilmington, DE, USA) with a photodiode array detector and XDB-C18 column. MTCS was quantified by gas chromatography-mass spectrometry (Agilent GS-MS 7890-5977) using a HP-5MS capillary column (30 m × 0.32 mm I.D., 0.25 μm film thickness, Agilent). The detailed operational parameters are available in the ESI† section. The total ion chromatogram (TIC) and mass spectrum (MS) profile of MTCS (40 μg L−1) was shown in Fig S1.†An electron paramagnetic resonance instrument (Bruker A300 spectrometer, Bruker, Germany) was used to record electron paramagnetic resonance (EPR) signals for 1O2 and ˙OH with trapping reagents of TEMP and DMPO, respectively.
2.3 Photolytic experiments
A photochemical reactor (BL-GHX-V, Shanghai, China) was used for the photolytic experiments. A 300 W mercury lamp with a 290 nm cutoff filter was used as the sunlight simulation source. The irradiance spectrum of light source was measured by a SP-300 spectroradiometer (Acton Research Corporation, USA). Fig. S2† confirmed that the 290 nm cutoff filters provide the transmission of wavelengths above 290 nm. An air-cooled system was used to refrigerate the photochemical reactor.To avoid the quenching effect of methanol on hydroxyl radicals, MTCS standard solution (50 mg L−1) was first evaporated using a gentle nitrogen flow, and then redissolved in acetonitrile to form MTCS stock solution (40 mg L−1). The MTCS stock solution was stored in the dark to avoid photochemical degradation. An appropriate volume of deionized water was added to prepare the initial concentration of 40 μg L−1 MTCS (40 mL), which was then transferred into a quartz tube for photolytic experiments. Prior to photolysis, the quartz tube was wrapped with aluminum foil to shield the solution containing analytes from light. At given time intervals, an aliquot (5 mL) was transferred to a centrifuge tube for dispersive liquid–liquid microextraction (DLLME) pretreatment (Scheme S1†). In the direct photolytic experiment, NOM was not added to the photolytic solution, but it was fortified into the photolytic solution for indirect photolysis. NOM was fortified at concentrations of 5–25 mg L−1. All the experiments were carried out at least in triplicate.
2.4 Reactive species analysis
3. Results and discussion
3.1 Effects of NOM on the photolytic kinetics of MTCS
The maximum absorption spectrum of MTCS contains two bands in the ultraviolet region with absorption at 207 nm and 283 nm (Fig. S3†), respectively. The slight absorption above 290 nm suggested the direct absorption of simulating sunlight. Thus, the direct photolysis of MTCS using simulating sunlight (λ > 290 nm) without NOM fit an apparent-first-order kinetic model (Fig. 1a). The apparent MTCS direct photolysis rate constant (k) and correlation coefficient (R2) were (6.81 ± 0.20) × 10−3 min−1 and 0.996 (Table S1†), respectively. Subsequently, the direct MTCS photolysis transformation efficiency in pure water was quantified as quantum yields (Φ) measured relative to a p-nitroanisole/pyridine actinometer.22 The calculated Φ was 0.011, revealing the nonnegligible effect of direct MTCS photolysis under simulating light. Moreover, the k values for indirect photolysis were significantly decreased to (2.71 ± 0.12) × 10−3 and (1.62 ± 0.02) × 10−3 min−1 in the presence of PLFA and SRFA (20 mg L−1), respectively. These results showed that PLFA or SRFA prominently inhibited the photolysis of MTCS. Prior studies revealed that sunlight mediated organic compounds photodegradation in the presence of NOM involved direct pollutants photolysis and/or indirect contribution induced by reactive species such as hydroxyl radicals, single oxygen, triple state NOM and so on.23,24 Thus, it is necessary to clarify the inhibitory mechanism of PLFA and SRFA on MTCS photodegradation.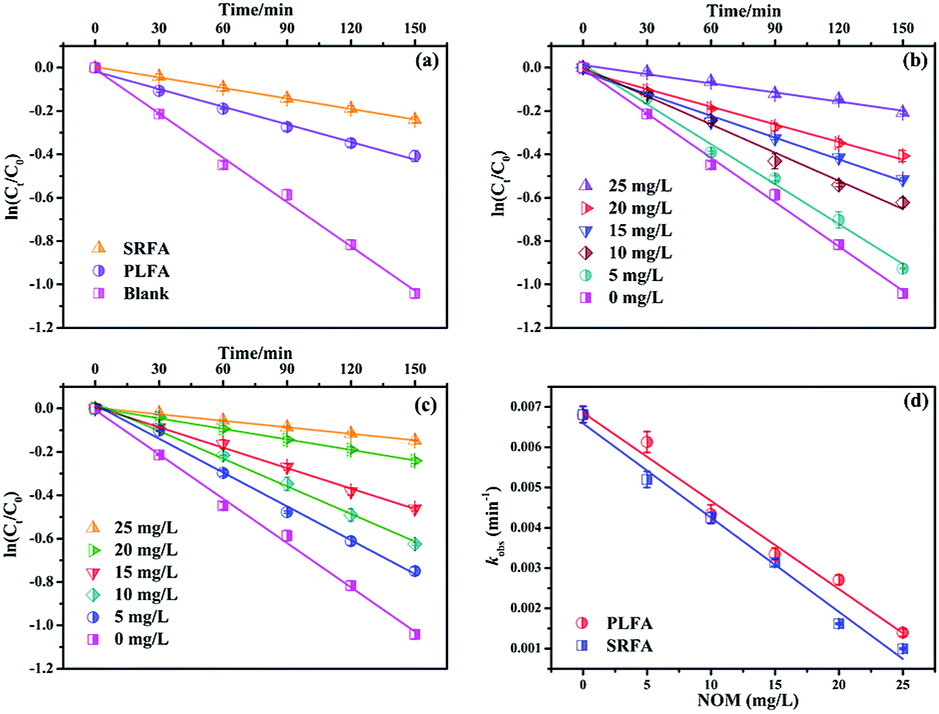 | ||
| Fig. 1 (a) Photodegradation kinetics of MTCS in the absence and presence of NOM (PLFA – Pony Lake fulvic acid and SRFA is Suwannee River fulvic acid). (b) Effects of PLFA concentrations on the photodegradation kinetics of MTCS. (c) Effects of SRFA concentrations on the photodegradation kinetics of MTCS. (d) Kinetics comparison of MTCS photodegradation in the presence of PLFA and SRFA. | ||
Subsequently, it further revealed that MTCS photolysis rates in the presence of SRFA ((1.62 ± 0.02) × 10−3 min−1) was lower than PLFA ((2.71 ± 0.12) × 10−3 min−1) (Fig. 1a and Table S1†). This difference originates from the contrasting chemical and optical properties of SRFA and PLFA.25 For example, Guerard et al. (2009) demonstrated that a large photo-enhancement of sulfadimethoxine (SDM) and triclocarban (TCC) occurred in the presence of PLFA, while little enhanced photolysis in the SRFA.17 The higher aromatic content in terrestrially derived NOM (SRFA) allows it to absorb more light per unit carbon resulting in a larger molar absorptivity or specific UV absorbance compared to autochthonous NOM (PLFA).26 Moreover, Felcyn et al. (2012) found that NOM from microbial origin (PLAF) was an excellent photosensitizer compared to NOM from terrestrial sources (SRFA).18
Photodegradation rates for MTCS were significantly decreased from (6.81 ± 0.20) × 10−3 min−1 to (1.40 ± 0.09) × 10−3 or (1.00 ± 0.02) × 10−3 min−1 (Table S2†) with increasing NOM concentrations from 0 to 25 mg L−1 (Fig. 1b and c). However, MTCS photodegradation efficiency was slightly higher in the presence of PLFA compared to SRFA (Fig. 1d). Because the photolysis of organic contaminants in sunlight-induced natural waters is caused by NOM-derived active substances (e.g., 1O2, ˙OH and 3NOM*), NOM with differing chemical compositions can lead to different indirect reactions and rates.
3.2 Effects of ROS on MTCS indirect photodegradation
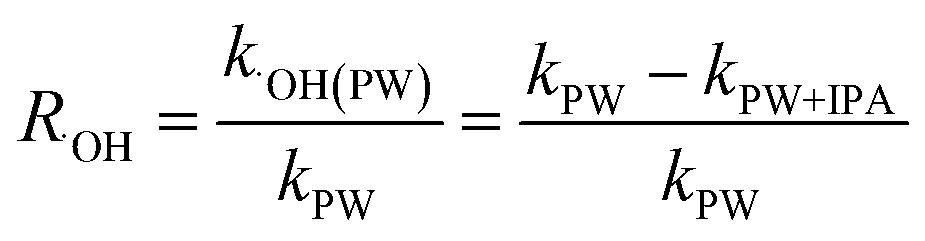
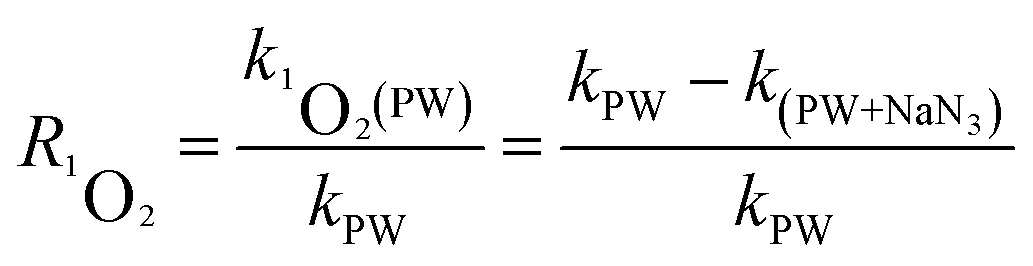
A series of quencher experiments were then carried out to qualitatively describe the effects of 1O2 and ˙OH in the indirect photolysis process. MTCS solutions containing 20 mg L−1 NOM were investigated in pure water under irradiation (λ > 290 nm), with the addition of IPA as a ˙OH scavenger and NaN3 as a 1O2 scavenger (Fig. 2).21 The MTCS photolytic rate in the presence of PLFA decreased from (2.71 ± 0.12) × 10−3 to (1.91 ± 0.06) × 10−3 min−1 with the addition of IPA revealing the specific contribution of ˙OH to MTCS photodegradation in the presence of PLFA. Further, the k value prominently decreased from (2.71 ± 0.12) × 10−3 to (1.12 ± 0.05) × 10−3 min−1 in the presence of NaN3, which demonstrated that 1O2 played a crucial role in the indirect photolysis of MTCS. Similarly, MTCS photodegradation constants in the presence of SRFA decreased from (1.62 ± 0.02) × 10−3 to (1.31 ± 0.04) × 10−3 and (1.00 ± 0.01) × 10−3 min−1 with the addition of IPA and NaN3 (Table 1), respectively. The contribution of ˙OH and 1O2 to the MTCS photolysis process (R˙OH and R1O2) were calculated as follows:
 | (1) |
 | (2) |
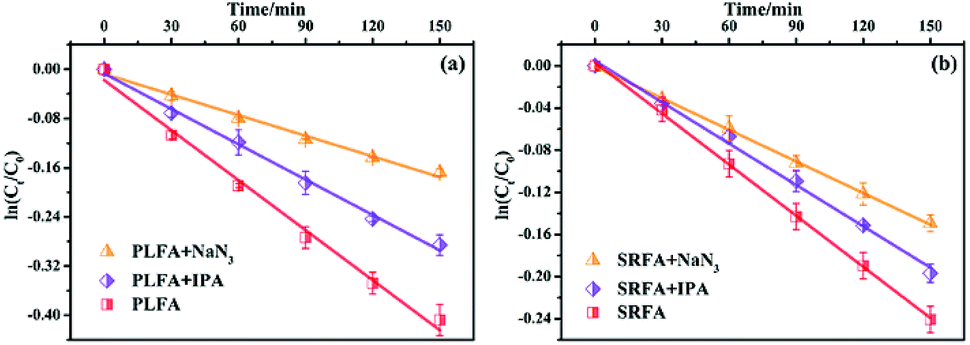 | ||
| Fig. 2 Effects of NaN3 and isopropyl alcohol (IPA) on photodegradation kinetics of MTCS in the presence of (a) PLFA (Pony Lake fulvic acid, 20 mg L−1) and (b) SRFA (Suwannee River fulvic acid, 20 mg L−1). | ||
| k | SRFA*(× 10−3 min−1) | PLFA*(× 10−3 min−1) |
|---|---|---|
| a *PLFA is Pony Lake fulvic acid (microbial origin, 20 mg L−1) and SRFA is Suwannee River fulvic acid (terrestrial origin, 20 mg L−1). | ||
| kPW | 1.62 ± 0.02 | 2.71 ± 0.12 |
| kPW+IPA | 1.31 ± 0.04 | 1.91 ± 0.06 |
| k˙OH(PW) | 0.31 | 0.80 |
| kPW+NaN3 | 1.00 ± 0.01 | 1.12 ± 0.05 |
| k1O2(PW) | 0.62 | 1.59 |
To clarify the dual contribution of light-shielding and ROS on the MTCS photolysis, light screening factors (S) was calculated during the photolysis process in the presence of PLFA and MTCS.29 The results revealed that S of SRFA and PLFA for the MTCS photolysis were 0.101 and 0.047, respectively, suggesting the higher contribution of light-shielding on MTCS photolysis. Thus, we concluded that the overall decrease in MTCS photolysis was caused by the inhibitive effect of light-shielding and promoted effect of ROS in the presence of PLFA and SRFA.
Subsequently, the steady-state concentration of ˙OH was determined by monitoring the generation of 2-hydroxyterephthalic acid (hTPA) using terephthalate (TPA) as a probe.30 Fig. S4† shown that the hTPA concentrations increased by prolonging the photolysis time in the presence of SRFA and PLFA. The calculated steady state concentrations of ˙OH were 1.73 × 10⁻¹⁶ and 1.33 × 10⁻¹⁶ M for the SRFA and PLFA, respectively. However, limited hTPA were detected in the photolysis systems with the addition of IPA. All of these results confirmed the important of reactive oxygen species on the MTCS indirect photolysis.
3.3 EPR detection of ˙OH and 1O2
EPR was used to identify ROS formation during the MTCS photodegradation process.31–34 TEMP is a typical capture agent for 1O2, which reacts with 1O2 to produce a stable paramagnetic adduct TEMP-1O2 with a characteristic line of 1![[thin space (1/6-em)]](https://www.rsc.org/images/entities/char_2009.gif) :1:1.31 Typical 1:1:1 triplet signals were obtained after irradiation of MTCS, TEMP and NOM (Fig. 3a and c) revealing generation of 1O2 during the photolysis process. Moreover, the signal intensity increased significantly with prolonged irradiation time. To confirm the contribution of 1O2 on the formation of TEMP-1O2, NaN3 was added to the MTCS, NOM and TEMP mixture to inhibit 1O2. The NaN3 strongly decreased the triplet signal for TEMP-1O2 (Fig. 3), which verified that formation of the TEMP-1O2 spin adduct was inhibited. For comparison, the EPR signal of TEMP-1O2 was also collected during the photolysis process without NOM. Fig. S5a† revealed that limited TEMP-1O2 signal was obtained in the absence of NOM. In total, these results confirmed that 1O2 was generated during MTCS photolysis in the presence of PLFA and SRFA.
:1:1.31 Typical 1:1:1 triplet signals were obtained after irradiation of MTCS, TEMP and NOM (Fig. 3a and c) revealing generation of 1O2 during the photolysis process. Moreover, the signal intensity increased significantly with prolonged irradiation time. To confirm the contribution of 1O2 on the formation of TEMP-1O2, NaN3 was added to the MTCS, NOM and TEMP mixture to inhibit 1O2. The NaN3 strongly decreased the triplet signal for TEMP-1O2 (Fig. 3), which verified that formation of the TEMP-1O2 spin adduct was inhibited. For comparison, the EPR signal of TEMP-1O2 was also collected during the photolysis process without NOM. Fig. S5a† revealed that limited TEMP-1O2 signal was obtained in the absence of NOM. In total, these results confirmed that 1O2 was generated during MTCS photolysis in the presence of PLFA and SRFA.
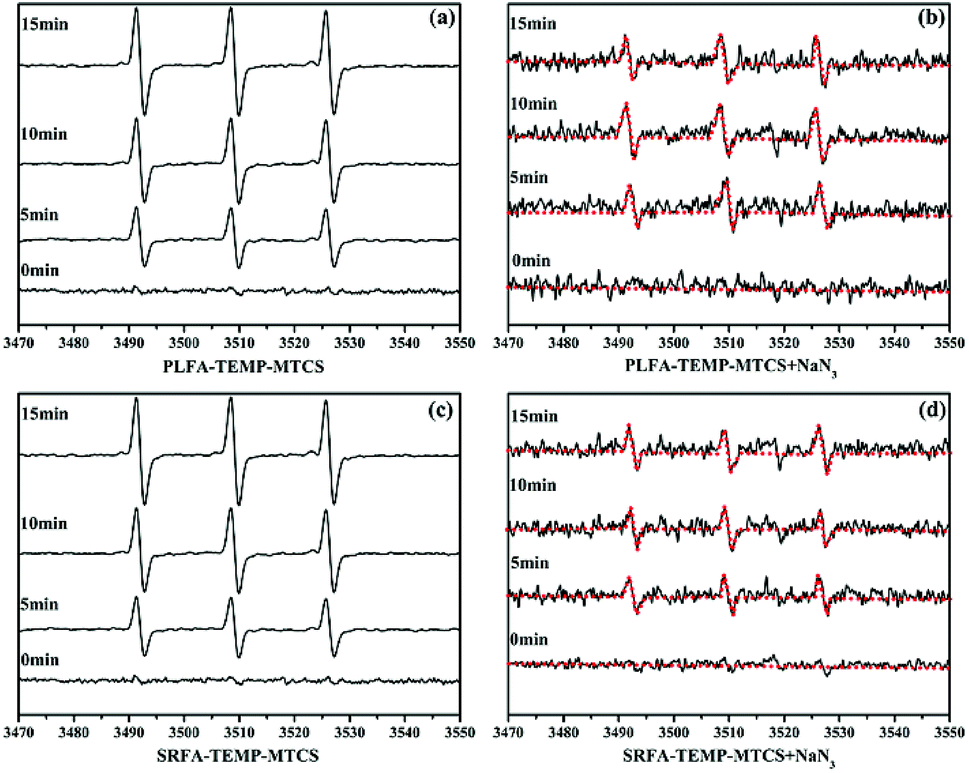 | ||
| Fig. 3 EPR spectra of 1O2 spin-trapping with TEMP under different conditions. (a) PLFA (20 mg L−1), (b) PLFA (20 mg L−1)/NaN3, (c) SRFA (20 mg L−1), (d) SRFA (20 mg L−1)/NaN3. PLFA is Pony Lake fulvic acid and SRFA is Suwannee River fulvic acid. | ||
DMPO is a typical capture agent for ˙OH, which reacts with ˙OH to produce DMPO-˙OH, a stable paramagnetic adduct with a characteristic line of 1:2:2:1.35 Four characteristic peaks with a 1:2:2:1 quarter pattern were obtained after irradiation of MTCS and NOM, indicating generation of ˙OH (Fig. 4). The signal intensity for DMPO-˙OH increased significantly with increased irradiation time (Fig. 4a and c). The signal sharply decreased with IPA addition under identical conditions (Fig. 4b and d), confirming that the EPR signal was formed by reaction of DMPO and ˙OH. Moreover, no DMPO-˙OH signal was obtained in the absence of NOM during the MTCS photolysis process (Fig S5b†). In sum, the EPR results demonstrated the generation of ˙OH and 1O2 during MTCS photolysis in the presence of NOM.
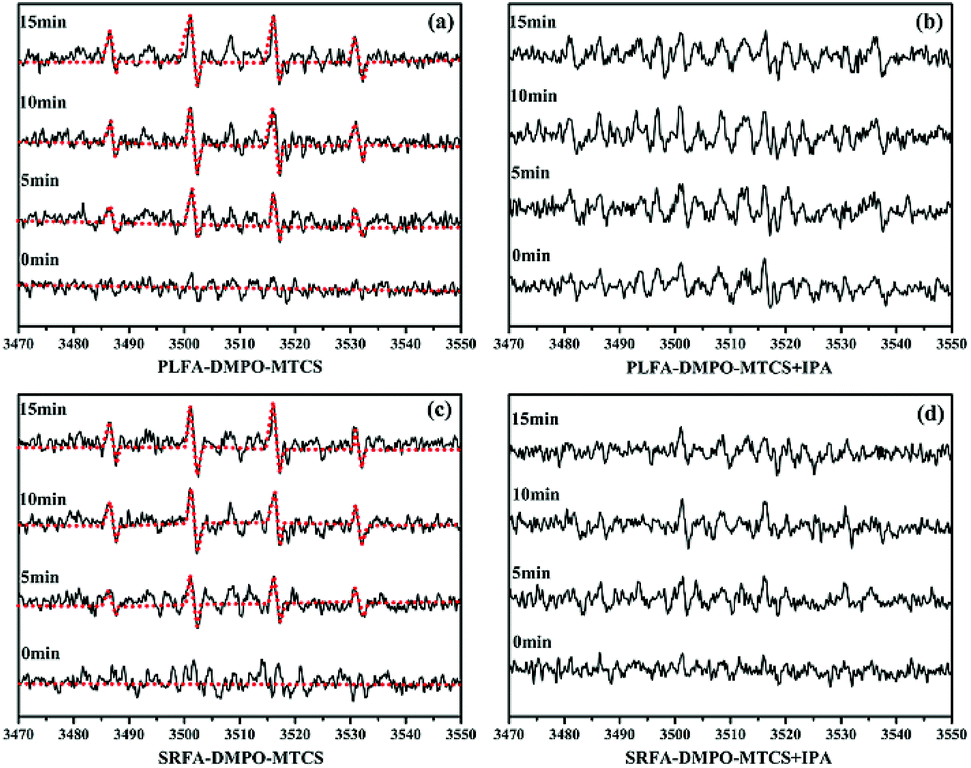 | ||
| Fig. 4 EPR spectra of ˙OH spin-trapping with DMPO under different conditions. (a) PLFA (20 mg L−1), (b) PLFA (20 mg L−1)/IPA, (c) SRFA (20 mg L−1), (d) SRFA (20 mg L−1)/IPA. PLFA is Pony Lake fulvic acid and SRFA is Suwannee River fulvic acid. | ||
3.4 Kinetic studies for 1O2 reaction with MTCS
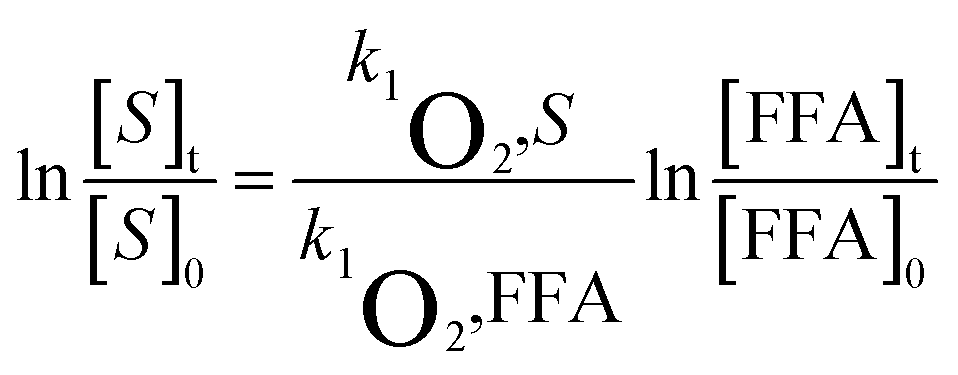
To evaluate the bimolecular reaction rate constant of 1O2 with MTCS at pH 7.0, rose bengal (RB) and FFA were used as photosensitizer and reference compounds in the MTCS photodegradation system, respectively.36 From the steady-state 1O2 concentration and reaction rate constant, it is possible to determine the 1O2 contribution to the photolytic process. Concentrations of the target (MTCS) and reference (FFA) compounds were simultaneously monitored to evaluate their reaction kinetics with 1O2. The bimolecular reaction rate constant of FFA with 1O2 (kFFA) was determined to be 1.20 × 10⁸ M−1 s−1 and was used in calculating the bimolecular reaction rate constant for MTCS with 1O2 (k1O2) via eqn (3):
 | (3) |
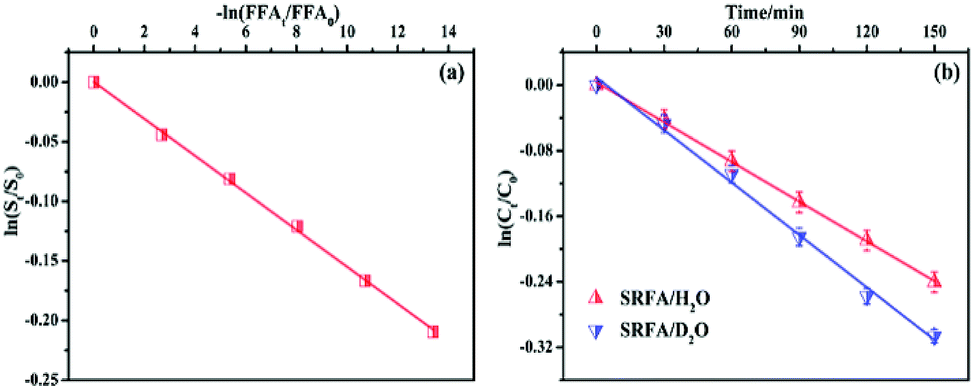 | ||
| Fig. 5 (a) Loss of MTCS versus loss of furfuryl alcohol (FFA) in the presence of rose bengal. (b) Effect of D2O on the photodegradation of MTCS in aqueous solution. SRFA (20 mg L−1) is Suwannee River fulvic acid. | ||
3.5 Photolysis of MTCS in D2O solution
Due to the longer lifetime of 1O2 in deuterated solvents, D2O was used as the MTCS solvent to further examine the role of 1O2 in the photolytic process. Literature sources report that the reaction rate in D2O should be about 14 times higher than in H2O, if the degradation was fully controlled by 1O2.42 Thus, the rate constant in D2O should be significantly increased compared to H2O under the premise that the reaction with 1O2 was the primary transformation pathway for MTCS degradation.43 However, the measured degradation rates for MTCS in D2O ((2.13 ± 0.08) × 10−3 min−1) did not show a significant increase over that in H2O ((1.62 ± 0.02) × 10−3 min−1) (Fig. 5b). This indicates that indirect photolysis related to 1O2 was not the exclusive mechanism responsible for photodegradation of MTCS. Therefore, we concluded that MTCS photodegradation in the presence of NOM could be ascribed to synergistic effects among 1O2, ˙OH and direct photolysis.3.6 Role of 3NOM*
As an effective photosensitizer, NOM can absorb sunlight to form excited states (e.g., 3NOM*). The 3NOM* can then react with dissolved oxygen to generate a series of ROS, such as 1O2, ˙O2−, and ˙OH. Organic molecules can subsequently be degraded by these ROS or react by transferring electrons or energy with 3NOM*. Thus, it is necessary to distinguish the effect of 3NOM* on MTCS photodegradation in the presence of NOM. Oxygen can be used as a triplet-excited-state quencher to inhibit the contribution of 3NOM*.15,44 Hence, MTCS photodegradation was conducted with O2 (air-saturated) and without O2 (N2-saturated) to evaluate the contribution of 3NOM* (Fig. 6a and Table S3†). Photodegradation rates for MTCS in N2-saturated conditions ((3.44 ± 0.03) × 10−3 min−1 and (4.12 ± 0.11) × 10−3 min−1) were significantly higher than for air-saturated conditions ((1.62 ± 0.02) × 10−3 min−1 and (2.71 ± 0.12) × 10−3 min−1) in the presence of SRFA and PLFA, respectively. These results indicate that the direct reaction of MTCS with 3NOM* was important in the absence of oxygen.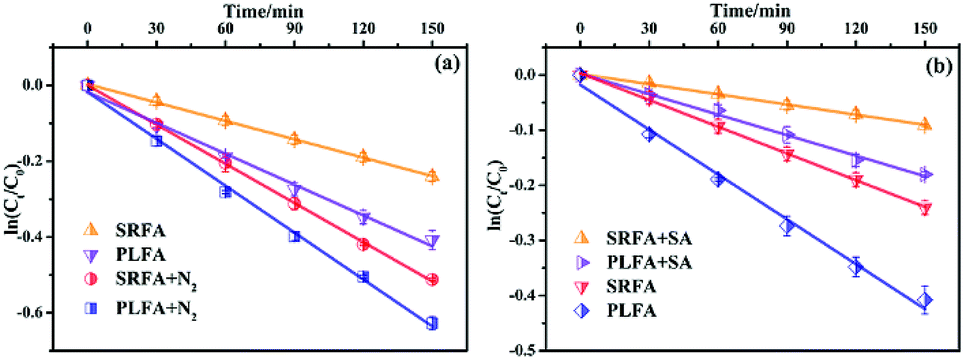 | ||
| Fig. 6 (a) MTCS photodegradation in the presence of PLFA (20 mg L−1) and SRFA (20 mg L−1) under nitrogen (anaerobic) and air saturated (aerobic) conditions. (b) Effect of added triplet quencher sorbic acid (SA) on the photodegradation of MTCS in the presence of PLFA (20 mg L−1) and SRFA (20 mg L−1). PLFA is Pony Lake fulvic acid and SRFA is Suwannee River fulvic acid. | ||
To confirm the involvement of 3NOM* in aerobic MTCS photolysis, the effect of a triplet quencher (sorbic acid) on MTCS indirect photolytic rates was evaluated.45 It revealed that MTCS photodegradation rates in the presence of SRFA and PLFA were significantly decreased from (1.62 ± 0.02) × 10−3 and (2.71 ± 0.12) × 10−3 min−1 to (0.61 ± 0.01) × 10−3 and (1.24 ± 0.05) × 10−3 min−1 when sorbic acid was added to quench 3NOM* (Fig. 6b and Table S3†), inferring that 3NOM* plays an important role in the indirect photolysis of MTCS. However, it must be noted that sorbic acid not only quenches 3NOM*, but also 1O2, and thus it can simultaneously reduce the steady-state concentrations of both 3NOM* and 1O2 in aqueous solutions. Thus, decreased indirect reaction rates for MTCS may result from a decrease in 3NOM* and/or 1O2. Consequently, the photodegradation efficiency of MTCS was strongly inhibited by addition of sorbic acid. Overall, these findings support that the indirect photolysis of MTCS in the presence of NOM was mainly due to reaction with 1O2 induced by the activation of 3NOM*, whereas the contribution of ˙OH and direct photodegradation was less important.
4. Conclusions
In this study, the photodegradation of MTCS in the presence of PLFA (microbial origin) or SRFA (terrestrial origin) were systematically investigated. Results confirmed that both PLFA and SRFA significantly inhibited direct MTCS photodegradation via light-shielding. Further, the indirect photodegradation of MTCS was depressed by reaction between 3NOM* and O2 to generate ROS rather than the direct reaction between 3NOM* and MTCS. The results of this study provide new insights on the indirect photolysis of MTCS in the presence of NOM under simulated natural environmental conditions.Conflicts of interest
There are no conflicts to declare.Acknowledgements
This work was jointly supported by the National Natural Science Foundation of China (Grants 21577107 and 21707105), Zhejiang Provincial Natural Science Foundation (Grant LY15B070009), Zhejiang Provincial Public Benefit Project (Grants 2016C34011 and LGF18B070004), Wenzhou City Water Pollution Control and Governance Technology Innovation Project (Grants W20170001 and W20170017), Research and Development Fund of Wenzhou Medical University (Grant QTJ16013), and Zhejiang Provincial Xinmiao Talent Project (Grant 2016R413021).Notes and references
- L. M. Mcmurry, M. Oethinger and S. B. Levy, Nature, 1998, 394, 531–532 CrossRef PubMed.
- P. Canosa, I. Rodríguez, E. Rubí, M. Ramil and R. Cela, J. Chromatogr. A, 2008, 1188, 132–139 CrossRef PubMed.
- A. M. Calafat, X. Ye, L. Y. Wong, J. A. Reidy and L. L. Needham, Environ. Health Perspect., 2008, 116, 303–307 CrossRef PubMed.
- J. Parkkonen, Chemosphere, 2002, 46, 1485–1489 CrossRef.
- A. Lindström, I. J. Buerge, T. Poiger, P. A. Bergqvist, M. D. Müller and H. R. Buser, Environ. Sci. Technol., 2002, 36, 2322–2329 CrossRef.
- M. Mezcua, M. J. Gómez, I. Ferrer, A. Aguera, M. D. Hernando and A. R. Fernández-Alba, Anal. Chim. Acta, 2004, 524, 241–247 CrossRef.
- R. Valo and M. Salkinoja-Salonen, J. Gen. Appl. Microbiol., 1986, 32, 505–517 CrossRef.
- M. M. Häggblom, D. Janke, P. J. M. Middeldorp and M. S. Salkinoja-Salonen, Arch. Microbiol., 1989, 152, 6–9 CrossRef.
- M. E. Balmer, T. Poiger, C. Droz, K. Romanin, P. A. Bergqvist, M. D. Müller and H. R. Buser, Environ. Sci. Technol., 2004, 38, 390–395 CrossRef PubMed.
- A. Lindström, I. J. Buerge, T. Poiger, P. A. Bergqvist, M. D. Müller and H. R. Buser, Environ. Sci. Technol., 2002, 36, 2322–2329 CrossRef.
- H. Wang, J. Gao, N. Yu, J. Qu, F. Fang, H. Wang, M. Wang and X. Wang, Talanta, 2016, 154, 381–391 CrossRef PubMed.
- O. N. Aleksandrova, M. Schulz and M. Matthies, Water, Air, Soil Pollut., 2011, 221, 203–214 CrossRef.
- C. Yong, C. Hu, X. X. Hu and J. H. Qu, Environ. Sci. Technol., 2009, 43, 2760–2765 CrossRef.
- H. Xu, W. J. Cooper, J. Jung and W. Song, Water Res., 2011, 45, 632–638 CrossRef PubMed.
- W. Yang, S. Ben Abdelmelek, Z. Zheng, T. An, D. Zhang and W. Song, Water Res., 2013, 47, 6558–6565 CrossRef PubMed.
- S. Canonica and H. U. Laubscher, Photochem. Photobiol. Sci., 2008, 7, 547–551 Search PubMed.
- J. J. Guerard, P. L. Miller, T. D. Trouts and Y. P. Chin, Aquat. Sci., 2009, 71, 160–169 CrossRef.
- J. R. Felcyn, J. C. Davis, L. H. Tran, J. C. Berude and D. E. Latch, Environ. Sci. Technol., 2012, 46, 6698–6704 CrossRef PubMed.
- J. Chen, B. Gu, E. J. Leboeuf, H. Pan and S. Dai, Chemosphere, 2002, 48, 59–68 CrossRef PubMed.
- C. Jiang, G. R. Aiken and H. Hsu-Kim, Environ. Sci. Technol., 2015, 49, 11476–11484 CrossRef PubMed.
- D. E. Latch, B. L. Stender, J. L. Packer, W. A. Arnold and K. Mcneill, Environ. Sci. Technol., 2003, 37, 3342–3350 CrossRef PubMed.
- M. Wang, H. l. Wang, R. B. Zhang, M. P. Ma, K. Mei, F. Fang and X. D. Wang, PLoS One, 2015, 10, e0135400 Search PubMed.
- S. S. Walse, S. L. Morgan, L. Kong and J. L. Ferry, Environ. Sci. Technol., 2004, 38, 3908–3915 CrossRef PubMed.
- W. Chu, K. H. Chan, C. Y. Kwan and C. T. Jafvert, Environ. Sci. Technol., 2005, 39, 9211–9216 CrossRef PubMed.
- J. Wenk, M. Aeschbacher, M. Sander, U. von Gunten and S. Canonica, Environ. Sci. Technol., 2015, 49, 8541–8549 CrossRef PubMed.
- Y. P. Chin, G. Aiken and E. O'Loughlin, Environ. Sci. Technol., 1994, 28, 1853–1858 CrossRef PubMed.
- L. K. Ge, J. W. Chen, X. L. Qiao, L. Jing and X. Y. Cai, Environ. Sci. Technol., 2009, 43, 3101–3107 CrossRef PubMed.
- R. G. Zepp, P. F. Schlotzhauer and R. M. Sink, Environ. Sci. Technol., 1985, 19, 74–81 CrossRef.
- S. S. Walse, S. L. Morgan, L. Kong and J. L. Ferry, Environ. Sci. Technol., 2004, 38, 3908–3915 CrossRef PubMed.
- T. Zeng and W. A. Arnold, Environ. Sci. Technol., 2013, 47, 6735–6745 CrossRef PubMed.
- M. Zhan, X. Yang, Q. Xian and L. Kong, Chemosphere, 2006, 63, 378–386 CrossRef PubMed.
- Y. Chen, C. Hu, J. Qu and M. Yang, J. Photochem. Photobiol., A, 2008, 197, 81–87 CrossRef.
- X. D. Zhu, Y. J. Wang, C. Liu, W. X. Qin and D. M. Zhou, Chemosphere, 2014, 107, 274–281 CrossRef PubMed.
- Y. Yao, Y. Mao, Q. Huang, L. Wang, Z. Huang, W. Lu and W. Chen, J. Hazard. Mater., 2014, 264, 323–331 CrossRef PubMed.
- L. Khachatryan, C. A. McFerrin, R. W. Hall and B. Dellinger, Environ. Sci. Technol., 2014, 48, 9220–9226 CrossRef PubMed.
- F. E. Scully and J. Hoigné, Chemosphere, 1987, 16, 681–694 CrossRef.
- S. Halladja, A. T. H. J. Aguer, A. A. Boulkamh and C. Richard, Environ. Sci. Technol., 2007, 41, 6066–6073 CrossRef PubMed.
- M. M. Kelly and W. A. Arnold, Environ. Sci. Technol., 2012, 46, 5396–5403 CrossRef PubMed.
- A. L. Boreen, B. L. Edhlund, J. B. Cotner and K. Mcneill, Environ. Sci. Technol., 2008, 42, 5492–5498 CrossRef PubMed.
- Y. Barbieri, W. A. Massad, D. J. Diaz, J. Sanz, F. Amat-Guerri and N. A. Garcia, Chemosphere, 2008, 73, 564–571 CrossRef PubMed.
- Q. Xie, J. Chen, H. Zhao, X. Qiao, X. Cai and X. Li, Chemosphere, 2013, 90, 188–194 CrossRef PubMed.
- P. B. Merkel and D. R. Kearns, J. Am. Chem. Soc., 1972, 94, 7244–7253 CrossRef.
- I. B. C. Matheson, J. Lee and A. D. King, Chem. Phys. Lett., 1978, 55, 49–51 CrossRef.
- Y. Li, Y. Pan, L. Lian, S. Yan, W. Song and X. Yang, Water Res., 2017, 109, 266–273 CrossRef PubMed.
- J. E. Grebel, J. J. Pignatello and W. A. Mitch, Water Res., 2011, 45, 6535–6544 CrossRef PubMed.
Footnotes |
| † Electronic supplementary information (ESI) available: Total ion chromatogram and mass spectrum of MTCS, DLLME procedure, apparent-first-order kinetic rate constants. See DOI: 10.1039/c8ra03512a |
| ‡ These authors should be considered co-first authors. |
| This journal is © The Royal Society of Chemistry 2018 |