 Open Access Article
Dual-spectra encoded suspension array using reversed-phase microemulsion UV curing and electrostatic self-assembling
Guangxia Feng†
ab,
Qinghua He†ac,
WenYue Xied,
Yonghong He *ac,
Xuejing Chenac,
Bei Wanga,
Bangrong Lua and
Tian Guan*ab
aInstitute of Optical Imaging and Sensing, Shenzhen Key Laboratory for Minimal Invasive Medical Technologies, Graduate School at Shenzhen, Tsinghua University, Shenzhen 518055, People's Republic of China. E-mail: heyh@sz.tsinghua.edu.cn; guantian@sz.tsinghua.edu.cn
bSchool of Medicine, Tsinghua University, Beijing 100084, People's Republic of China
cDepartment of Physics, Tsinghua University, Beijing 100084, People's Republic of China
dDepartment of Clinical Laboratory, Peking University ShenZhen Hospital, China
First published on 11th June 2018
Abstract
The rapid growth of demand for high-throughput multiplexed biochips from modern biotechnology has led to growing interest in suspension array based on multi-channel encoded microbeads. We prepare dual-spectra encoded PEGDA microbeads (DSEPM) by reversed-phase microemulsion UV curing method and layer-by-layer electrostatic self-assembly method. Excitation of the synthesized DSEPM results in two spectra, including fluorescence spectra from quantum dots and laser induced breakdown spectra from nanoparticles with specific elements. With further surface modification and bio-probes grafting, we use DSEPM to carry a series of detection experiments of biomolecules. The adsorption experiment to two types of anti-IgG in mixture sample has demonstrated the availability of DSEPM in multiplexing. Then, the contrast experiment has verified the specificity of DSEPM in detection. Finally, we carry out the concentration gradient experiment and obtain the response curve to show the performance of DSEPM in quantitative analysis. The results indicate our method provide an effective way to improve multiplexed biochips with more coding capacity, accuracy and stability.
Introduction
The increasing development of life sciences and analytical chemistry poses an urgent demand for high-throughput technologies. In order to achieve rapid and efficient detection of different analytes, suspension array has been experiencing an unprecedented development.1–5 Compared with the traditional microarray, suspension array has significant advantages such as multiplexing performance, fast binding kinetics, high flexibility, biological adaptability and detection sensitivity.6–9The application of suspension array is based on barcode microbeads, so encoded microbeads play a very important role in the detection system. After being modified with specific functional groups and binding sites,10 the surface of microbeads is decorated with bio-probes, thus encoded microbeads can specifically capture targets biomolecules. Then the decoding process is performed to recognize the encoded microbeads, realizing the qualitative analysis of biomolecules.11 Therefore, the detection performance of suspension array greatly depends on the decoding performance of encoded microbeads. After decades of development, several coding methods have been explored, including optical barcode,12–17 chemical barcode,18 graphical barcode.4 Among them, the optical barcode is considered to be the most appealing technique.19,20 Fluorescence is most common optical encoding method which endows microbeads with different spectral addresses by utilizing various of intensities and wavelengths, then each microbead could distinguish from others in the multiplexed detection. Organic dyes,17 as important fluorescent encoding materials, have attracted a great deal of attention and been used in commercial suspension arrays. However, there are still some obvious disadvantages limiting the performance of organic dyes encoding. First, broad emission spectrum results in the waste of encoding spectrum range. Then, the decoding procedure could be influenced by photobleaching. Further, multiple light sources and high costs of detection platform are necessary for detection.21 As a type of newly developed fluorescent material, quantum dots (QDs) show several superiorities in optical characteristics, such as narrow emission spectrum, broad excitation wavelength, high quantum yield, photobleaching resistance and tunable emission wavelength.12,22 Hence, QDs have turn into one of the most promising materials in encoding application of suspension array.23–25
There are several methods to prepare QDs encoded microbeads, mainly including self-healing method26,27 and microfluidic method.16,28–31 However, the self-healing method relies on the coordination of the pore diameter of the polymer microbeads and the size of QDs. Besides, the subsequent processing is complicated and the porous surface is prone to the leakage of quantum dots, resulting in toxicity. Also, the microfluidic method is affected by factors such as the size of the entrance of the microchannel, the flow rate of the two phases, the interfacial tension and the viscosity of the two phases. Apart from these, the microfluidic system is relatively complicated and the preparation speed is too slow to satisfy the actual demand. Further, with above preparation methods, theoretically, a considerable amount of coding capacity can be produced by combinations of different fluorescence wavelengths and intensities. Yet, the application of QDs also faces some limitations. The emission spectrum of QDs is still wide and the unavoidable fluorescence cross talk exists when QDs of various wavelengths doped together. In addition, in immunoassay, the probes of the analytes are usually labeled with fluorescence, which will easily lead to the interferences of decoding and detecting fluorescence signals during the detection.32 Therefore, the practical number of available codes is far less than the theoretical value. Considering above problems, it is necessary to further explore the synthesis and coding method of suspension array to improve the coding performance.
In this study, we proposed a type of suspension array which was encoded by dual-spectra, including fluorescence and laser induced breakdown spectra. By using reversed-phase microemulsion UV curing and layer-by-layer electrostatic self-assembly methods, we prepared core–shell microbeads with QDs inside and covered with specific elementary encoded materials on the surface. First, to achieve the fluorescence encoding channel, we prepared the QDs encoded microbeads with reversed-phase microemulsion UV curing method. The disperse phase including QDs was stirred and cut into small droplets by the continuous phase, forming suspension emulsion and then were cured into solid beads under UV curing. After collecting and screening, the microbeads with similar sizes were selected for the coupling of the second encoding channel. On the one hand, this method is kind of universal to different sizes of the QDs and it can prevent the leakage of QDs. On the other hand, the operation is simple and the productivity could be much higher than microfluidic method. Then, the elementary encoded materials, which are some metal and metal oxides nanoparticles (EENPs) in this study, were assembled on the surface of QDs encoded microbeads by layer-by-layer electrostatic self-assembly method. With laser induced breakdown spectroscopy (LIBS), the EENPs on the surface of microbeads can generate and produce the second encoding spectra. LIBS utilizes laser to induce sample to form surface plasma, then the plasma decay and radiate laser induced breakdown spectra, which contain massive atomic spectra. Therefore, LIBS can generate the specific encoding spectra of above microbeads, realizing the dual-spectra encoding.33 In our experiments several types of EENPs were assembled on QDs doped microbeads to increase the barcodes by a multiplicative model, effectively amplifying the coding capacity of suspension array. Besides, laser induced breakdown spectrum is a linear spectrum with sharp peaks, so that the peak data can be read directly to provide digital coding. In addition, laser induced breakdown spectrum can prevent cross-linking of fluorescent labels on the analytes, ensuring the decoding accuracy of suspension arrays in fluorescence immunoassay. Furthermore, since the peak positions of laser induced breakdown spectrum will not be interfered by outside environments, like different temperatures, humidity, acid alkalinity and valence states of elements, the decoding signals can be stable.34–36 With the dual-spectra encoded mechanism, we can expand the coding capacity and ensure the decoding accuracy as well as stability of suspension array.
Experiments
Materials
Poly(ethylene glycol)diacrylate (PEGDA, average Mn = 250), EM-90, hexadecane were purchased from Sigma-Aldrich. Core–shell CdSe/ZnS QDs (3.5 mg ml−1), anti-IgG (labeled with QDs) were purchased from Wuhan Jiayuan Quantum Dot Technological Development Corporation, China. Methoxy PEG Thiol (mPEG-SH, MW 5000) was purchased from JenKem Technology Corporation, China. 2-Hydroxy-4′-methylpropiophenone-(2-hydroxyethoxy)-2 methylpropiophenone (photoinitiator), magnesium oxide (MgO), dopamine hydrochloride were purchased from Macklin reagent. Silver (Ag), cuprous oxide (Cu2O) were purchased from Beijing DK nano Technology Corporation, China. Polyethylenimine (PEI), poly(sodium-pstyrenesulfonate) (PSS), N-hydroxysuccinimide (NHS), N-(3-dimethylaminopropyl)-N′-ethylcarbodiimide hydrochloride (EDC) were purchased from Sigma-Aldrich. Non protein blocking solution were purchased from Beyotime Biotechnology, China.Instruments
Scanning electron microscopy (SEM, ZEISS SUPRA®55), Energy dispersive spectrometer (EDS, ZEISS SUPRA®55), optical microscopy (Olympus), fluorescence microscopy (Olympus), Zetasizer Nano ZS (Malvern), X-ray diffractometer (Bruker), Thermal gravity analyzer TGA2 (Mettler Toledo), Laser confocal microscope (FV1000, Olympus), Spectrofluorophotometer (RF-5301 PC, SHIMADZU), home-made LIBS-based system.Principle of encoding, decoding and detection mode of dual-spectra encoded suspension array
In our experiments, DSEPM were prepared by reversed-phase microemulsion UV curing method and layer-by-layer electrostatic self-assembly method. The fluorescence encoding channel (the first encoding channel) was realized by reversed-phase microemulsion UV curing method. With preprocessing, QDs could form a stable disperse phase with PEGDA, then the disperse phase was added into continuous phase drop by drop with stirring followed by UV curing. After collecting and screening, QDs encoded microbeads with specified sizes were disposed by layer-by-layer electrostatic self-assembly method to achieve the second encoding channel. In this step, PEI and PSS solutions were used to provide QDs encoded microbeads with appropriate surface electrical property. Then EENPs were added to obtain the final DSEPM. Next, with the modification of dopamine solution, bio-probes were grafted on the surface of DSEPM to capture analytes. After capturing target biomolecules, the DSEPM were then stimulated by 365 nm laser and 1064 nm laser pulse to achieve fluorescence emission spectra and laser induced breakdown spectra respectively, realizing the first channel decoding and the second channel decoding. Through fluorescence stimulation and LIBS stimulation, DSEPM can finally achieve qualitative analysis of the analyte. The entire encoding and decoding process is shown in Fig. 1.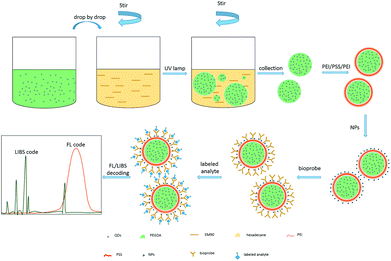 | ||
| Fig. 1 Schematic diagram of the encoding, decoding and detection process of dual-spectra encoded suspension array. | ||
Fabrication of QDs encoded PEGDA microbeads
To form a stable dispersion in PEGDA, the surface of the core–shell CdSe/ZnS QDs was modified with mPEG-SH. 5 mg of mPEG-SH and 1 mL of QDs solution were added to 3 mL of PEGDA solution, the mixture was stirred at room temperature for 12 h before use. Then 60 mg of photoinitiator was added to the modified QDs-PEGDA solution and sonicated for 10 minutes to form disperse phase; surfactants (EM90) was mixed with hexadecane in a volume ratio of 1![[thin space (1/6-em)]](https://www.rsc.org/images/entities/char_2009.gif) :
:![[thin space (1/6-em)]](https://www.rsc.org/images/entities/char_2009.gif) 2 to form 30 mL of continuous phase solution. After the disperse phase was added in continuous phase drop by drop under magnetic stirring, the mixture was cured for 30 minutes at room temperature under the ultraviolet light exposure. Then the mixture was transferred to a centrifuge tube and centrifuged under 4000 rpm for 5 minutes to remove the supernatant and obtained QDs encoded PEGDA microbeads. The resulting microbeads were washed three times with cyclohexane and ethanol respectively. Finally, QDs encoded PEGDA microbeads with diameters around 22 μm were obtained by screening with micron strainer.
2 to form 30 mL of continuous phase solution. After the disperse phase was added in continuous phase drop by drop under magnetic stirring, the mixture was cured for 30 minutes at room temperature under the ultraviolet light exposure. Then the mixture was transferred to a centrifuge tube and centrifuged under 4000 rpm for 5 minutes to remove the supernatant and obtained QDs encoded PEGDA microbeads. The resulting microbeads were washed three times with cyclohexane and ethanol respectively. Finally, QDs encoded PEGDA microbeads with diameters around 22 μm were obtained by screening with micron strainer.
Fabrication of DSEPM
Layer-by-layer electrostatic self-assembly method was used to achieve the second encoding channel. First, the synthesized QDs encoded PEGDA microbeads were dispersed in PEI solution (water, 4 mg mL−1, 0.5 M NaCl) and stirred for 1 h to provide the microbeads with a positive surface environment. After being washed with deionized water, the microbeads were redispersed in PSS (water, 2 mg mL−1, 0.5 M NaCl) and stirred for 1 h to provide a negative surface environment and washed with deionized water. The microbeads were then redispersed in 10 mL of deionized water and 20 mg of Cu2O NPs or Ag NPs preprocessed by PEI solution (water, 4 mg mL−1, 0.5 M NaCl) were added. After, the mixture was stirred for 1 h at room temperature and the products were washed with ethanol to obtain the final DSEPM. It is worth noting that due to the positive surface environment of MgO NPs, MgO NPs solution can directly react with the microbeads processed by PEI solution and PSS solution.Application of DSEPM in biomolecule detection
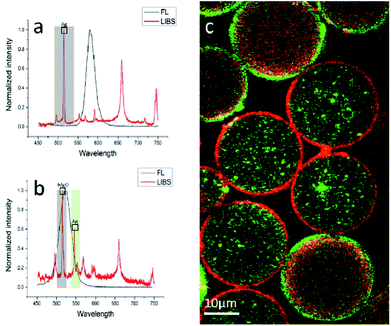
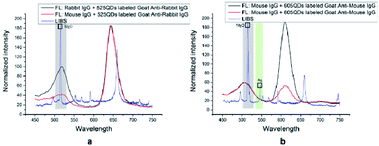
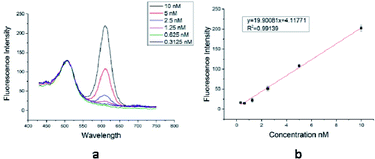
To prove the potential application of DSEPM in multiplex detection, a series of antigen–antibody binding experiments were carried out. Antigen–antibody binding experiments mainly consists of three steps: first, the surface of DSEPM were modified with dopamine. The dopamine layer can provide abundant active catechol and amino groups on the surface of the DSEPM for the further grafting of bio-probes. Dopamine was dissolved in Tris–HCl buffer solution (10 mM, pH = 8.5) at a concentration of 2 mg mL−1 10 mg of DSEPM were dispersed in 4 mL of dopamine solution and stirred for 20 h at room temperature, the resulting PDA-covered DSEPM (PDA@DSEPM) were washed with PBS solution (10 mM, pH = 7.4) several times for further use. Then IgG, the bio-probes, were grafted on the PDA@DSEPM. The PDA@DSEPM were suspended in 1 mL of PBS solution (20 mM, pH = 7.4) and stirred for 15 min at room temperature followed by the addition of 200 μL of IgG (1 mg mL−1) and 600 μL of EDC/NHS mixed solution, EDC and NHS were both 10 mg mL−1 in PBS. After incubating for 2 h at 37 °C with stirring, the IgG-conjugated beads were washed several times with PBS solution (10 mM, pH = 7.4) and then stored in 2 mL of no protein blocking solution overnight at 4 °C to cover the excess amino groups. Finally, the target anti-IgG was captured. The IgG-grafted PDA@DSEPM were wash again and dispersed in 1.5 mL of PBS solution. Then 10 μL of QDs-labeled anti-IgG solution was added into the microbeads suspension and stirred at 37 °C for 1 h. The final products were washed with PBS solution to remove excess QDs-labeled anti-IgG and redispersed in PBS solution for storage and further decoding.First, to demonstrate the multiplexed detection performance, adsorption experiments were carried out. Rabbit IgG-grafted D1 (encoded with 585 nm QDs and Ag NPs) and mouse IgG-grafted D2 (encoded with 525 nm QDs and MgO/Ag NPs) were mixed together to capture 525 nm QDs labeled goat anti-rabbit IgG and 605 nm QDs labeled goat anti-mouse IgG simultaneously. Then, the specific detection capacity of DSEPM were analyzed by contrast experiments: mouse IgG-grafted D3 (encoded with 645 nm QDs and MgO NPs) and rabbit IgG-grafted D3 (encoded with 645 nm QDs and MgO NPs) were used to capture 525 nm QDs labeled goat anti-rabbit IgG respectively, rabbit IgG-grafted D2 (encoded with 525 nm QDs and MgO/Ag NPs) and mouse IgG-grafted D2 (encoded with 525 nm QDs and MgO/Ag NPs) were used to capture 605 nm QDs labeled goat anti-mouse IgG respectively. Finally, we discussed the quantitative detection ability of DSEPM by concentration gradient experiments: six groups of 605 QDs-labeled goat anti-mouse IgG with different concentration (1 × 10⁻⁸, 5 × 10⁻⁹, 2.5 × 10⁻⁹, 1.25 × 10⁻⁹, 6.25 × 10⁻¹⁰, 3.125 × 10⁻¹⁰ M) were reacted with an equal amount of DSEPM respectively.
Results and discussion
Characterization of QDs encoded PEGDA microbeads
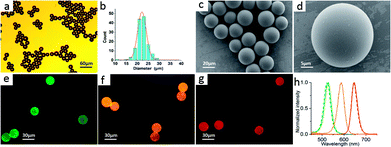
Through reverse-phase microemulsion UV curing method, a large amount of PEGDA microbeads can be prepared in a short time with simple steps and QDs with different kinds of characteristics, like sizes, colors and materials can be utilized. As shown in Fig. 2, Fig. 2a is the optical micrograph of the obtained PEGDA microbeads. Obviously, all the microbeads possess a complete spherical structure with a slight difference in sizes. 135 microbeads were measured and analyzed, and the size distribution diagram of the synthesized microbeads is shown in Fig. 2b. It can be concluded that the size distribution of the prepared microbeads are relatively uniform and the size is concentrated at 22 μm. Fig. 2(c and d) are SEM images of the PEGDA microbeads, indicating that the PEGDA microbeads have good homogeneity and monodispersity. Fig. 2(e–g) show the fluorescence images of microbeads encoded by QDs with different emission wavelengths (525 nm, 585 nm and 645 nm). It can be seen that the QDs are successfully encapsulated into the PEGDA microbeads and all the microbeads show a bright, uniform fluorescence. Meanwhile, the solid lines in Fig. 2h represent the fluorescence spectra of microbeads encoded by 525 nm, 585 nm and 645 nm QDs respectively. The dotted lines represent the fluorescence emission spectra of original QDs dispersed in n-hexane. Therefore, we can see that the bandwidth of the spectra is almost unchanged during the process of QDs doped into PEGDA microbeads through UV polymerization.Characterization of DSEPM
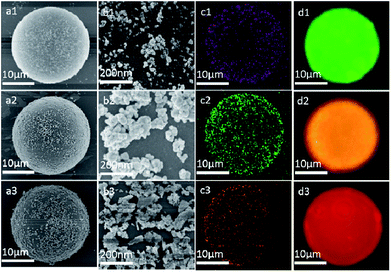
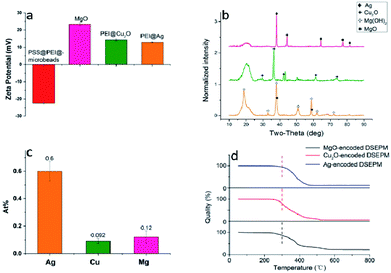
Several types of DSEPM were synthesized: P1 (encoded with 525 nm QDs and Cu2O NPs), P2 (encoded with 585 nm QDs and Ag NPs), and P3 (encoded with 645 nm QDs and MgO NPs). Various characterization methods, including SEM, EDS and fluorescence microscope imaging, were used to detect the synthesis performance of DSEPM, as shown in Fig. 3. First, Fig. 3(a1–a3) are the SEM images of DSEPM and Fig. 3(b1–b3) are the details of surface, the bright particles are the assembled EENPs. From the SEM images, we can easily observe the distribution of EENPs on the surface of DSEPM, morphologically verifying the assembling performance. Then, Fig. 3(c1–c3) show the EDS images of corresponding DSEPM. It is obvious that the encoding elements are uniformly covered on the surface of DSEPM. Further, the fluorescence micrographs of the DSEPM are shown in Fig. 3(d1–d3) respectively. From these images, it can be confirmed that the second operation of EENPs assembling would not affect the fluorescence encoding channel. To further prove the feasibility of layer-by-layer electrostatic self-assembly method, the surface zeta potential of reacted materials, including QDs-encoded microbeads after PEI and PSS decoration (PSS@PEI@microbeads), MgO NPs, PEI decorated Cu2O NPs (PEI@Cu2O), PEI decorated Ag NPs (PEI@Ag) were measured, the result is shown in Fig. 4a. It indicates that the final surface electricity of QDs-encoded microbeads and EENPs are opposite, which provides a theoretical basis for the assembly of EENPs. Fig. 4b contains three XRD spectra of Ag NPs, Cu2O NPs and MgO NPs encoded DSEPM respectively. The results show that all the three kinds of EENPs were successfully assembled on the microbeads. It is noted that the XRD spectrum of MgO NPs encoded DSEPM indicates the existences of MgO and Mg(OH)2, the chemical change of MgO to Mg(OH)2 during the process of assembly could be the reason. However, the change has no impact on the final result, owing to the fact that LIBS encoding relies on the existence of Mg element. Then the loading capacity of different kinds of EENPs, represented by the atomic content, was analysed by EDS. As shown in Fig. 4c, the counting of element contents of Ag, Cu and Mg verifies that each EENPs are successfully assembled on the microbeads. It is clear that Ag NPs have the largest loading capacity and the amounts of Cu2O NPs, MgO NPs assembled on the microbeads are similar. However, since the LIBS encoding is based on the locations of atomic peaks rather than the signal intensities, once the peaks could be detected, the amount of EENPs assembled on the microbeads almost has no effect on the encoding performance. Fig. 4d is the thermogravimetric analysis of Ag NPs, Cu2O NPs and MgO NPs encoded microbeads. It demonstrates that the prepared DSEPM begin to decomposition around 300 °C and leading to a decline in quality. Due to different types of coding EENPs, the final stable state is reached at different temperature and quality. However, it can be concluded that when the temperature rises to 600 °C, the quality of the tested three kinds of DSEPM will no longer change. The residues further illustrate the successful assembly of EENPs. In a word, Fig. 3 and 4 demonstrates that the layer-by-layer electrostatic self-assembly method can be an available and effective method to assemble EENPs on QDs-encoded microbeads to achieve second encoding channel.Decoding performance of DSEPM
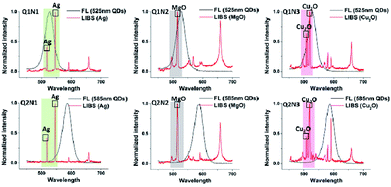
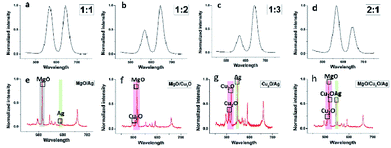
Utilizing 2 types of QDs (525 nm (Q1), 585 nm (Q2)) and 3 types of EENPs (Ag NPs (N1), MgO NPs (N2), Cu2O NPs (N3)), we synthesized 6 types of DSEPM Q1N1, Q1N2, Q1N3, Q2N1, Q2N2 and Q2N3. After the respective stimulation with 365 nm laser and 1064 nm pulse laser, the fluorescence spectra and laser induced breakdown spectra of Q1N1, Q1N2, Q1N3, Q2N1, Q2N2 and Q2N3 were collected and integrated into dual-spectra barcodes, the results are shown in Fig. 5. The black solid lines show the fluorescence spectra of QDS, the red solid lines show the whole laser induced breakdown spectra, including the chosen encoding peaks of EENPs in the colored grid and the back ground of basement. The obtained dual-spectra barcodes show that the dual-spectra encoding can be achieved with our method. Further, as shown in this Fig. 5, 2 types of fluorescence encoding spectra and 3 types of LIBS encoding spectra can achieve 6 types of barcodes. Thus, if there are M types of fluorescence spectra in the first channel and N types of laser induced breakdown spectra in the second channel, the number of dual-spectra barcodes will be M × N by simply combination, greatly expanding the encoding capacity.So far we have only explored the combinations of single type of QDs and single type of EENPs. In fact, by taking full advantages of the hybrid of multiple types of QDs and EENPs, it could be possible to obtain much more coding barcodes. Considering the fluorescence coding firstly, by doping different amount of QDs with different emission wavelengths into the PEGDA microbeads, we can generate a huge number of fluorescent barcodes. In this paper, relative intensities between different colors are used to encode by adjusting the QDs concentration. Through combining QDs of 565 nm and 645 nm and adjusting the concentration respectively, the multiple-QDs encoded PEGDA microbeads with relative intensity of 1![[thin space (1/6-em)]](https://www.rsc.org/images/entities/char_2009.gif) :
:![[thin space (1/6-em)]](https://www.rsc.org/images/entities/char_2009.gif) 1, 1
1, 1![[thin space (1/6-em)]](https://www.rsc.org/images/entities/char_2009.gif) :
:![[thin space (1/6-em)]](https://www.rsc.org/images/entities/char_2009.gif) 2, 1
2, 1![[thin space (1/6-em)]](https://www.rsc.org/images/entities/char_2009.gif) :
:![[thin space (1/6-em)]](https://www.rsc.org/images/entities/char_2009.gif) 3 and 2
3 and 2![[thin space (1/6-em)]](https://www.rsc.org/images/entities/char_2009.gif) :
:![[thin space (1/6-em)]](https://www.rsc.org/images/entities/char_2009.gif) 1 were successfully prepared. The fluorescence decoding spectra are shown in the Fig. 6(a–d). The results show that precise and distinct encoding signals are obtained. In the part of LIBS encoding, by permutation and combination, the theoretical number of barcodes can be obtained by the following formula:
1 were successfully prepared. The fluorescence decoding spectra are shown in the Fig. 6(a–d). The results show that precise and distinct encoding signals are obtained. In the part of LIBS encoding, by permutation and combination, the theoretical number of barcodes can be obtained by the following formula:
| w = c1n + c2n + ⋯ + cnn = 2n − 1 | (1) |
![[thin space (1/6-em)]](https://www.rsc.org/images/entities/char_2009.gif) :
:![[thin space (1/6-em)]](https://www.rsc.org/images/entities/char_2009.gif) 1, 1
1, 1![[thin space (1/6-em)]](https://www.rsc.org/images/entities/char_2009.gif) :
:![[thin space (1/6-em)]](https://www.rsc.org/images/entities/char_2009.gif) 2, 1
2, 1![[thin space (1/6-em)]](https://www.rsc.org/images/entities/char_2009.gif) :
:![[thin space (1/6-em)]](https://www.rsc.org/images/entities/char_2009.gif) 3 and 2
3 and 2![[thin space (1/6-em)]](https://www.rsc.org/images/entities/char_2009.gif) :
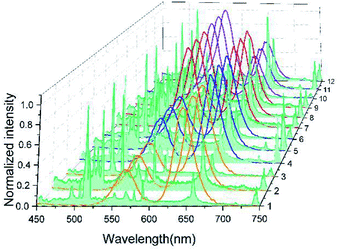
:![[thin space (1/6-em)]](https://www.rsc.org/images/entities/char_2009.gif) 1) which consisted of 2 types of QDs (565 nm (Q1) and 645 nm (Q2)) and 3 LIBS encoding signals (N1N2, N1N3, N1N3) from EENPs (Cu2O (N1), Ag (N2), MgO (N3)) were combined with each other to create 12 dual-spectra encoding barcodes. The results in Fig. 7 show the abundant encoding capacity. With the increase of encoding capacity, it is possible to detect more types of analytes in multiplexing. Besides, while the single channel encoding can satisfy the demand of detection throughput, the second encoding channel can provide a dual-recognition to suspension array, improving the stability of decoding. Furthermore, since the wavelength data of atomic emissions can be directly read out, which endows the LIBS encoding channel digital characteristics, so the effective analog-digital dual-spectra encoding of the suspension array is provided, thereby improving the accuracy and stability of decoding.
1) which consisted of 2 types of QDs (565 nm (Q1) and 645 nm (Q2)) and 3 LIBS encoding signals (N1N2, N1N3, N1N3) from EENPs (Cu2O (N1), Ag (N2), MgO (N3)) were combined with each other to create 12 dual-spectra encoding barcodes. The results in Fig. 7 show the abundant encoding capacity. With the increase of encoding capacity, it is possible to detect more types of analytes in multiplexing. Besides, while the single channel encoding can satisfy the demand of detection throughput, the second encoding channel can provide a dual-recognition to suspension array, improving the stability of decoding. Furthermore, since the wavelength data of atomic emissions can be directly read out, which endows the LIBS encoding channel digital characteristics, so the effective analog-digital dual-spectra encoding of the suspension array is provided, thereby improving the accuracy and stability of decoding.
Characterization of multiplexed biomolecule detection
Conclusion
In conclusion, dual-spectra encoded PEGDA microbeads (DSEPM) are successfully prepared by reversed-phase microemulsion UV curing method and layer-by-layer electrostatic self-assembly method, developing a new encoding method for suspension array. The advantages of the method presented in this paper can be summarized as follows: (1) the resulting DSEPM have stable shape, uniform size, the synthesize process is simple and high-yield; (2) the dual-spectra encoded method will increase the coding capacity in multiplicative model, providing more available barcodes for suspension array in multiplexed detection; (3) since there is no fluorescence interference from EENPs in the LIBS encoding channel, the dual-spectra encoding mode would not influence the fluorescence decoding and sensing performance; (4) the stability and digital features of LIBS highly promote the stability and accuracy of decoding. Finally, antigen–antibody adsorption experiments demonstrate the availability, specificity and quantitative analysis performance of dual-spectra encoded suspension array. It is well-founded to declare that the dual-spectra encoded suspension array prepared with our method have great potentials in high-throughput multiplex detection.Conflicts of interest
There are no conflicts to declare.Acknowledgements
This research was made possible with the financial support from National Science Foundation of China (NSFC) (61675113, 61527808, 81571837), Science and Technology Research Program of Shenzhen City (JCYJ20160428182247170, JCYJ20170412170255060, JCYJ20160324163759208, JCYJ20170412171856582).Notes and references
- R. Baron, B. Willner and I. Willner, Chem. Commun., 2007, 323–332 RSC.
- K. Braeckmans, S. C. De Smedt, C. Roelant, M. Leblans, R. Pauwels and J. Demeester, Nat. Mater., 2003, 2, 169 CrossRef PubMed.
- Y. Lu, J. Zhao, R. Zhang, Y. Liu, D. Liu, E. M. Goldys, X. Yang, P. Xi, A. Sunna and J. Lu, Nat. Photonics, 2014, 8, 32 CrossRef.
- D. C. Pregibon, M. Toner and P. S. Doyle, Science, 2007, 315, 1393–1396 CrossRef PubMed.
- R. Wilson, A. R. Cossins and D. G. Spiller, Angew. Chem., Int. Ed., 2006, 45, 6104–6117 CrossRef PubMed.
- S. Fodor, R. P. Rava, X. C. Huang, A. C. Pease, C. P. Holmes and C. L. Adams, Nature, 1993, 364, 555–556 CrossRef PubMed.
- M. Hartmann, J. Roeraade, D. Stoll, M. F. Templin and T. O. Joos, Anal. Bioanal. Chem., 2009, 393, 1407–1416 CrossRef PubMed.
- G. MacBeath and S. L. Schreiber, Science, 2000, 289, 1760–1763 Search PubMed.
- J. P. Nolan and L. A. Sklar, Trends Biotechnol., 2002, 20, 9–12 CrossRef PubMed.
- H. Shi, Z. Liu, X. Wang, J. Guo, L. Liu, L. Luo, J. Guo, H. Ma, S. Sun and Y. He, Sens. Actuators, B, 2013, 185, 91–96 CrossRef.
- L. Ao, F. Gao, B. Pan, R. He and D. Cui, Anal. Chem., 2006, 78, 1104–1106 CrossRef PubMed.
- X. Gao and S. Nie, Anal. Chem., 2004, 76, 2406–2410 CrossRef PubMed.
- B.-H. Jun, J.-H. Kim, H. Park, J.-S. Kim, K.-N. Yu, S.-M. Lee, H. Choi, S.-Y. Kwak, Y.-K. Kim and D. H. Jeong, J. Comb. Chem., 2007, 9, 237–244 CrossRef PubMed.
- B.-H. Jun, C. Rho, J.-W. Byun, J.-H. Kim, W.-J. Chung, H. Kang, J. Park, S.-h. Cho, B.-g. Kim and Y.-S. Lee, Anal. Biochem., 2010, 396, 313–315 CrossRef PubMed.
- J. Neng, M. H. Harpster, W. C. Wilson and P. A. Johnson, Biosens. Bioelectron., 2013, 41, 316–321 CrossRef PubMed.
- G. Wang, Y. Leng, H. Dou, L. Wang, W. Li, X. Wang, K. Sun, L. Shen, X. Yuan and J. Li, ACS Nano, 2012, 7, 471–481 CrossRef PubMed.
- Z. Zhang, Y. Long, J. Pan and X. Yan, J. Mater. Chem., 2010, 20, 1179–1185 RSC.
- J.-M. Nam, C. S. Thaxton and C. A. Mirkin, Science, 2003, 301, 1884–1886 CrossRef PubMed.
- Y. Leng, K. Sun, X. Chen and W. Li, Chem. Soc. Rev., 2015, 44, 5552–5595 RSC.
- A. Sukhanova and I. Nabiev, Crit. Rev. Oncol. Hematol., 2008, 68, 39–59 CrossRef PubMed.
- H. Liu, X. Qian, Z. Wu, R. Yang, S. Sun and H. Ma, J. Mater. Chem. B, 2016, 4, 482–488 RSC.
- M. D. Regulacio and M.-Y. Han, Acc. Chem. Res., 2010, 43, 621–630 CrossRef PubMed.
- R. Gill, M. Zayats and I. Willner, Angew. Chem., Int. Ed., 2008, 47, 7602–7625 CrossRef PubMed.
- F. Li, J. Wang, S. Sun, H. Wang, Z. Tang and G. Nie, Small, 2015, 11, 1954–1961 CrossRef PubMed.
- U. Resch-Genger, M. Grabolle, S. Cavaliere-Jaricot, R. Nitschke and T. Nann, Nat. Methods, 2008, 5, 763 CrossRef PubMed.
- J. Li, X.-W. Zhao, Y.-J. Zhao and Z.-Z. Gu, Chem. Commun., 2009, 2329–2331 RSC.
- T. Song, Q. Zhang, C. Lu, X. Gong, Q. Yang, Y. Li, J. Liu and J. Chang, J. Mater. Chem., 2011, 21, 2169–2177 RSC.
- S. Fournier-Bidoz, T. L. Jennings, J. M. Klostranec, W. Fung, A. Rhee, D. Li and W. C. Chan, Angew. Chem., 2008, 120, 5659–5663 CrossRef.
- N. Gaponik, I. L. Radtchenko, G. B. Sukhorukov, H. Weller and A. L. Rogach, Adv. Mater., 2002, 14, 879 CrossRef.
- H. Liu, G. Li, X. Sun, Y. He, S. Sun and H. Ma, RSC Adv., 2015, 5, 62706–62712 RSC.
- W. Sheng, S. Kim, J. Lee, S.-W. Kim, K. Jensen and M. G. Bawendi, Langmuir, 2006, 22, 3782–3790 CrossRef PubMed.
- E. De Boer, J. M. Warram, M. D. Tucker, Y. E. Hartman, L. S. Moore, J. S. De Jong, T. K. Chung, M. L. Korb, K. R. Zinn and G. M. Van Dam, Sci. Rep., 2015, 5, 10169 CrossRef PubMed.
- B. Kearton and Y. Mattley, Nat. Photonics, 2008, 2, 537 CrossRef.
- R. Noll, H. Bette, A. Brysch, M. Kraushaar, I. Mönch, L. Peter and V. Sturm, Spectrochim. Acta, Part B, 2001, 56, 637–649 CrossRef.
- S. Palanco and J. Laserna, J. Anal. At. Spectrom., 2000, 15, 1321–1327 RSC.
- V. Sturm, J. Vrenegor, R. Noll and M. Hemmerlin, J. Anal. At. Spectrom., 2004, 19, 451–456 RSC.
Footnote |
| † These authors contributed equally to this work and should be considered co-first authors. |
| This journal is © The Royal Society of Chemistry 2018 |

