DOI:
10.1039/C8RA03474E
(Paper)
RSC Adv., 2018,
8, 20669-20678
Ag-exchanged NaY zeolite introduced polyvinyl alcohol/polyacrylic acid mixed matrix membrane for pervaporation separation of water/isopropanol mixture
Received
23rd April 2018
, Accepted 31st May 2018
First published on 6th June 2018
Abstract
Ag-exchanged NaY zeolite (Ag-NaZ) particles were prepared by ion exchange and introduced to a polyvinyl alcohol (PVA) membrane cross-linked with polyacrylic acid (PAA) for the pervaporation dehydration of an isopropanol (IPA) aqueous mixture. The Ag-exchanged NaY zeolite particles were characterized by FE-SEM, EDS, BET, and XRD studies. The prepared Ag-NaZ-loaded PVA/PAA composite membrane was characterized by FE-SEM, XRD, a swelling study, and contact angle measurements. Pervaporation characteristics were investigated in terms of Ag-NaZ concentrations within PVA/PAA membranes using diverse feed solution conditions. The preferential sorption of IPA/water mixtures for Ag-NaZ-introduced membranes were also determined by calculating the apparent activation energies of IPA and water permeation, respectively. As a result, flux and selectivity increased with the Ag-NaZ concentration to 5 wt% in the membrane. Optimum pervaporation performance was observed in a 5 wt% Ag-NaZ-incorporated membrane with a flux equal to 0.084 kg m−2 h−1 and a separation factor of 2717.9 at 40 °C from an 80 wt% IPA aqueous feed solution.
1. Introduction
Isopropyl alcohol (IPA) is a commonly used chemical reagent due to its relatively high volatility and low toxicity. IPA is therefore commonly used as a solvent for a wide range of non-polar compounds, as an experimental preservative in the laboratory, and as a disinfectant in the medical industry by diluting in water.1,2 Due to these applications as well as countless others, many researchers have predicted that the demand for IPA will continue to increase in the future.
The IPA manufacturing process inherently requires the separation of IPA from water. However, IPA forms an azeotropic point with water at 87.4 wt% IPA and 80 °C; therefore, azeotropic distillation is necessary for obtaining highly purified IPA. This process requires tremendous amounts of energy and results in high CO2 emissions.3 Pervaporation (PV), on the other hand, has received global attention as an eco-friendly alternative to azeotropic distillation. It is energy-efficient with an excellent separation ratio, and is particularly effective at breaking down azeotropic mixtures. PV is even more flexible in process design and simpler in process control, thus making it superior for industrial-scale applications.4 Pervaporation is based on the solution diffusion model of mass transfer through a membrane. Therefore, liquids on the feed side vaporize and permeate the dense membrane due to a force that arises from the difference in chemical potential (e.g. concentration gradient).5 Therefore PV is a promising technology for the dehydration of IPA.
In recent years, numerous polymeric membranes have been developed6 and employed in IPA dehydration7–9 because of advantages such as lower costs, easier fabrication processes, and superior scalability. Polyvinyl alcohol is a hydrophilic polymer used in such membranes; because of its good chemical, thermal resistance, and film-forming properties,7–11 it has proven to be the most promising and consistent candidate in PV dehydration applications.
There are over 350 publications related to PV, and commercial membranes based on PVA are readily available for dehydration. The performance of PVA membranes, however, is still hindered by excessive swelling in water; therefore, various PVA modifications have been proposed. A few examples are crosslinking,12 blending with different polymers,7 heat treatment,13 and grafting.14 The available literature regarding these PVA modifications indicate that, in comparison to the crosslinking of PVA with small molecules like glutaraldehyde (or an inorganic material such as tetraethyl orthosilicate), the organic crosslinking of polymers like polyacrylic acid (PAA) results in remarkable PV performance in ethanol dehydration. However, its membrane selectivity for water is comparatively low.15 On the other hand, acetic acid/water pervaporation separation PAA–crosslinked PVA exhibited higher selectivity towards water with lower flux.16,17 Hence, this PV performance trade-off implies that homogeneous membranes prepared with polymer crosslinking have their limitations in permeation and selectivity.
Many scientists have successfully improved PV transport through PVA-based membranes with mixed matrix membranes, which involves physically mixing organic or inorganic fillers into the polymer matrix, e.g. carbon nanotube, zeolite, metal organic framework.18–21 Among them, zeolite has received the most attention and is regarded as a promising material for mixed matrix membranes. Zeolites are alumina-silicate inorganic materials with nano or microporous structures known as “molecular sieves”. Zeolites have been widely studied as a potential PV membrane material because of their unique pore structure, channels, and adsorption properties as well as good mechanical, chemical, and thermal stabilities. NaY zeolites have alumina-silicates with variable SiO2/AlO3 ratios (1.5–3.0), numerous sodium ions in their pores, and polycrystalline structures with well-defined nano-sized pores. Due to NaY zeolite having a higher Si/Al ratio than NaA zeolite, its hydrophilicity is lower and therefore, it shows better per-selectivity in alcohol/organic separation.22 However, NaA zeolite has already been used in the commercial dehydration of various alcohols.23 The zeolite framework consists of a tetrahedral framework of either silicon or aluminum atoms, connected to each other by sharing an oxygen atom, thus creating a secondary building unit with defined shapes like cubes or hexagonal prisms. These units are further assembled into large lattices by repeating identical building units. While forming the framework, each aluminum atom puts a negative charge on the framework (AlO4−), which is balanced by a metallic atom cation such as Na+, Ca+, Mg+, K+ or by a proton (H+). These cations are dynamic and can undergo ion exchange with other cations.24
It has been recently reported that silver nanoparticles embedded within the PVA membrane improve hydrophilicity and can therefore enhance PV performance for IPA dehydration.25 The possible reason for silver nanoparticle hydrophilicity is that it can release silver ions in aqueous phase by oxidizing, and silver ions can simultaneously be adsorbed on the silver nanoparticle surface in the formation of hydrated silver ions; additionally, it is more fascinated in acidic environment at low pH. Therefore, PVDF and PVA membranes with embedded silver nanoparticles immobilized in the presence of polyacrylic acid (PAA) were prepared, and showed improved surface hydrophilicity.26,27
The studies above prompted the modification of the NaY zeolite by exchanging the silver ion with a sodium ion and incorporating it into the PVA/PAA polymer membrane. The presence of acidic PAA promotes the hydrophilic mechanism for silver ions explained above, and further decreases hydrophilicity due to a higher Si/Al ratio in NaY zeolite, which will be compensated by hydrophilicity obtained from the Ag ion and offer a vintage for water transport through the zeolite pores. In this investigation, we have prepared Ag-exchanged NaY zeolite particles and incorporated them into the PVA/PAA crosslinked membrane with varying concentrations. The resulting particles and membranes were characterized by FE-SEM, EDS, PSA (particle size analysis), BET surface area analysis, FT-IR, and XRD to identify the structural variations associated with modification procedures. Finally, the PV separation of the water–IPA azeotropic mixture was performed by using the prepared membranes under a range of conditions.
2. Experimental
2.1 Materials
Poly(vinyl alcohol), with a molecular weight of 88![[thin space (1/6-em)]](https://www.rsc.org/images/entities/char_2009.gif) 000–97
000–97![[thin space (1/6-em)]](https://www.rsc.org/images/entities/char_2009.gif) 000 and a 98–99% degree of hydrolysis, was purchased from Alfa Aesar, a 35 wt% ready-made solution of poly(acrylic acid) (molecular weight (250
000 and a 98–99% degree of hydrolysis, was purchased from Alfa Aesar, a 35 wt% ready-made solution of poly(acrylic acid) (molecular weight (250![[thin space (1/6-em)]](https://www.rsc.org/images/entities/char_2009.gif) 000 g mol−1)), USA. NaY zeolite was purchased from Sigma Aldrich. Silver nitrate powder (99.9%) was purchased from Kojima Chemical Co., Ltd., Japan, and ammonium chloride and isopropyl alcohol (99.5 wt%) was obtained from Dae-Jung Chemicals & Metal Co, Korea. For PV experiments, the water/isopropyl alcohol mixtures were prepared in the laboratory by mixing a predetermined quantity of each (w/w).
000 g mol−1)), USA. NaY zeolite was purchased from Sigma Aldrich. Silver nitrate powder (99.9%) was purchased from Kojima Chemical Co., Ltd., Japan, and ammonium chloride and isopropyl alcohol (99.5 wt%) was obtained from Dae-Jung Chemicals & Metal Co, Korea. For PV experiments, the water/isopropyl alcohol mixtures were prepared in the laboratory by mixing a predetermined quantity of each (w/w).
2.1.1 Preparation of silver-exchanged zeolite particles. Silver (Ag)-exchanged zeolite particles were prepared by ion exchange and calcination. First, zeolite particles were placed in a beaker and 1 M ammonium chloride aqueous solution was added. Then, the mixture was stirred for 12 h to allow the exchange of Na+ ions and NH4+ ions. The resulting product was washed with deionized water several times and filtered. The filtered powder was then dried in an oven at 100 °C. The obtained powder comprising NH4+ ion-exchanged zeolite was calcinated at 450 °C, aiming to evaporate the NH3; thus, the hydrogen-exchanged zeolite (H-exchanged zeolite) was obtained. In order to prepare the Ag-exchanged zeolite, the H-exchanged zeolite (5 g L−1) was further treated in a beaker containing 1.37 × 10⁻³ M AgNO3 aqueous solution, followed by stirring for 12 h, washing with water, and drying the resultant Ag-exchanged zeolite (Ag-NaZ) in the oven at 100 °C. The zeolite was then transferred to a desiccator prior to use.
2.1.2 Preparation of the (Ag-NaZ) loaded PVA/PAA mixed matrix membranes. The Ag-NaZ-loaded mixed-matrix PVA/PAA membranes were prepared by dissolving PVA (5 g) powder into 95 g of water with continuous stirring at 80 °C for 6 h and filtering the resultant solution. The resultant solution was kept overnight to remove effervescence and air bubbles. A 35 wt% readymade solution of PAA was diluted with water to obtain a 5 wt% solution of PAA. Thereafter, both PVA/PAA solutions were mixed in a ratio of 75/25 and stirred for uniform mixing. The desired quantity of the resultant solution was cast onto a Petri dish and dried at 40 °C in an oven. The membrane was subsequently exfoliated from the Petri dish and crosslinked with heat treatment. This consisted of heating the membrane at 130 °C for 5.5 h, to thus obtain the membrane designated as AgNaZ-M0. In order to prepare the Ag-NaZ-loaded membrane, 2 g of Ag-NaZ was dispersed in 98 g of water and sonicated using Ultrasonicator (Branson Sonifier 450) at 20% duty cycle for 30 min in a separate beaker. Thereafter, 2.5, 5, 7.5, 10, and 12.5 g of the Ag-NaZ solutions were added dropwise to the above PVA/PAA (75/25, w/w) solution with constant stirring. A Ag-NaZ composite membrane was obtained by following the same membrane preparation procedure as AgNaZ-M0. The resulting membranes were designated as an AgNaZ-M1, AgNaZ-M2, AgNaZ-M3, AgNaZ-M4, and AgNaZ-M5. Similarly, the hydrogen form of the zeolite-loaded membrane was prepared for comparison. All the membranes had a thickness of approximately 50 μm and were preserved at 35 °C in a drying oven until use. The sample designations are described in Table 1.
Table 1 Abbreviations of PVA and PAA crosslinked and Ag-NaZ composite membranes
| Abbreviation |
Ratio in the membrane (g g−1) |
| PVA (polyvinyl alcohol) 5 wt% |
PAA (polyacrylic acid) 5 wt% |
Ag-modified zeolite (2 wt% dispersed solution) |
| AgNaZ-M0 |
75 |
25 |
0 |
| AgNaZ-M1 |
75 |
25 |
2.5 |
| AgNaZ-M2 |
75 |
25 |
5.0 |
| AgNaZ-M3 |
75 |
25 |
7.5 |
| AgNaZ-M4 |
75 |
25 |
10 |
| AgNaZ-M5 |
75 |
25 |
12.5 |
2.2 Characterization of silver-exchanged zeolite (Ag modified) particles
The surface morphology of Ag-NaZ was studied by SEM, and the element composition of the modified Ag-NaZ was evaluated by scanning electron microscopy with energy-dispersive X-ray spectroscopy (S-2700, Hitachi, Japan). An X-ray diffractogram pattern of the modified Ag-NaZ particles was also obtained (Rigaku Japan, D/Max 2500, λ = 1.5406, Cu Kα radiation at 45 kV and 15 mA). In order to measure the surface area of the unmodified and Ag-modified zeolite (Ag-NaZ) particles, surface area analysis was performed using the Brunauer–Emmett–Teller (BET) method with a Quanta chrome autosorb IQ.
2.3 Characterization of AgZ-M0 and Ag-NaZ composite membranes (MMM)
2.3.1 X-ray diffraction studies. In order to characterize the dispersion of Ag-NaZ in the membranes, X-ray diffractogram patterns were examined for AgNaZ-M0 and Ag-NaZ particle-loaded PVA/PAA composite membranes using an X-ray diffractometer (Rigaku Japan, D/Max 2500, λ = 1.5406, Cu Kα radiation at 45 kV and 15 mA). For identification of the crystal phase, dried membrane samples with uniform thickness were mounted on sample holders before recording the patterns in the range of 0–60 at a speed of 5° min−1.
2.3.2 Scanning electron microscopy study for membranes. The surface morphology of the AgNaZ-M0 and Ag-NaZ particle-loaded PVA/PAA composite membranes were examined by SEM. Images of the samples were obtained by scanning with a focused beam of electrons [Teskan, Czech, Vega II, and LSU]. Specimens for analysis were prepared by coating the samples with gold to make the film and particles more conductive.
2.3.3 Contact angle measurements. The static contact angles of water on AgNaZ-M1 and Ag-NaZ particle-loaded PVA/PAA composite membranes were measured using the sessile droplet method with the help of a contact angle analyzer (Phoenix 300, South Korea) equipped with a video camera. The contact angle of the water droplet was measured for each sample ten seconds after placing it onto the membrane. According to the shape of the droplet on the membrane, the corresponding contact angle was calculated with the precision and accuracy provided by the supplied software.
2.3.4 Swelling degree measurements. The dried membrane samples of AgNaZ-M1 and Ag-NaZ particle-loaded PVA/PAA composite membranes were weighed (md) and immersed in bottles containing 50 cm3 of different water/isopropanol mixtures for 48 h and at 40 °C. They were then removed from the solutions, wiped with dry tissue paper, and immediately weighed (ms). The degree of swelling was calculated using the following equation:| |
 | (1) |
where, ms and md are the mass of the swelled and dried membranes, respectively.
2.4 Pervaporation apparatus and measurements
The pervaporation (PV) experiments were carried out using the pervaporation apparatus designed in our previous article.28 The effective area of the membrane (19.64 cm2) was placed in the membrane cell, which consisted of two compartments. The first compartment was connected to a feed tank, and the other was connected to the downstream side (vacuum pump). The desired temperature (40 to 60 °C) of the feed tank was maintained by a thermostatically controlled water jacket. In order to avoid concentration polarizing, the feed mixture was continuously circulated using a pump (100 rpm) through the membrane cell. The downstream pressure was maintained at less than 10 mbar using a vacuum pump (Edwards, RV8). The test membrane was equilibrated for 1 h before the pervaporation experiment started with a circulating the feed mixture through the membrane cell at desired feed temperature. A cold liquefied nitrogen trap was used to collect the permeated solution. The feed mixture composition was varied from 10–30 wt% (azeotropic composition range) of isopropyl alcohol in water. The composition of the permeated solution was analyzed using gas chromatography with a TCD detector (DS Sci. DS7200). The separation performance of the prepared membrane was evaluated by measuring the flux (J) and separation factor (α)| |
 | (2) |
where PW, PI, FW, and FI are the weight fractions of water and IPA in the permeated solution and the feed solution, respectively. In addition, the flux was calculated by following equation:| |
 | (3) |
where Q is the weight of the permeated solution collected in the cold trap and the flux is calculated with respect to the effective area (A) in time t.
3. Result and discussion
3.1 Characterization of silver-exchanged zeolite (Ag modified) particles
FE-SEM analyses were used to investigate the particle morphology of Ag-modified particles. Fig. 1 displays the SEM micrograph for natural zeolites, H-form of zeolite, and Ag-exchanged zeolite particles. The particles range in size from the nano to micron (<5) scales. At higher magnification, the element compositions of natural zeolite, H-form zeolite, and Ag-exchanged zeolite were measured by SEM-EDS. The signals corresponding to electron excitation in the atoms due to the X-ray diffraction from the O, Na, Al, Si, Ag elements in the spectrum of Ag-exchanged zeolite confirm that modification occurred. Additionally, the atomic wt% for Na in the natural zeolite was decreased from 16.93 wt% to 6.87 wt% with the new element, Ag (5.08 wt%) in Ag-exchanged-zeolite observed (Table 2 and Fig. 1).
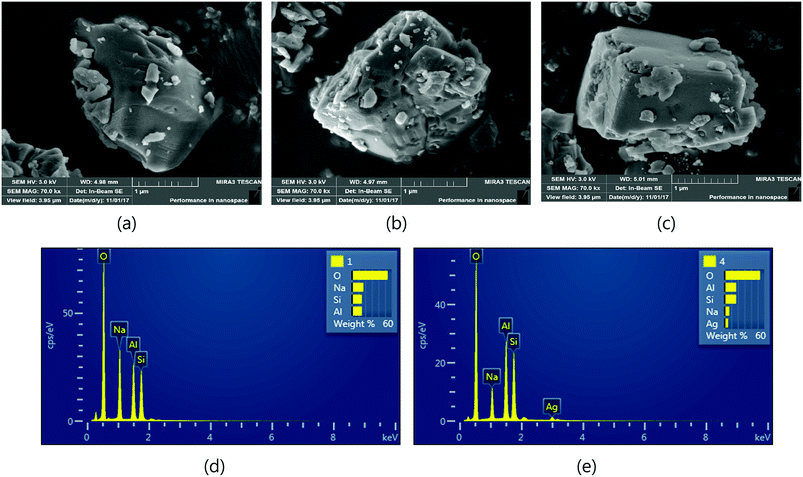 |
| | Fig. 1 SEM Micrographs for particle: (a) NaY zeolite (b) H-form zeolite (c) Ag-exchanged zeolite (d) EDS spectra for NaY zeolite (e) EDS spectra of Ag-NaZ. | |
Table 2 Element proportion obtained from the EDS analysis
| Element |
Element proportion (wt%) |
| NaY zeolite |
Ag exchanged zeolite |
| O |
53.85 |
53.54 |
| Na |
16.93 |
6.87 |
| Al |
14.56 |
17.25 |
| Si |
14.66 |
17.25 |
| Ag |
|
5.09 |
| Total |
100 |
100 |
The BET study for the natural zeolite, H-form zeolite, and Ag-exchanged zeolite (Ag-NaZ) was then performed. Table 3 shows the surface area calculated from the N2 adsorption on the surface and pore of the particle. Interestingly, the H-exchanged particles have a higher surface area than the natural zeolite; additionally, the surface area was found to decrease in Ag-exchanged zeolite as compared to either natural or H-form zeolite. The fluctuation in the surface area with the ions (Ag, H) might be due to the different atomic sizes for Ag, H, and Na. Increase in the BET surface with modification of the zeolite also reported in the literature.29 Moreover, it was also observed from the FE-SEM micrograph (Fig. 1) that the H-exchanged zeolite had a rougher surface than the Ag-NaZ and natural zeolite particles, which support this explanation. Fig. 2 presents the XRD pattern for natural zeolite (Na Y), H-exchanged zeolite, and Ag-modified zeolite particles. All XRD patterns show the same sharp diffraction peaks at the same position, suggest that the modification of zeolite by Ag and H does not change zeolite crystallinity. H and Ag atoms are evenly distributed on the surface of zeolite. Nevertheless, the intensity of the XRD peak in the modified zeolite was decreased, which may be due to the high-temperature removal of Al, resulting in shrinkage of the total zeolite framework because of the different Al–O and Si–O bond lengths. A similar result was reported for the modification of zeolite in the literature.30
Table 3 Variation of surface area with zeolite modification (BET study)
| Sample |
BET surface area (m2 g−1) |
| NaZ |
4.75 |
| HNaZ |
43.75 |
| AgNaZ |
4.18 |
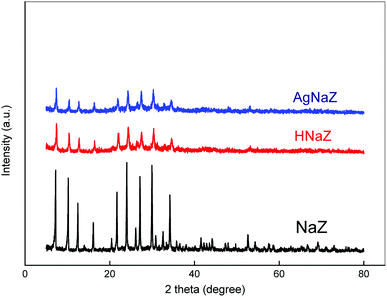 |
| | Fig. 2 XRD patterns for the natural, H-form, Ag-exchange zeolite particles. | |
3.2 Characterization of AgNaZ-M0 and Ag-NaZ composite membranes (MMM)
3.2.1 Results of XRD study. The solid state morphology of AgNaZ-M0 and Ag-NaZ loaded membrane were investigated by XRD analysis and obtained XRD patterns are depicted in Fig. 3. All the diffract gram in the figure shows the peak at 2θ = 20°, which is due to the semi crystalline domain of the PVA owing to the hydrogen bonding interaction in the membrane matrix.7 Furthermore, it was observed that the intensity of the same peak decreased slightly with the addition of Ag-NaZ particles in the membrane. This implies that the level of disorder in the polymer chain increases and amorphous region was created and hence the free volume increases too with the Ag-NaZ addition. It can further help in increasing the diffusion rate of permeants in PV separation.14 However, the peak that corresponds to the zeolite was not observed for lower Ag-NaZ concentrations, but some peaks corresponding to the zeolite were observed in AgNaZ-M3 and AgNaZ-M5. This implies that the Ag-NaZ particles were completely accommodated in the polymer matrix.
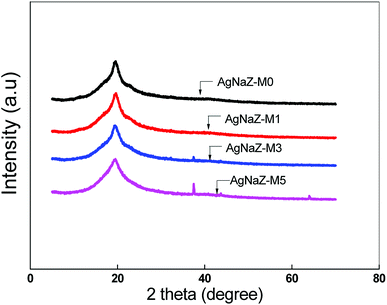 |
| | Fig. 3 XRD patterns for the AgNaZ-M0 and Ag-NaZ PVA/PAA composite membranes. | |
3.2.2 SEM analysis. Fig. 4 shows the surface and cross-sectional SEM images of the AgNaZ-M1, AgNaZ-M3, and AgNaZ-M5 membranes. The Ag-NaZ particles are well-accommodated in the polymer matrix, as seen from the cross-sectional images. AgNaZ particles are not visible at lower concentrations, but can be seen clearly in the AgNaZ-M5 membrane. Additionally, the particles (see, AgNaZ-M5) are in good contact with the polymer with no visible macroscopic void around the particles. Moreover, the particles are distributed evenly in the polymer matrix, which suggests that the membrane prepared in this study is defect-free and that PV performance can be boosted by the presence of Ag-NaZ particles inside. Nevertheless, the surface obtained with Ag-NaZ-M1 was no longer smooth; rather, it turned rough with the addition of Ag-NaZ particles (AgNaZ-M5). It is well-known that rough surfaces provide more surface area to provide the feed,8,31 and subsequently favor the adsorption of selective components from the feed mixture.
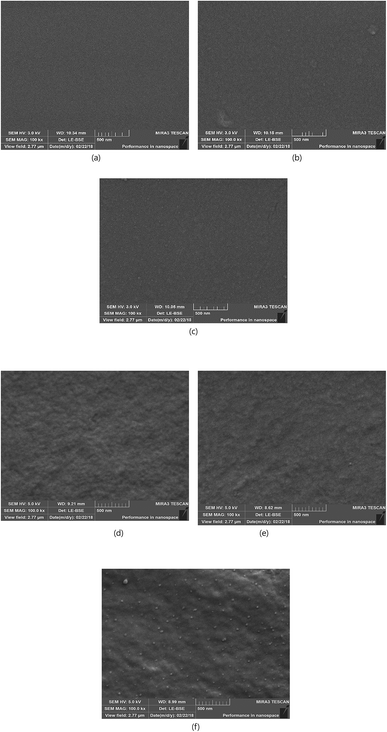 |
| | Fig. 4 Surface (a–c) and cross-sectional (d–f) SEM micrographs of membranes: (a and d) Ag-NaZ M1 (b and e) Ag-NaZ M3 (c and f) Ag-NaZ M5. | |
3.2.3 Swelling and contact angle measurements. It is well known that the free volume, degree of crosslinking, and morphology of the membrane determine the extent of its swelling in certain liquids.32 According to the solution diffusion model, the degree of swelling, which reflects the sorption capacity of a membrane (thermodynamic property), is directly influenced by the pervaporation transport mechanism.5 Fig. 5 shows the degree of swelling as well as the contact angle of the membrane as a function of the amount of Ag-NaZ particles in the composite membrane. As can be seen in Fig. 5, the degree of swelling constant over the content of Ag-NaZ particle in the membrane. On the other hand contact angle showed decreased in the trend with Ag-NaZ inclusion. Generally, in PVA based membranes as the crosslinking proceeds, hydrophilicity is depressed due to the condensation of the OH groups on the surface. The contact angle measurement is a measure of the surface hydrophilicity of membrane. Interestingly, the water contact angle on membrane surface decreased with Ag-NaZ loading in the membrane. There is no significant impact on the swelling and decreased in the contact angle is an uncommon phenomenon in PVA based membrane. This is because the increase in hydrophilic functionality, due to the Ag-NaZ particles, increases the affinity for water and hence decreases the contact angle at membrane surface. On the other hand, the degree of swelling, which is a bulk property, was static with Ag-NaZ loading, due to the amount of Ag-NaZ in the membrane comparatively very less which not could have enough to the make significant change on membrane swelling property, which is well supported by the SEM micrographs results obtained above.
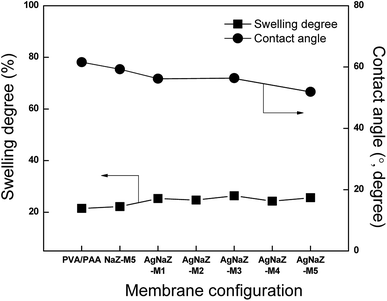 |
| | Fig. 5 Effect of different form of zeolite loading on the membrane swelling (feed composition, 80/20 IPA/water, at 40 °C) and contact angle of water droplet on the membrane surface. | |
3.3 Pervaporation
3.3.1 Effect of Ag-NaZ content on pervaporation performance. Fig. 6 displays the effect the Ag-modified zeolite on the pervaporation performance in terms of permeate flux and separation factor at 40 °C, 80 wt% IPA in the feed mixture, and applied pressure of less than 10 mbar. PV transport across the membrane was seen to be strongly influenced by the amount of zeolite in the PVA/PVA membrane. As the amount of the Ag-NaZ particles in the PVA/PAA membrane increased from 0 to 5 wt% the flux increased nearly threefold (0.03 to 0.084 kg m−2 h−1) and the separation factor also increased from 352 to 2718 (AgNaZ-M0 to AgNaZ-M5), as opposed to the case of a conventional polymer membrane system.1,9,16,28 In order to demonstrate the effect of the Ag-NaZ particles on the PV characteristics of the membranes, we plotted the Ag-NaZ particle content in the membranes as a function of the individual fluxes of IPA and water and the water content in the permeate (Fig. 7). From the figures, it was apparent that IPA permeation was inhibited by the presence of Ag-NaZ in the composite membrane. Besides, the water content in the permeate monotonously increased from 98.88 wt% for 0 wt% Ag-NaZ particles to 99.85 wt% for 5 wt% Ag-NaZ particles with an increase in the total flux (see Fig. 7). It is well known from the literature that the presence of zeolite in the membrane improves its hydrophilicity as observed from the contact angle measurement (Section 3.2.3) and molecular sieving action is established due to the porous nature of zeolite.19,33 On the other hand, the swelling degree of membrane not greatly affected by the presence of Ag-NaZ particles as explained (Section 3.2.3) above because the small content of Ag-NaZ did not change the bulk water uptake in the membrane. At higher IPA concentration in the feed (80 wt%), the increasing of hydrophilicity on the surface of the membrane due to the Ag-NaZ particles is significantly important for water sorption and later diffusion through membrane. Because Ag+ ion that balance the negative charge introduced by aluminum in the zeolite framework (AlO4−) increase the polarity and facilitate electrostatic attraction with the water molecules. Consequently, both higher flux and higher separation factor were obtained from the present Ag-NaZ loaded membrane.12 Similar observation was reported for the dehydration of ethylene glycol by pervaporation using the hydrophilic carbon nanotube loaded in the polyvinyl amine–polyvinyl alcohol membrane.34
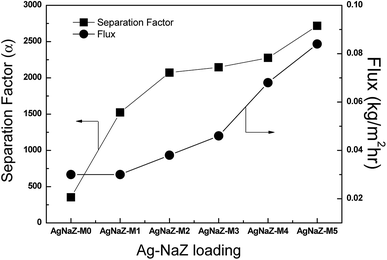 |
| | Fig. 6 Effect of zeolite loading on the pervaporation flux and separation factor (feed composition, 80/20 IPA/water, at 40 °C). | |
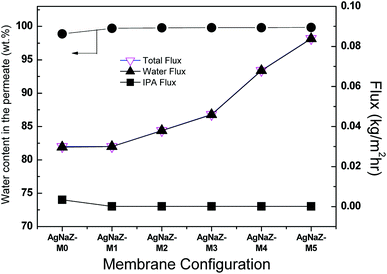 |
| | Fig. 7 Individual fluxes for water and IPA and water content in permeate as a function of Ag-NaZ loading in the membrane. | |
Nevertheless, it is necessary to compare the advantage of Ag-NaZ loaded membrane over the unmodified zeolite (NaZ only) loaded membrane in terms of the yield of PV separation for water/IPA mixtures. Fig. 8 shows the effect of different membrane configurations versus the flux and separation factor, respectively, for 80 wt% IPA in the feed, at 40 and 60 °C. The pervaporation output in the Ag-modified membrane is clearly improved over that observed for PVA/PAA and unmodified zeolite (NaZ), for the same level of zeolite loading. In addition, the zeolite-loaded membrane showed superior PV transport in comparison to the unloaded membrane, implying that at least some of the permeating molecules travel through the zeolite pores across the membrane. Therefore, the interaction of the permeants with both the surface and interior of the zeolite pores can significantly influence the PV transport. Huang et al. studied the effect of different forms of zeolites on the PV separation of an ethanol/water mixture and reported different PV yields. These results were attributed to features such as pore size, composition, and structure; further, these properties were responsible for the hydrophilicity/hydrophilicity and molecular sieving effect of the zeolites.35 It is well known that the molecular kinetic diameter of IPA (0.450 nm) is higher than that of water (0.296 nm).36 The NaY zeolite used in this study has a pore size of 0.4 nm, which is higher than that of the water molecule but lower than that of the IPA molecule; hence, the permeation of IPA is hindered by the membrane. As explained in the introduction section, upon the exchange of silver ions, the hydrophilicity of the zeolite particles increases.26,27 In addition, the ion exchange causes a local polarity in the pores without affecting the hydrophilicity.35 Moreover, the Na + radii (116 pm) is smaller comparison to the silver (129 pm) which may further decrease the pore size of the zeolite; this is well supported by the results of BET surface area analysis. Which resulted the easier PV transport for water molecule through the Ag-NaZ particle across the membrane by hindering the penetration of IPA molecule. The Ag-NaZ-loaded membranes showed higher PV dehydration of IPA compared to the NaZ and unloaded membranes. Since AgNaZ-M5 showed the highest PV performance among the analyzed Ag-NaZ composite membranes, the effect of operating conditions on PV transport was monitored using AgNaZ-M5.
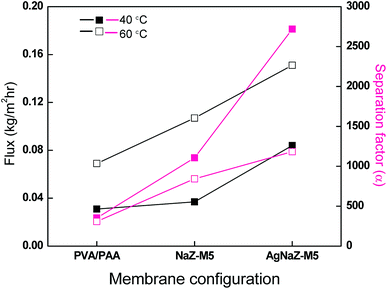 |
| | Fig. 8 Effect of different form of zeolite loading on the pervaporation flux and separation factor (feed composition, 80/20 IPA/water, at 40 °C and 60 °C). | |
3.4 Effects of operating conditions
3.4.1 Effect of temperature. The operating temperature (feed) significantly influences the PV operation, so it is important to evaluate how the membrane behavior under different temperature conditions. Fig. 9 shows the effect of temperature on the pervaporation properties of the AgNaZ-M5 membrane with 80 wt% IPA feed. As the feed temperature increased (from 40 to 60 °C), the flux increased, while the separation factor had no effect since the permeate concentration was higher than 99.5 wt% over the whole temperature range studied. The enhancement in the flux value could be attributed to the increase in the driving force and the free volume. According to the free volume theory, an increase in temperature leads to an increase in both the frequency and amplitude of polymer chain jumping (thermal agitation), and in turn, randomly creates a transition gap between polymeric chains, which is otherwise known as the free volume. Because of this random increase in free volume, rapid diffusion of permeants through the membrane occurs, resulting in an increase in flux. However, in this case, the free volume term can be removed because the polymer chains are rigid at the molecular level, and moreover, the glass transition temperatures for the membranes are greater than the operating temperature. However, an increase in feed temperature could result in earlier phase transition of the permeants inside the membrane, as the enthalpy of transition is rapidly achieved when more heat is provided; consequently, diffusion, and hence, mass transfer across the membrane are faster. The membrane produced in this study is dense and compact, and the molecular kinetic diameter of IPA (0.450 nm) is higher than that of water (0.296 nm).35 Additionally, the zeolite increases the thermal stability of the membrane, whereby the effect of thermal agitation on the driving force can be omitted. Hence, the separation factor does not significantly decrease over the temperature range studied (2717.9 to 1183). A similar trend has been reported in several studies.25,35,36
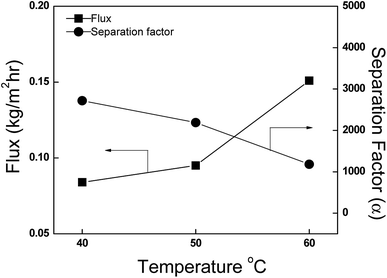 |
| | Fig. 9 Effect of temperature on the pervaporation flux and separation factor. Feed composition: 80% IPA, AgNaZ-M5. | |
The temperature dependence of the permeation flux can be expressed by an Arrhenius-type equation, which can be used to calculate the activation energy for permeation through the membrane.
where
Ap and
Ep are the pre-exponential factor and the overall activation energy for permeation, respectively. A logarithmic Arrhenius plot of flux against temperature was plotted for each of the components of the mixture, as shown in
Fig. 10. From the slope of the resulting plot, the activation energy for the permeation of both IPA and water was calculated. The activation energy for the permeation of IPA (60.59 kJ mol
−1) was higher than that for water (25.19 kJ mol
−1), which reflected that the adsorption and diffusive transport of IPA was hindered with respect to water across the Ag-NaZ-M5 membrane.
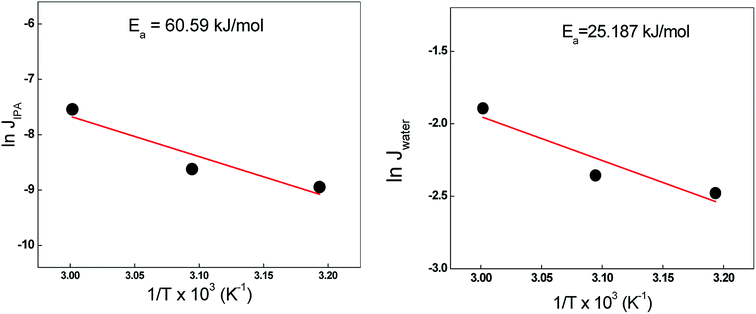 |
| | Fig. 10 Variation of ln![[thin space (1/6-em)]](https://www.rsc.org/images/entities/char_2009.gif) JWater and ln JWater and ln![[thin space (1/6-em)]](https://www.rsc.org/images/entities/char_2009.gif) JIPA with temperature for AgNaZ-M5 membrane, Feed: 80% IPA solution. JIPA with temperature for AgNaZ-M5 membrane, Feed: 80% IPA solution. | |
3.4.2 Effect of feed concentration. Fig. 11 shows the effect of feed concentration on the flux and separation factor for IPA over the feed range 10 to 30 wt% water at 40 °C with AgNaZ-M5. The total flux increased almost 10-fold from 0.018 kg m−2 h−1 to 0.195 kg m−2 h−1, which was attributed to the hydrophilicity of the membrane and the increased driving force of water resulting from the higher concentration of water in the feed. The figure also shows that the separation factor decreases with increasing water feed composition (5184.1 to 668.4). The AgNaZ-M5 membrane prepared in this study is highly hydrophilic and water selective, since the Ag-NaZ particles increase the surface hydrophilicity of the membrane, as observed in contact angle measurements. As a higher water content in the feed leads to increased interaction between water and the upstream side of the membrane, swelling occurs on the upstream side and membrane plasticization occurs. This plasticization is a result of adsorbed water, and along with the increased associated molecules of water and IPA, leads to a decrease in the separation factor.8,9,35,37 However, as the separation factor is a sensitive term, even small discrepancies in the permeate concentration might cause large differences in the selectivity. It was observed that the percentage of water in the permeate was always higher than 99.5% at any feed concentration. This might be because the Ag-NaZ particles are well accommodated in the polymer matrix, leading to molecule sieving action; further, the electrostatic attraction between Ag+ and Na+ in the zeolite cage with water hinders the diffusion of adsorbed IPA and associated molecules across the membrane during PV transportation.
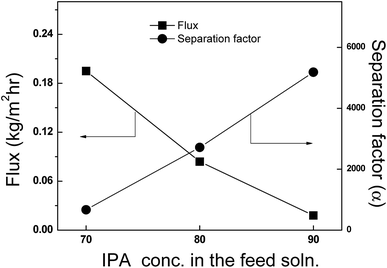 |
| | Fig. 11 Effect of feed on the pervaporation flux and separation factor. Temperature: 40 °C, for AgNaZ-M5 membrane. | |
3.5 Comparison of PV performance with data reported recently in the literature
Table 4 shows the comparison of pervaporation performance between optimized AgNaZ-M5 membrane and recently studied membrane systems in the literature for IPA dehydration. In Table 4, the present Ag-NaZ-M5 membrane showed remarkable separation factor in comparison to the results of other studies. On the other hands, flux was relatively moderate compare to other membranes.7,18,33,37 Membrane thickness of present study is 50 μm and higher flux with marginally decreased in the separation factor can be obtained by decreasing the membrane thickness according to the solution diffusion model5 and Fick's law of diffusion. Fabrication of composite membrane by applying thin layer of AgNaZ-M5 membrane on porous support is feasible. In future research, the attempt will made for enhancing the membrane efficacy by applied to the hollow fiber or suitable supporter for preparation of composite membrane.
Table 4 Comparison for the performance of AgNaZ-M5 with data reported recently in the literature
| Polymer |
Nature of the membrane preparation method |
Feed (%) composition, (w/w) isopropyl alcohol/water |
Temperature (°C) |
Flux (J) (kg m−2 h−1) |
Separation factor (α) |
Thickness (μ) |
Reference |
| PVA/PVAm |
Blend membrane |
80/20 |
60 |
0.28 |
297 |
70 |
7 |
| PVA |
PVA-PNIPAAm grafting |
12/88 |
40 |
0.011 |
95 |
90 |
17 |
| PVA |
PVA/MWNT |
90/10 |
30 |
0.168 |
882 |
18 |
18 |
| P84 |
ZIF-90 incorporation |
85/15 |
60 |
0.109 |
5668 |
19–22 |
33 |
| Chitosan |
Surface modification of chitosan with PBI |
80/20 |
25 |
0.15 |
221 |
40 |
38 |
| PVA |
Ag-modified zeolite incorporation (AgNaZ-M5) |
80/20 |
40 |
0.084 |
2718 |
50 |
Present study |
| PVA |
Ag-modified zeolite incorporation (AgNaZ-M5) |
90/10 |
40 |
0.018 |
5184 |
50 |
Present study |
4. Conclusion
In this study, we attempted to prepare Ag-NaZ particles by the modification of zeolite by exchanging Ag+ with Na+ ions. Subsequently, MMM was prepared by incorporating Ag-NaZ in the PVA/PAA polymer matrix. The modification of the zeolite was confirmed by SEM-EDS analysis. Particle size measurements indicated no significant change in the particle size of the zeolite after exchanging Na+ ions with Ag+ ions. BET measurements indicated that the surface area of Ag-NaZ was smaller than that of the H-form zeolite and natural zeolite, because of atomic size of Ag+, Na+, and H+ ions. The XRD peaks for the Ag-NaZ particles was concordant with those of the H-form and natural zeolites and having decreased in the peak intensity suggested that on the modification, zeolite crystallinity not affected greatly. From SEM and XRD analysis, uniform dispersion of the Ag-NaZ particles and an increase in the amorphous region of the polymer matrix were confirmed. The hydrophilicity of the membrane increased with increased Ag-NaZ loading, as revealed by contact angle measurements; however, no considerable change in the degree of swelling was observed. The PV performance of Ag-NaZ, H-form zeolite, and natural zeolite loaded membranes were evaluated in terms of the flux and separation factor under various operating conditions. The Ag-NaZ loaded membrane showed superior performance among all the loaded and unloaded membranes. As AgNaZ-M5 membrane was extremely hydrophilic, with the highest PV yield, and the flux increased from 0.02 to 0.20; on other hand, the separation factor was optimized in the range 668 to 5184 for 10 to 30 wt% of water feed content at 40 °C. The activation energy for permeation was calculated from the temperature dependence of IPA and water flux through AgNaZ-M5; permeation (25.19 kJ mol−1) of water was observed to be easier compared with that of IPA (60.59 kJ mol−1).
Conflicts of interest
There are no conflicts to declare.
Acknowledgements
This work was supported by the New & Renewable Energy Core Technology Program of the Korea Institute of Energy Technology Evaluation and Planning (KETEP) and the financial resources granted by the Ministry of Trade, Industry & Energy of the Republic of Korea (No. 20172010106170).
Reference
- Q. G. Zhang, Q. L. Liu, Y. Chen and J. H. Chen, Ind. Eng. Chem. Res., 2007, 46, 913 CrossRef.
- P. Salehian, M. L. Chua, M. Askari, G. M. Shi and T. S. Chung, J. Membr. Sci., 2015, 493, 299 CrossRef.
- L. M. Vane, Biofuels, Bioprod. Biorefin., 2008, 2, 553 CrossRef.
- C. Abels, F. Carstensen and M. Wessling, J. Membr. Sci., 2013, 444, 285 CrossRef.
- J. G. Wiljmans and R. W. Baker, The solution diffusion model: a review, J. Membr. Sci., 1995, 107, 1 CrossRef.
- Y. Ong, G. Shi, N. Le, Y. Tang, J. Zuo, S. Nunes and T. S. Chung, Prog. Polym. Sci., 2016, 57, 1 CrossRef.
- S. Chaudhari, Y. Kwon, M. Moon, M. Shon, S. Nam and Y. Park, J. Appl. Polym. Sci., 2017, 134, 45572 CrossRef.
- S. Chaudhari, Y. Kwon, M. Moon, M. Shon, S. Nam and Y. Park, Vacuum, 2018, 147, 115 CrossRef.
- F. Kursun and N. Isiklan, J. Ind. Eng. Chem., 2016, 41, 91 CrossRef.
- K. Halake, M. Birajdar, B. S. Kim, H. Bae, C. Lee, Y. J. Kim, S. Kim, H. Kim, S. Ahn, S. An and J. Lee, J. Ind. Eng. Chem., 2014, 20, 3913 CrossRef.
- P. D. Chapman, T. Olivera, A. G. Livingston and K. Li, J. Membr. Sci., 2008, 318, 5 CrossRef.
- H. G. Premakshi, K. Ramesh and M. Y. Kariduraganavar, Chem. Eng. Res. Des., 2015, 94, 32 CrossRef.
- Z. Xie, M. Hoang, D. Ng, C. Doherty, A. Hill and S. Gray, Sep. Purif. Technol., 2014, 127, 10 CrossRef.
- A. Sajjan, H. G. Premakshi and M. Y. Kariduraganavar, J. Ind. Eng. Chem., 2015, 25, 151 CrossRef.
- B. Bolto, M. Hoang and Z. Xie, Chem. Eng. Process., 2011, 50, 227 CrossRef.
- G. Asman and O. Sanli, Sep. Sci. Technol., 2006, 41, 1193 CrossRef.
- J. W. Rhim, S. W. Yeom, S. W. Kim and K. H. Lee, J. Appl. Polym. Sci., 1997, 63, 521 CrossRef.
- M. Amirilargani, M. A. Tofighy, T. Mohammadi and B. Sadatnia, Ind. Eng. Chem. Res., 2014, 53, 12819 CrossRef.
- A. Malekpour, B. Mostajeran and G. A. Koohmareh, Chem. Eng. Process., 2017, 118, 47 CrossRef.
- G. Wu, M. Jiang, T. Zhang and Z. Jia, J. Membr. Sci., 2016, 507, 72 CrossRef.
- E. J. Flynn, D. A. Keane, P. M. Tabari and M. A. Morris, Sep. Purif. Technol., 2013, 118, 73 CrossRef.
- Z. Wang, I. Kumakiri, K. Tanaka, X. Chen and H. Kita, Microporous Mesoporous Mater., 2013, 182, 250 CrossRef.
- Y. Morigami, M. Kondo, J. Abe, H. Kita and K. Okamoto, Sep. Purif. Technol., 2001, 25, 251 CrossRef.
- H. Lim, J. Jung, D. Kim, D. Lee, S. Lee and W. Kim, Mater. Sci. Forum, 2006, 510–511, 934 CrossRef.
- F. Premakshi, A. Sajjan, A. Kittur and M. Kariduraganavar, J. Appl. Polym. Sci., 2015, 132, 41248 CrossRef.
- S. Chaudhari, Y. Kwon, M. Moon, M. Shon, S. Nam and Y. Park, Bull. Korean Chem. Soc., 2016, 37, 1985 CrossRef.
- J. Li, X. Shao, Q. Zhou, M. Li and Q. Zhang, Appl. Surf. Sci., 2013, 265, 663 CrossRef.
- S. Chaudhari, Y. Kwon, M. Moon and M. Y. Shon, Bull. Korean Chem. Soc., 2015, 36–10, 2534 CrossRef.
- J. Rizkiana, G. Guan, W. Widayanto, J. Yang, X. Hao, K. Motsuoka and A. Abudula, RSC Adv., 2016, 6, 2096 RSC.
- W. Lutz, A review, Adv. Mater. Sci. Eng., 2014, 2014, 724248 CrossRef.
- Q. G. Zhang, Q. L. Liu, F. F. Shi and Y. Xiong, J. Mater. Chem., 2008, 18, 4646 RSC.
- P. J. Flory and J. Rehner, J. Chem. Phys., 1943, 11, 521 CrossRef.
- D. Hua, Y. Ong, Y. Wang, T. Yang and T. Chung, J. Membr. Sci., 2013, 453, 155 CrossRef.
- S. Y. Hu, Y. Zhang, D. Lawless and X. Feng, J. Membr. Sci., 2012, 417–418, 34 CrossRef.
- Z. Huang, H. Guan, W. Tan, X. Qio and S. Kulprathipanja, J. Membr. Sci., 2006, 276, 260 CrossRef.
- S. Kuila and S. Ray, Chem. Eng. Res. Des., 2013, 91, 377 CrossRef.
- T. Khosravi, S. Mosleh, O. Bakhtiari and T. Mohammadi, Chem. Eng. Res. Des., 2012, 90, 2353 CrossRef.
- Y. J. Han, K. H. Wang, J. Y. Lai and Y. L. Liu, J. Membr. Sci., 2014, 463, 17 CrossRef.
|
| This journal is © The Royal Society of Chemistry 2018 |
Click here to see how this site uses Cookies. View our privacy policy here.  Open Access Article
 *a,
YouIn Parkb and
SeungEun Namb
![[thin space (1/6-em)]](https://www.rsc.org/images/entities/char_2009.gif) 000–97
000–97![[thin space (1/6-em)]](https://www.rsc.org/images/entities/char_2009.gif) 000 and a 98–99% degree of hydrolysis, was purchased from Alfa Aesar, a 35 wt% ready-made solution of poly(acrylic acid) (molecular weight (250
000 and a 98–99% degree of hydrolysis, was purchased from Alfa Aesar, a 35 wt% ready-made solution of poly(acrylic acid) (molecular weight (250![[thin space (1/6-em)]](https://www.rsc.org/images/entities/char_2009.gif) 000 g mol−1)), USA. NaY zeolite was purchased from Sigma Aldrich. Silver nitrate powder (99.9%) was purchased from Kojima Chemical Co., Ltd., Japan, and ammonium chloride and isopropyl alcohol (99.5 wt%) was obtained from Dae-Jung Chemicals & Metal Co, Korea. For PV experiments, the water/isopropyl alcohol mixtures were prepared in the laboratory by mixing a predetermined quantity of each (w/w).
000 g mol−1)), USA. NaY zeolite was purchased from Sigma Aldrich. Silver nitrate powder (99.9%) was purchased from Kojima Chemical Co., Ltd., Japan, and ammonium chloride and isopropyl alcohol (99.5 wt%) was obtained from Dae-Jung Chemicals & Metal Co, Korea. For PV experiments, the water/isopropyl alcohol mixtures were prepared in the laboratory by mixing a predetermined quantity of each (w/w).


