
 Open Access Article
 This Open Access Article is licensed under a Creative Commons Attribution-Non Commercial 3.0 Unported Licence
Purification and identification of antioxidative peptides from mackerel (Pneumatophorus japonicus) protein
Xueqin Wang abc,
Huahua Yuabc,
Ronge Xingabc,
Xiaolin Chenabc,
Rongfeng Liabc,
Kecheng Liabc,
Song Liuabc and
Pengcheng Li*abc
abc,
Huahua Yuabc,
Ronge Xingabc,
Xiaolin Chenabc,
Rongfeng Liabc,
Kecheng Liabc,
Song Liuabc and
Pengcheng Li*abc
aCAS Key Laboratory of Experimental Marine Biology, Institute of Oceanology, Chinese Academy of Sciences, No. 7, Nanhai Road, Qingdao 266071, China. E-mail: pcli@qdio.ac.cn; Fax: +86 532 82968951; Tel: +86 532 82898707
bLaboratory for Marine Drugs and Bioproducts, Qingdao National Laboratory for Marine Science and Technology, No. 1, Wenhai Road, Qingdao 266237, China
cCenter for Ocean Mega-Science, Chinese Academy of Sciences, China
First published on 5th June 2018
Abstract
This study reports the preparation, purification and identification of an antioxidative peptide from mackerel (Pneumatophorus japonicus) protein. Neutrase was chosen as the optimum protease, with the highest cellular antioxidant activity of 53.65%. The optimal hydrolysate conditions for mackerel protein hydrolysates (MPH) according to response surface methodology were an enzyme concentration of 1203.2 U g−1, extraction time of 4.53 h, pH of 7.26, water/material ratio of 5.22 v/w and extraction temperature of 43.72 °C. MPH was separated using ultrafiltration membranes, and the fraction MPH-III with molecular weight below 3500 Da showed the highest cellular antioxidant activity. Five fractions were separated from MPH-III on a Sephadex G-25 column, and MPH-III-2, exhibiting the highest cellular antioxidant activity, was further separated with an XBridge® peptide BEH C18 column. The MPH-III-2-6 separated from RP-HPLC was further analysed by Thermo Scientific Q Exactive mass spectrometer, and the heptapeptide LDIQKEV (843.5 Da) and the octapeptide TAAIVNTA (759.4 Da) were identified. The results of this study offer a promising alternative to produce natural antioxidative peptides from fish protein hydrolysate, which may be utilized as functional ingredients in food systems.
1. Introduction
Oxidative damage has been implicated in ageing and many human diseases and disorders, including cancer, cardiovascular disease (especially atherosclerosis), diabetes and chronic inflammatory diseases.1 It has been suggested that sufficient amounts of antioxidants must be consumed to prevent oxidative stress caused by free radicals. In recent years, many studies have been conducted to find potent radical scavengers to protect against oxidative stress.2,3 Numerous antioxidant compounds, particularly fish peptides, have been widely studied, and potent antioxidant peptides have been isolated from the muscle of such fish as salmon (Salmo salar),4 skipjack tuna (Katsuwonus pelamis),5 sardine (S. pilchardus)6 and cod (Gadus morhua).7The antioxidant properties of fish protein hydrolysates have been studied for a wide range of species and enzymes.8 The antioxidant activities of the hydrolysates were affected by the protein source and the hydrolysis conditions (e.g., enzyme concentration, pH, extraction temperature, extraction time, water/material ratio), since these factors determine the peptide profile that is essentially responsible for any antioxidant and functional activities.9 Hence, it is important to choose the appropriate conditions during hydrolysis.
Mackerel (Pneumatophorus japonicus) is an important food-stuff that is consumed worldwide.10 It is low-cost and has high productivity; thus, there have been many studies of the processing and utilization of mackerel in recent years, including the pretreatment and benefits of mackerel,11 antiproliferative activity,12 anti-hypertensive activity,13 and antimicrobial activity14 of mackerel. In addition, several researchers have focused on the antioxidant activity of mackerel and showed that mackerel could be used as a good source of antioxidant peptides.15
Additionally, antioxidant activity is closely related to amino acid composition and the sequence, molecular weight and configuration of peptides.16 Hence, the purification of the mackerel peptide should be explored. Although Sampath Kumar et al.17 purified and identified the constituent amino acids of horse mackerel (Magalaspis cordyla) skin protein hydrolysate, the isolation of peptides from mackerel (Pneumatophorus japonicus) muscle protein has not been thoroughly elucidated to date. Therefore, the objectives of this study were to prepare mackerel (Pneumatophorus japonicus) muscle protein hydrolysates, evaluate their cellular antioxidant activity and further purify and identify the antioxidant peptides.
2. Material and methods
2.1 Materials and chemicals
Fresh mackerel (Pneumatophorus japonicus), 210–260 g per fish, were purchased from a seafood market in Qingdao, China. Whole fish were transported on ice to reduce histamine production. Upon arrival, the fish were washed and the muscle (without head, tail, skin, bones and blood) was collected, sliced, minced and stored in plastic bags at −20 °C until use. Five proteases (pepsin, trypsin, papain, flavourzyme and neutrase) were provided by Kangbaotai Co. (Hubei, China). Both 1,1-diphenyl-2-picrylhydrazyl (DPPH) and trifluoroacetic acid (TFA) were purchased from the Sigma Chemical Co. (St Louis, MO, USA). The ultrafiltration (UF) system and UF membranes with molecular weight cut-offs (MWCO) of 10![[thin space (1/6-em)]](https://www.rsc.org/images/entities/char_2009.gif) 000 Da and 3500 Da were purchased from the Laungy Co., Ltd. (Shanghai, China). The fraction collector and computer ultraviolet (UV) detector were purchased from the Shanghai huxi Analysis Instrument Factory Co., Ltd. (Shanghai, China). The human hepatoma cell line HepG2 was obtained from Qingdao University (Shandong, China). The growth medium and antibiotics for cell culture experiments were purchased from HyClone, USA. Foetal bovine serum (FBS), used in cell culturing, was purchased from Gibco, Australia. The water was distilled and purified using a Milli-Q Water Purification System (Millipore, Bedford, MA, USA). All other chemicals and solvents were of analytical grade.
000 Da and 3500 Da were purchased from the Laungy Co., Ltd. (Shanghai, China). The fraction collector and computer ultraviolet (UV) detector were purchased from the Shanghai huxi Analysis Instrument Factory Co., Ltd. (Shanghai, China). The human hepatoma cell line HepG2 was obtained from Qingdao University (Shandong, China). The growth medium and antibiotics for cell culture experiments were purchased from HyClone, USA. Foetal bovine serum (FBS), used in cell culturing, was purchased from Gibco, Australia. The water was distilled and purified using a Milli-Q Water Purification System (Millipore, Bedford, MA, USA). All other chemicals and solvents were of analytical grade.
2.2 Preparation of mackerel protein hydrolysates (MPH)
The antioxidant capacity of protein hydrolysates was mainly determined according to the raw material and the extent of enzymatic treatment.18 In this section, five proteases, pepsin, trypsin, papain, flavourzyme and neutrase, were used to determine the optimal enzyme. Minced mackerel was mixed with deionized water at a ratio of 1:10 v/w. The mixtures were adjusted to the required pH with 0.01 mol L−1 NaOH or HCl and heated in a water bath to the required temperature before proteases were added in a proper proportion based on enzyme activity. The hydrolysis reactions were performed in a shaking incubator. At the end of the hydrolysis period, the mixtures were heated in boiling water for 10 min to inactivate the proteases. Next, the hydrolysates were centrifuged at 18000 × g (4 °C) for 30 min and the supernatants were stored at 4 °C before use. Among the five hydrolysates, the one with the highest cellular antioxidant activity was chosen for further optimization according to a BBD using response surface methodology (RSM).
2.3 Optimization of MPH preparative conditions
Extraction optimization in generally was performed using RSM.19 In this section, five major factors (enzyme concentration, pH, extraction temperature, extraction time, water/material ratio) were selected for the single factor experiments. Next, on the basis of the single factor experiments, the five independent variables at five levels were designed in a BBD by RSM. Design Expert (Trial Version 8.0.6; State-Ease Inc., Minneapolis, MN, USA) was used to analyse and calculate the predicted responses and experimental design for the cellular antioxidant activity. The responses obtained from each set of experimental designs were analyzed by multiple regressions to fit the following quadratic polynomial model:where Y is the response variable, β0 is a constant, βi, βii and βij are the linear, quadratic, and interaction coefficients, respectively, while Xi and Xj are the coded independent variables.
According to the Design Expert Software, an analysis of variance table was generated, and the effect and regression coefficients of linear, quadratic and interaction terms were determined. P values greater than 0.05 indicated the model terms were not significant. The regression coefficient was used to perform statistical calculations, and the generated 3D surface was determined from the fitted polynomial equation.
2.4 Determination of degree of hydrolysis (DH)
The degree of hydrolysis was evaluated as the proportion (%) of α-amino nitrogen with respect to the total nitrogen in the sample.20 Analyses were repeated three times.2.5 Determination of nitrogen recovery (NR)
After hydrolysis, the supernatant was obtained by centrifugation at 4000 × g (4 °C) for 20 min. The volume of the soluble fraction was recorded, and the total nitrogen in the supernatant was determined using the Kjeldahl method.21 NR was calculated using the following equation:22| NR (%) = Total nitrogen in supernatant (mg)/total nitrogen in substrate (mg) × 100 |
2.6 Antioxidant analyses in HepG2 cells
| Cellular antioxidant activity (%) = (A1 − A0)/(A2 − A0) × 100, |
2.7 Hydroxyl radical scavenging activity
The scavenging activity of the MPH supernatant on hydroxyl radicals was tested using the method described by Jin et al.24 with several modifications. Briefly, the reaction mixture contained 1.0 mL of phosphate buffer (PBS, 0.15 mol L−1, pH 7.4), 1.0 mL of safranine T (1.0 mM), 0.5 mL of EDTA-FeSO4 (2.0 mmol L−1) and 1.0 mL of MPH at a certain concentration. After sufficient mixing, 1.0 mL of H2O2 (3%) was added to the mixture. Following incubation at 37 °C for 30 min, the absorbance of the mixture was measured at 520 nm. The hydroxyl radical scavenging activity was calculated as: scavenging rate (%) = [(A1 − A0)/(A2 − A0)] × 100, where A1 was the absorbance of the MPH with H2O2, A2 was the absorbance without H2O2, and A0 was the absorbance of the control. Both A0 and A2 were mixtures with sample solution replaced by deionized water. VC was used as a positive control. All experiments were performed in triplicate.2.8 DPPH radical scavenging activity
The DPPH radical scavenging activities of the MPH supernatant were determined as described by Blois25 with slight modifications. Briefly, 1.0 mL of DPPH (0.1 mmol L−1) diluted in ethanol was added to 3.0 mL of MPH at a certain concentration. After vigorous shaking, the mixture was left to stand for 30 min, and the absorbance was measured at 517 nm. The DPPH radical scavenging activity was calculated as follows: scavenging rate (%) = [1 − (A1 − A0)/(A2 − A0)] × 100, where A0 was the absorbance without DPPH, A1 was the absorbance in the presence of the MPH, and A2 was the absorbance of the control (without MPH). VC was used as a positive control. All experiments were performed in triplicate.2.9 Purification of MPH
000 Da and 3500 Da, respectively. The fractions were designed as follows: MPH-I (>10000 Da), MPH-II (3500–10000 Da) and MPH-III (<3500 Da). Filtrates were freeze-dried and stored at −20 °C for further purification and cellular antioxidant activity test.000 for full MS scan and 17500 for MS2 scan, automatic gain control target 3 × 10⁶ for full scan and 1 × 10⁵ for MS2, maximum ion injection time 20 ms for full MS scan and 60 ms for MS2 scan.2.10 Statistical analysis
Data were presented as means ± SD. The statistical significance of the data was determined by variance analysis (ANOVA) using SPSS software (version 18.0 for Windows, SPSS Inc., Chicago, IL, USA), and means were compared by Duncan's multiple comparison post-test. Statistical differences were considered to be significant at p < 0.05.3. Results and discussion
3.1 Cytotoxicity effect of H2O2 or mackerel protein hydrolysates (MPH) on HepG2 cells
High levels of dietary compounds can be toxic or mutagenic to cell culture systems,27 and hence, the direct effect of MPH at different concentrations on the cell viability of HepG2 cells was investigated. As shown in Fig. 1A, MPH and VC were relatively non-toxic to HepG2 cells at concentrations from 0.025 mg mL−1 to 10 mg mL−1, with cell viability more than 90%. The result showed that MPH and VC had very low toxicity and that the required concentration in this range was permissible. | ||
| Fig. 1 Dose-dependent toxic effects of MPH, VC and H2O2 on HepG2 cell viability. Data were presented as the means ± SD. | ||
The effect of H2O2 on the cell viability of HepG2 cells was depicted in Fig. 1B. When the cells were exposed to oxidative stressors, the viability of cells decreased.23 As shown in Fig. 1B, with increasing levels of H2O2, cell viability decreased from 89.26% to 20.15%. The result suggested that HepG2 cells were sensitive to H2O2. Based on the cell viability test, the level of 1000 µM H2O2 that led to 50% cell viability was selected to study the cellular antioxidant activity.
3.2 Selections of proteolytic enzymes
It is critically important to select an appropriate protease because proteases play an important role in the antioxidant activity of protein hydrolysates.28 In this study, five proteases were used for the hydrolytic production of MPH: pepsin, trypsin, papain, flavourzyme and neutrase. These proteases were selected based on their cellular antioxidant activity. As shown in Fig. 2, MPH treated with trypsin, papain and flavourzyme exhibited higher DH than the MPH treated with pepsin and neutrase, while MPH treated with neutrase demonstrated the highest NR (50.99%) and cellular antioxidant activity (53.65%), significantly different from the other four enzyme hydrolysates (P < 0.05). Furthermore, cellular antioxidant activity of VC group was 48.69%, which was lower than the trypsin and neutrase hydrolysates. Therefore, neutrase was chosen as the best candidate for further study. | ||
| Fig. 2 Cellular antioxidant activity, DH and NR of MPH prepared by different proteases. Data are presented as means ± SD. Bar graphs followed by different letters indicate significant differences (P < 0.05). DH indicates degree of hydrolysis, NR indicates nitrogen recovery. The concentrations of MPH and VC were 10 mg mL−1. | ||
3.3 Single factor experiments
In this work, the effects of five single factors on cellular antioxidant activity were investigated. Fig. 3 showed that for these five single factors, the cellular antioxidant activity increased at first and reached a high point followed by a decrease. Thus, the optimal conditions were determined as follows: enzyme concentration of 1000 U g−1, extraction time of 4.0 hours, pH of 7.0, water/material ratio of 5:1 v/w, and extraction temperature of 40 °C. Furthermore, cellular antioxidant activity of VC group was 49.12%.
 | ||
| Fig. 3 Effects of five single factors on cellular antioxidant activity. Y-axis was cellular antioxidant activity. The concentration of MPH and VC was 10 mg mL−1. Data are presented as means ± SD. | ||
3.4 Optimization of extraction conditions by Box–Behnken design (BBD)
According to the single factor experiments, the design matrix and corresponding results obtained from BBD to determine the effects of the five independent variables were listed in Table 1, and the five independent variables (enzyme concentration, extraction time, pH, water/material ratio, extraction temperature) were coded as A, B, C, D and E, respectively.| Run numbers | A | B | C | D | E | Cellular antioxidant activityb (%) |
|---|---|---|---|---|---|---|
| a A, B, C, D and E meant enzyme concentration (U g−1), extraction time (h), pH, water/material ratio (v/w) and extraction temperature (°C).b Data represented mean of three measured values. | ||||||
| 1 | 600 | 2 | 7 | 5 | 40 | 45.47 |
| 2 | 1400 | 2 | 7 | 5 | 40 | 49.20 |
| 3 | 600 | 6 | 7 | 5 | 40 | 51.86 |
| 4 | 1400 | 6 | 7 | 5 | 40 | 55.71 |
| 5 | 1000 | 4 | 5 | 1 | 40 | 35.45 |
| 6 | 1000 | 4 | 9 | 1 | 40 | 43.41 |
| 7 | 1000 | 4 | 5 | 9 | 40 | 35.69 |
| 8 | 1000 | 4 | 9 | 9 | 40 | 39.32 |
| 9 | 1000 | 2 | 7 | 5 | 30 | 38.82 |
| 10 | 1000 | 6 | 7 | 5 | 30 | 47.03 |
| 11 | 1000 | 2 | 7 | 5 | 50 | 47.01 |
| 12 | 1000 | 6 | 7 | 5 | 50 | 53.40 |
| 13 | 600 | 4 | 5 | 5 | 40 | 38.45 |
| 14 | 1400 | 4 | 5 | 5 | 40 | 45.51 |
| 15 | 600 | 4 | 9 | 5 | 40 | 46.20 |
| 16 | 1400 | 4 | 9 | 5 | 40 | 53.67 |
| 17 | 1000 | 4 | 7 | 1 | 30 | 45.80 |
| 18 | 1000 | 4 | 7 | 9 | 30 | 47.55 |
| 19 | 1000 | 4 | 7 | 1 | 50 | 48.92 |
| 20 | 1000 | 4 | 7 | 9 | 50 | 53.00 |
| 21 | 1000 | 2 | 5 | 5 | 40 | 39.14 |
| 22 | 1000 | 6 | 5 | 5 | 40 | 46.59 |
| 23 | 1000 | 2 | 9 | 5 | 40 | 42.39 |
| 24 | 1000 | 6 | 9 | 5 | 40 | 48.21 |
| 25 | 600 | 4 | 7 | 1 | 40 | 39.14 |
| 26 | 1400 | 4 | 7 | 1 | 40 | 49.50 |
| 27 | 600 | 4 | 7 | 9 | 40 | 44.15 |
| 28 | 1400 | 4 | 7 | 9 | 40 | 55.32 |
| 29 | 1000 | 4 | 5 | 5 | 30 | 41.46 |
| 30 | 1000 | 4 | 9 | 5 | 30 | 42.74 |
| 31 | 1000 | 4 | 5 | 5 | 50 | 47.43 |
| 32 | 1000 | 4 | 9 | 5 | 50 | 52.79 |
| 33 | 600 | 4 | 7 | 5 | 30 | 48.53 |
| 34 | 1400 | 4 | 7 | 5 | 30 | 53.73 |
| 35 | 600 | 4 | 7 | 5 | 50 | 54.05 |
| 36 | 1400 | 4 | 7 | 5 | 50 | 56.88 |
| 37 | 1000 | 2 | 7 | 1 | 40 | 40.97 |
| 38 | 1000 | 6 | 7 | 1 | 40 | 50.58 |
| 39 | 1000 | 2 | 7 | 9 | 40 | 45.38 |
| 40 | 1000 | 6 | 7 | 9 | 40 | 50.10 |
| 41 | 1000 | 4 | 7 | 5 | 40 | 56.55 |
| 42 | 1000 | 4 | 7 | 5 | 40 | 56.19 |
| 43 | 1000 | 4 | 7 | 5 | 40 | 56.67 |
| 44 | 1000 | 4 | 7 | 5 | 40 | 60.68 |
| 45 | 1000 | 4 | 7 | 5 | 40 | 61.53 |
| 46 | 1000 | 4 | 7 | 5 | 40 | 64.08 |
These results showed that cellular antioxidant activity of MPH was ranged from 35.45% to 64.08%. The data were analysed via multiple regression analysis using Design-Expert software to yield the following polynomial equation:
| Y = +59.28 + 3.23A + 3.44B + 2.44C + 1.05D + 2.99E + 0.030AB + 0.10AC + 0.20AD − 0.59AE − 0.41BC − 1.22BD − 0.45BE − 1.08CD + 1.02CE + 0.58DE − 3.00A2 − 5.96B2 − 10.41C2 − 8.26D2 − 3.68E2 |
The analysis of variance (ANOVA) results for the model were given in Table 2. The corresponding variables were more significant as the F-value increased and the P-value decreased.29 The model F-value of 10.13 implies that the model was significant, and the P-value was less than 0.0500, indicating that the model terms were significant. Additionally, the variables with significant effects (P < 0.01) on the cellular antioxidant activity of MPH were A, B, C, E, A2, B2, C2, D2 and E2. Furthermore, the model showed good fit with the experimental data with high R2 (89.01%) and Adj. R2 (80.22%). The low coefficient of variation (CV = 6.35%) clearly suggested a high degree of precision and reliability of the experimental values. “Adeq Precision” measured the signal-to-noise ratio, and the ratio of 11.189 indicated an adequate signal. This finding suggested that the hydrolysis of MPH can be analysed and predicted by the model.
| Variables | Sum of squares | DF | Mean square | F value | P value |
|---|---|---|---|---|---|
| Model | 1912.47 | 20 | 95.62 | 10.13 | <0.0001 |
| Residual | 236.10 | 25 | 9.44 | ||
| Lack of fit | 182.24 | 20 | 9.11 | 1 | 0.6473 |
| Pure error | 53.86 | 5 | 10.77 | ||
| Cor total | 2148.57 | 45 | |||
| R2 | 0.8901 | ||||
| Adj. R2 | 0.8022 | ||||
| Pred. R2 | 0.6246 | ||||
| Adeq precision | 11.189 | ||||
| CV% | 6.35 |
The effects of variables and their interactions on cellular antioxidant activity were illustrated by 3D response surfaces. The figures displayed the effects of two factors on cellular antioxidant activity, while the others were maintained at zero.30
As shown in Fig. 4A, when the enzyme concentration increased from 600 U g−1 to 1400 U g−1, the cellular antioxidant activity increased slightly; the same trend was shown in Fig. 4B–D, respectively. Additionally, the cellular antioxidant activity increased significantly when the extraction time increased from 2 h to 5 h and decreased slightly with an extraction time of 6 h in Fig. 4A. We inferred that the hydrolysis reaction was powerful during the first three hours and later became flat; the same trend was shown in Fig. 4E–G, respectively.
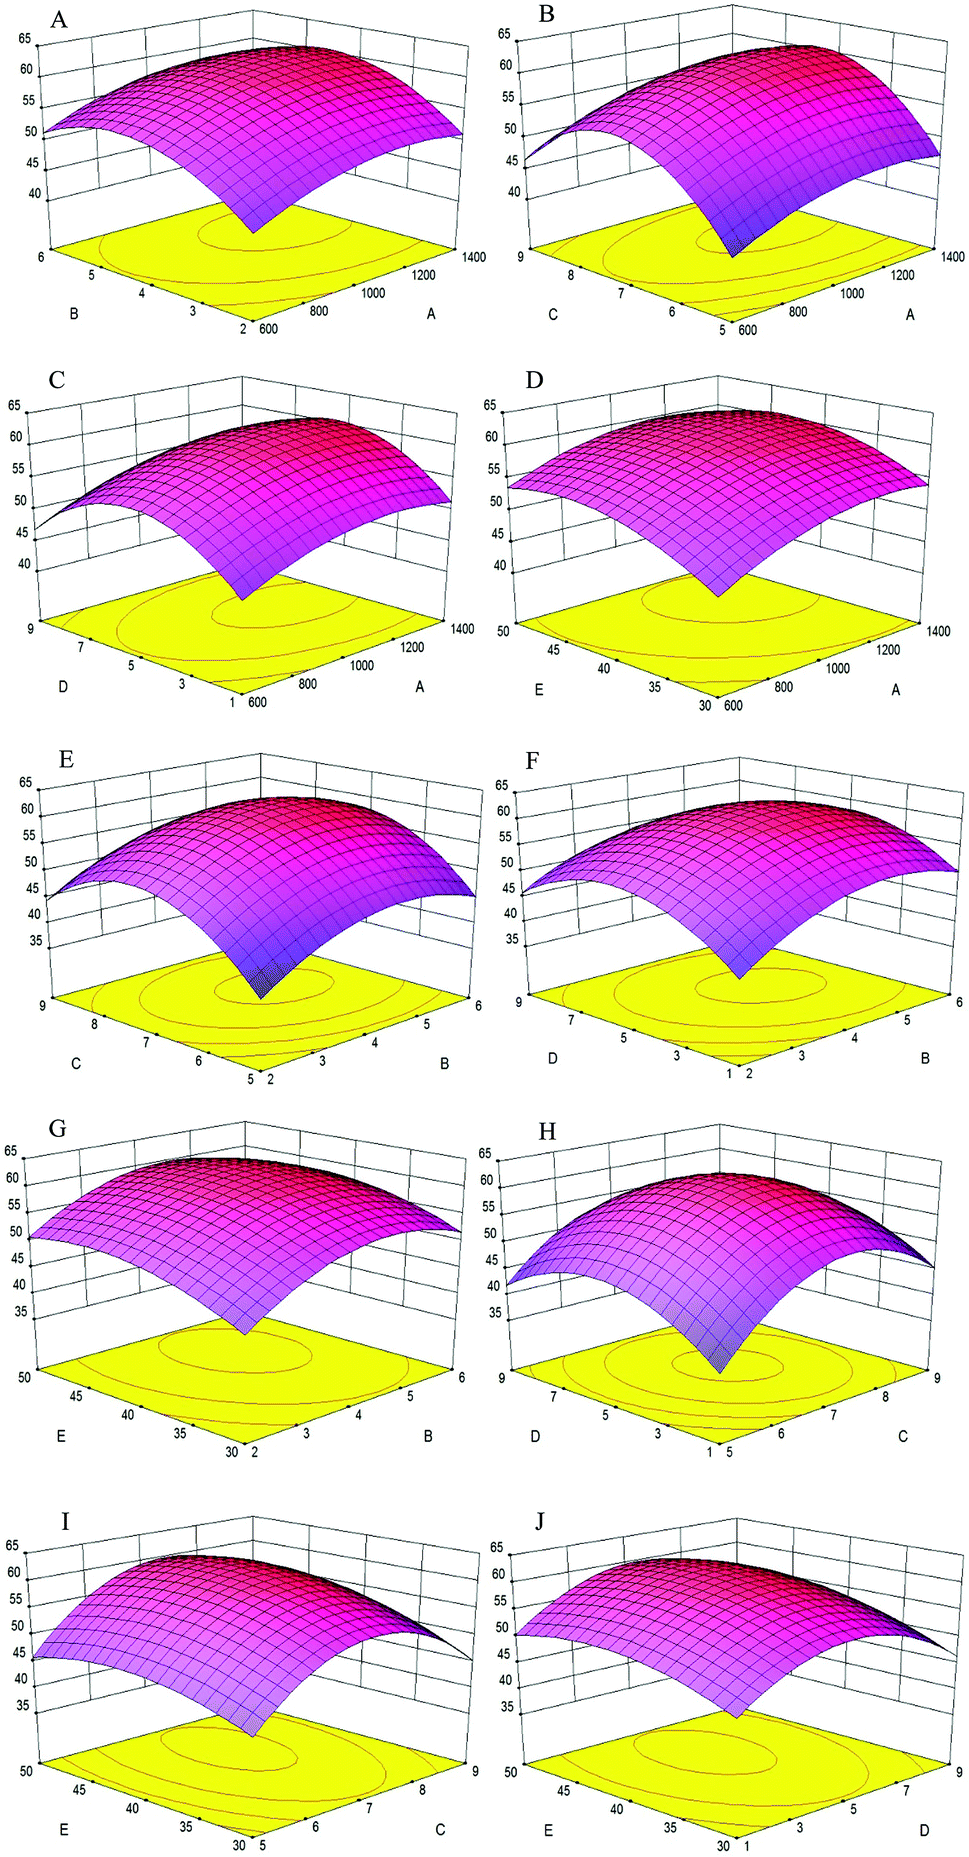 | ||
| Fig. 4 Response surface plots showing the effects of variables on the cellular antioxidant activity of MPH. X-axis and Y-axis: A (enzyme concentration); B (extraction time); C (pH); D (water/material ratio); E (extraction temperature). Z-axis: cellular antioxidant activity (%). | ||
Fig. 4B showed that as the enzyme concentration increased from 600 U g−1 to 1400 U g−1, the cellular antioxidant activity increased significantly when the pH increased from 5 to 7 and later decreased significantly when the pH reached 9. Thus, pH was a significant factor in the experiment because each protein had a different isoelectric point, and protein solubility was affected by pH. The same pH change trend was shown in Fig. 4E, H and I when another factor was changed.
Fig. 4C, F, H and J showed that when the water/material ratio increased from 1 v/w to 5 v/w, the cellular antioxidant activity increased significantly, indicating that a lower water/material ratio was desirable to promote the antioxidant activity of hydrolysates; for a water/material ratio from 5 v/w to 9 v/w, the cellular antioxidant activity decreased significantly.
As shown in Fig. 4D, cellular antioxidant activity increased slightly when the enzyme temperature increased from 30 °C to 50 °C. Within a certain temperature range, the number of active catalyst molecules increased with increasing temperature.31 The same trend was seen in Fig. 4G, I and J when another factor was changed.
Using Design-Expert 8.0, the optimal hydrolysate conditions were as follows: enzyme concentration of 1203.2 U g−1, extraction time of 4.53 h, pH of 7.26, and water/material ratio of 5.22 v/w and extraction temperature of 43.72 °C. The maximum cellular antioxidant activity was 61.30%, which was in agreement with the experimental value.
3.5 Purification of MPH
UF membranes with a MWCO of 10000 Da and 3500 Da were used to separate the MPH into three fractions: MPH-I (>10000 Da), MPH-II (3500–10000 Da) and MPH-III (<3500 Da), respectively. It is well-known that antioxidant activity is affected by the size and compositional changes of peptides.32 Low-molecular-weight peptides are more biologically active than the larger parent polypeptides.33 As shown in Fig. 5, MPH-III showed the highest hydroxyl radical scavenging activity, DPPH radical scavenging activity and cellular antioxidant activity with values of 61.28%, 79.38% and 65.76%, respectively, which were significantly higher than those of MPH-I and MPH-II (P < 0.05). The result was consistent with the report from You et al.,34 who also observed that protein hydrolysates with molecular weight below 3000 Da had a higher antioxidant activity than other fractions. Furthermore, hydroxyl radical scavenging activity, DPPH radical scavenging activity and cellular antioxidant activity of VC were significantly lower than that of MPH-III (P < 0.05). Therefore, MPH-III was used for further antioxidant assays and purification.
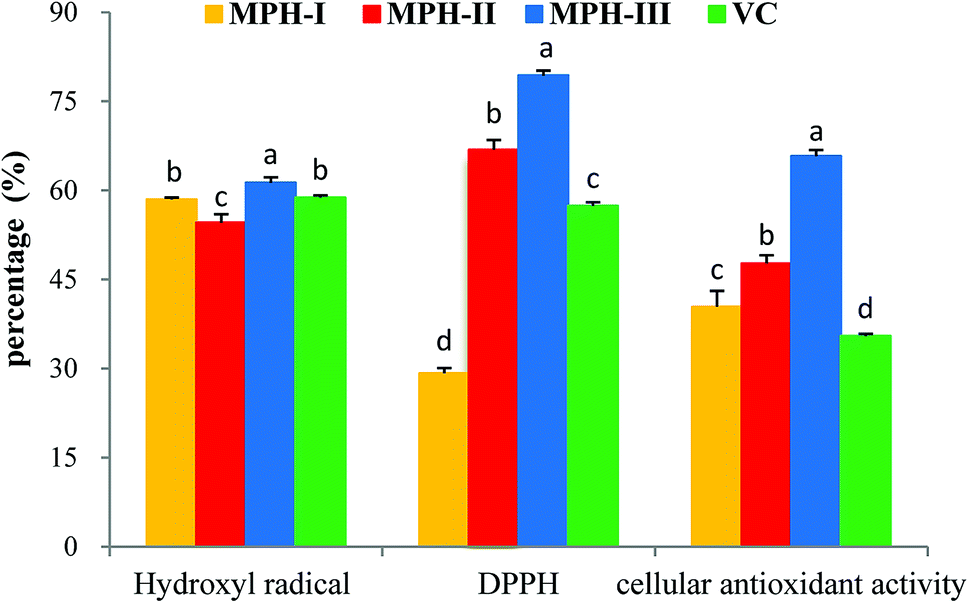 | ||
| Fig. 5 Antioxidant activities of MPH with different molecular weight. In hydroxyl radical scavenging activity and DPPH radical scavenging activity assays, the concentrations of MPH and VC were 10 mg mL−1; in a cellular antioxidant activity assay, the concentration of MPH and VC was 1 mg mL−1. Data are presented as means ± SD. Bar graphs followed by different letters indicate significant differences (P < 0.05). | ||
Gel filtration chromatography was applied to isolate protein hydrolysates according to their molecular weight.34 The most active fraction MPH-III was subjected to size exclusion chromatography using Sephadex G-25 and fractionated into five portions (Fig. 6A). Each peak was pooled and lyophilized. As shown in Fig. 6B, the cellular antioxidant activity of VC was significantly lower than MPH fractions and MPH-III-2 was exhibited the strongest cellular antioxidant activity of 59.16%, which was significantly higher than those of the other fractions (P < 0.05).
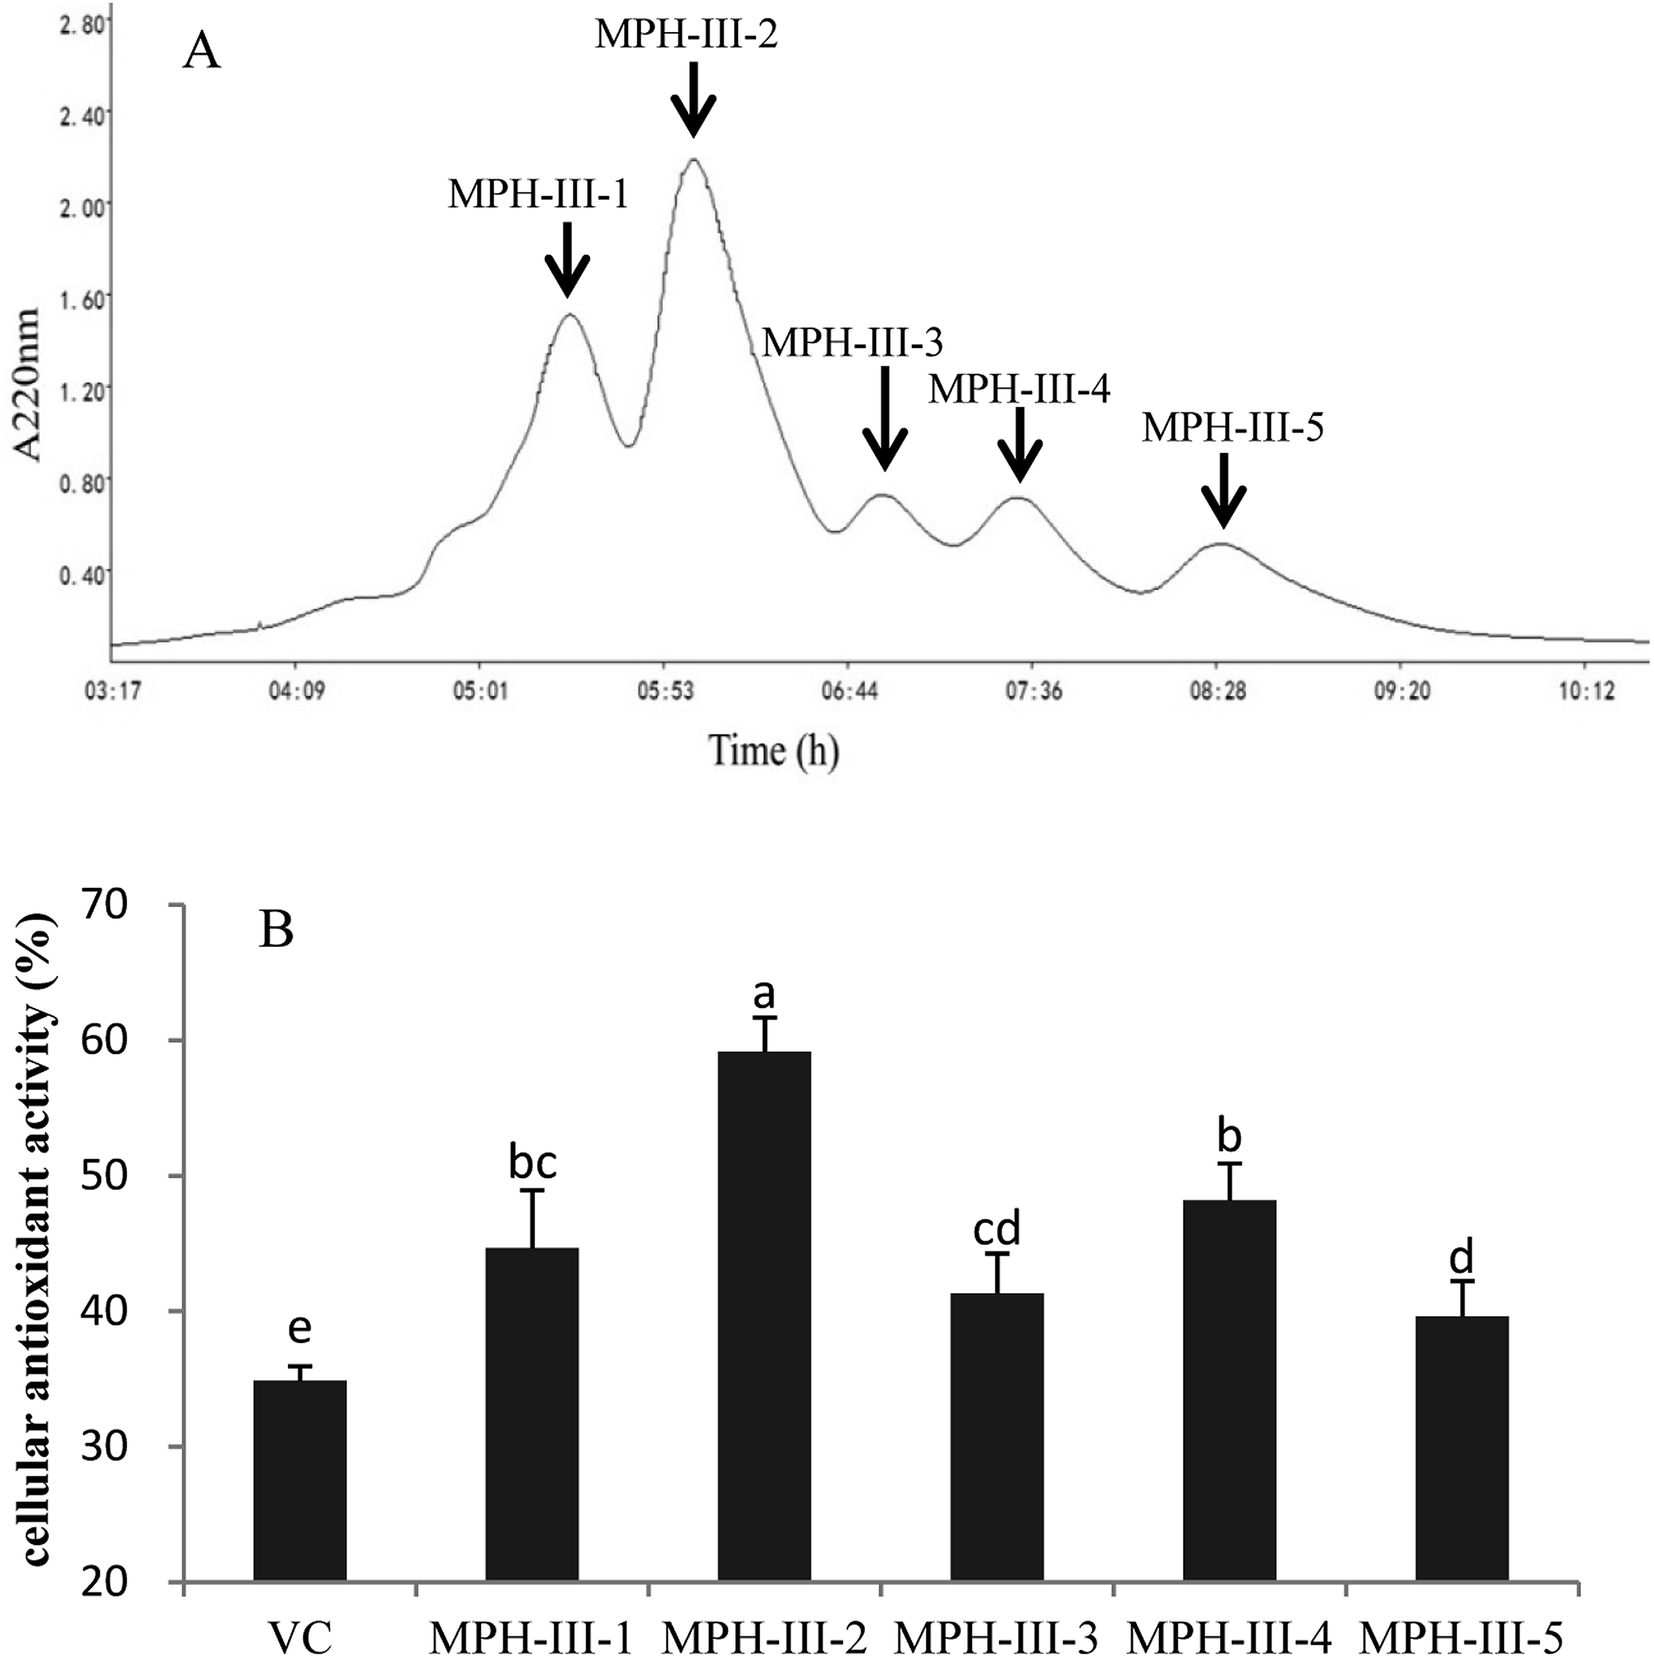 | ||
| Fig. 6 Elution profile of MPH-III after ultrafiltration by Sephadex G-25 gel filtration chromatography (A) and cellular antioxidant activity of the eluted peak (B). Concentrations of fractions from MPH-III and VC were 1 mg mL−1. Data are presented as means ± SD. Bar graphs followed by different letters indicated the significant differences (P < 0.05). | ||
The active fraction MPH-III-2 was further separated using RP-HPLC with an XBridge® peptide BEH C18 column, and the fraction was divided into six portions (Fig. 7A). Fraction MPH-III-2-6 showed the highest cellular antioxidant activity of 67.61% (Fig. 7B), which was significantly higher than those of the other fractions and VC group (P < 0.05). The results showed that peptides with the greatest retention time when eluting from the reverse phase column had the highest cellular antioxidant activity.34
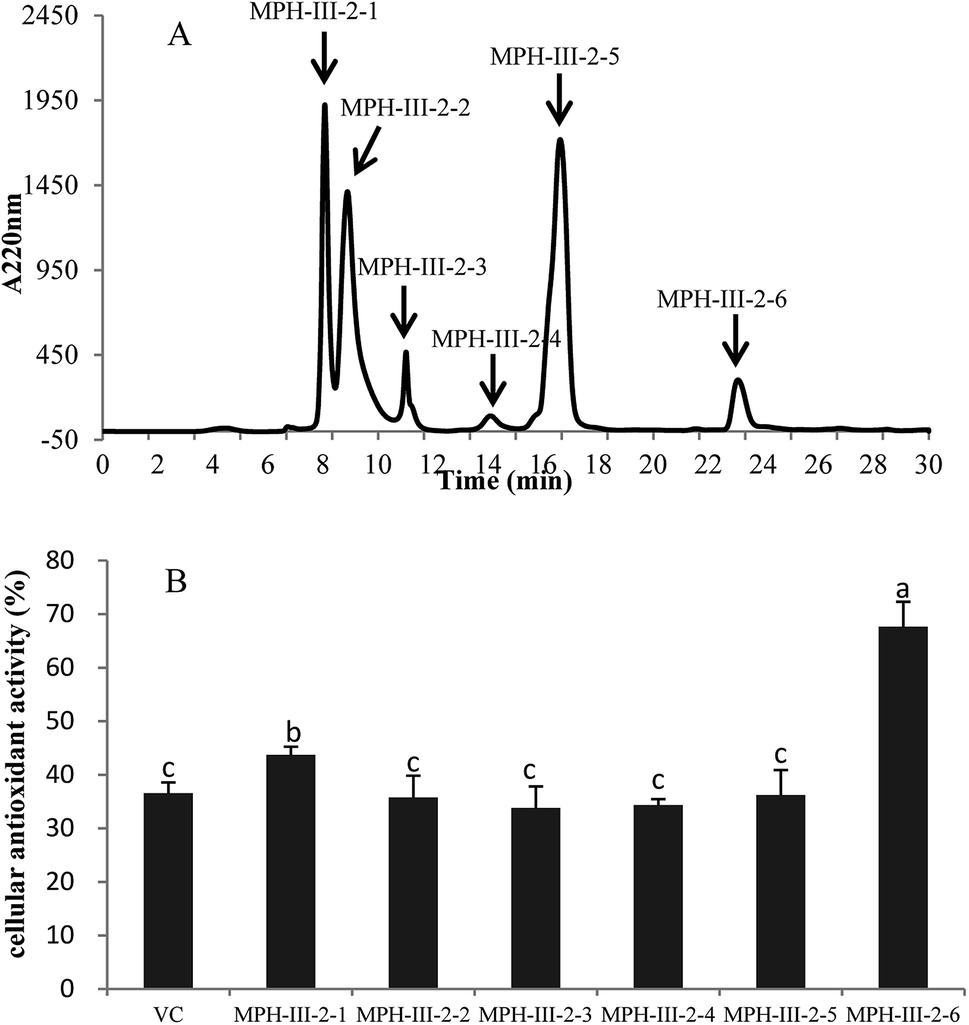 | ||
| Fig. 7 Elution profile of MPH-III-2 on an XBridge® peptide BEH C18 column (A) and cellular antioxidant activity of eluted peak (B). Concentrations of fractions from MPH-III-2 and VC were 1 mg mL−1. Data are presented as means ± SD. Bar graphs followed by different letters indicates significant differences (P < 0.05). | ||
In peptide identification, mass spectrometric approaches have become increasingly widely used to analyse the amino acid sequences of peptide and proteins due to their rapid, high-throughput and high sensitivity capabilities.35 According to the Thermo Scientific Q Exactive mass spectrometer, two high score peptides P1 and P2 were obtained. The precursor ion scan mass spectrum was shown in Fig. 8A and 9A, respectively. The MS/MS spectrum of two charged ions with m/z at 422.7 Da and 380.7 Da were shown in Fig. 8B and 9B, respectively. Following sequence interpretation and a database search, the MPH-III-2 with m/z at 422.7 Da was identified as the heptapeptide P1: LDIQKEV (843.5 Da); and with m/z at 380.7 Da was identified as the octapeptide P2: TAAIVNTA (759.4 Da). This finding was consistent with other antioxidant peptides identified from fish sources with molecular weights between 500 and 1500 Da.36,37 The result further confirmed the general finding that short peptides with 2–20 amino acids exhibited greater antioxidant activity and other bioactive properties.38 This finding indicated that it was possible to obtain an antioxidative peptide from mackerel protein using enzymatic hydrolysis.
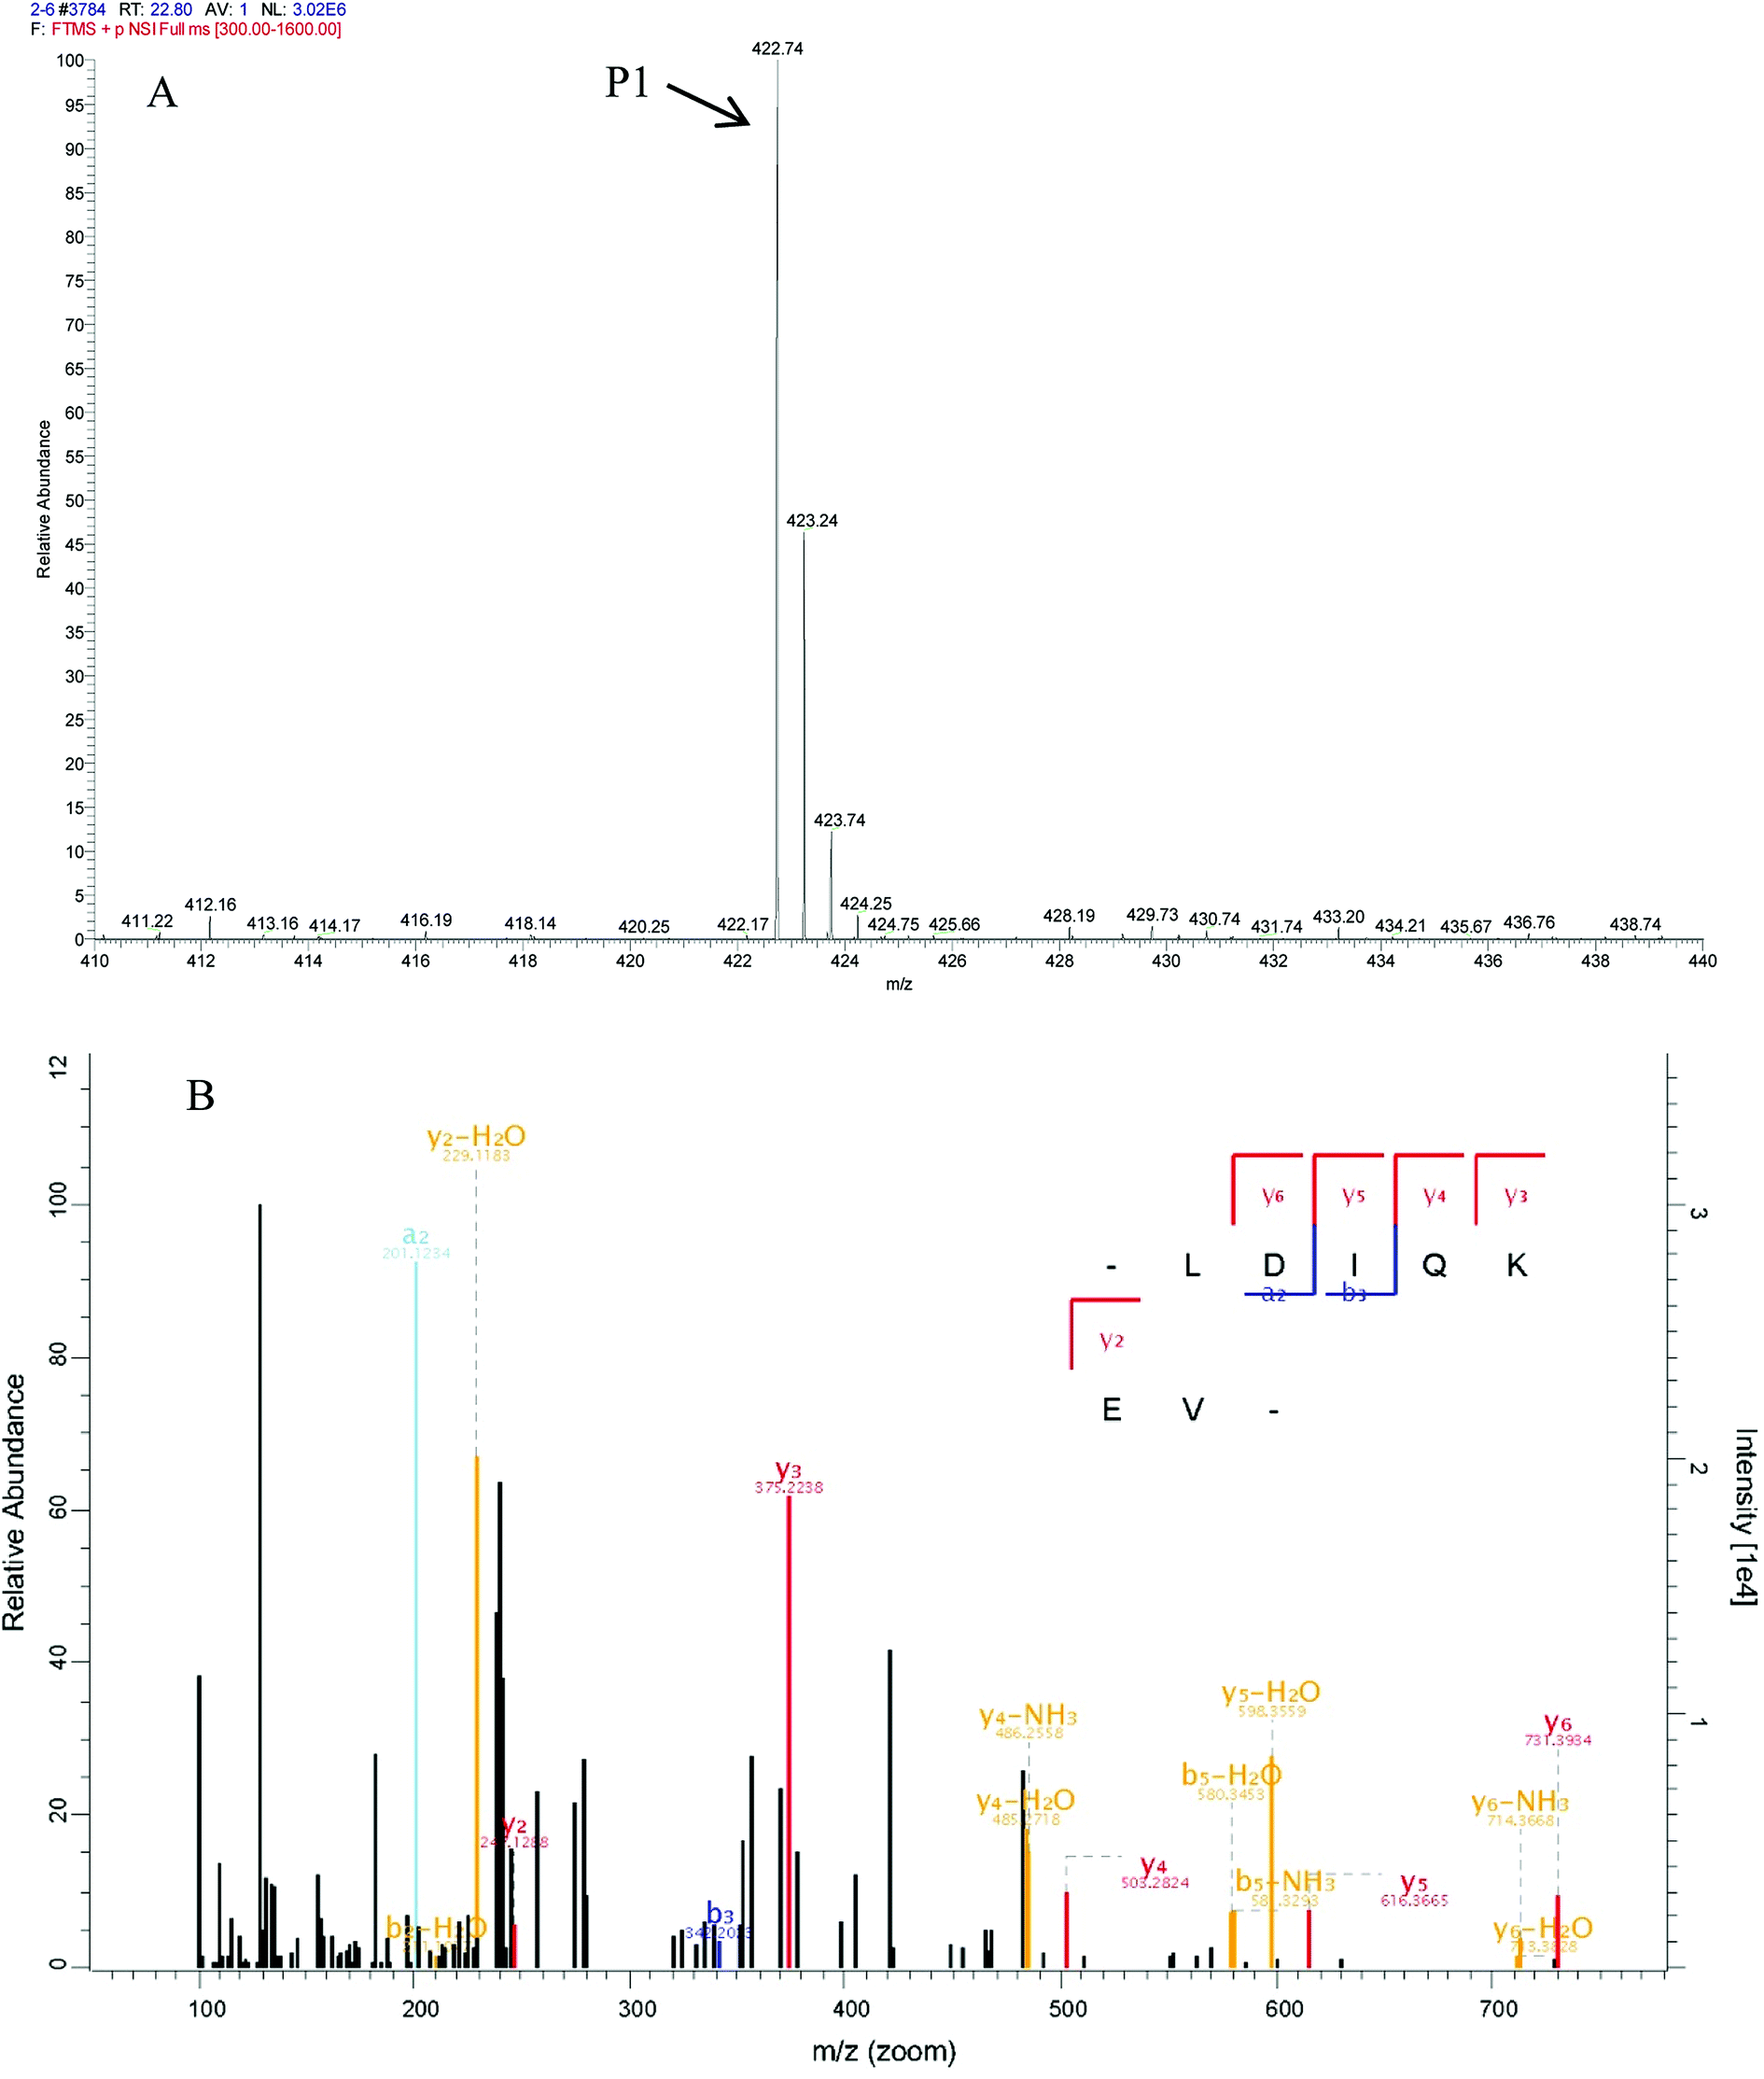 | ||
| Fig. 8 Identification of molecular mass and amino acid sequence of MPH-III-2-P1. The mass spectrum of the highest active peak (P1) was acquired (A). The accurate molecular weight of P1 was determined to 843.5 Da. The collision induced fragmentation of P1 was illustrated (B). By sequence interpretation and manual calculation, the sequence of this peptide is displayed with the fragment ions observed in the MS/MS spectrum. For clarity, only b and y ions are labeled. | ||
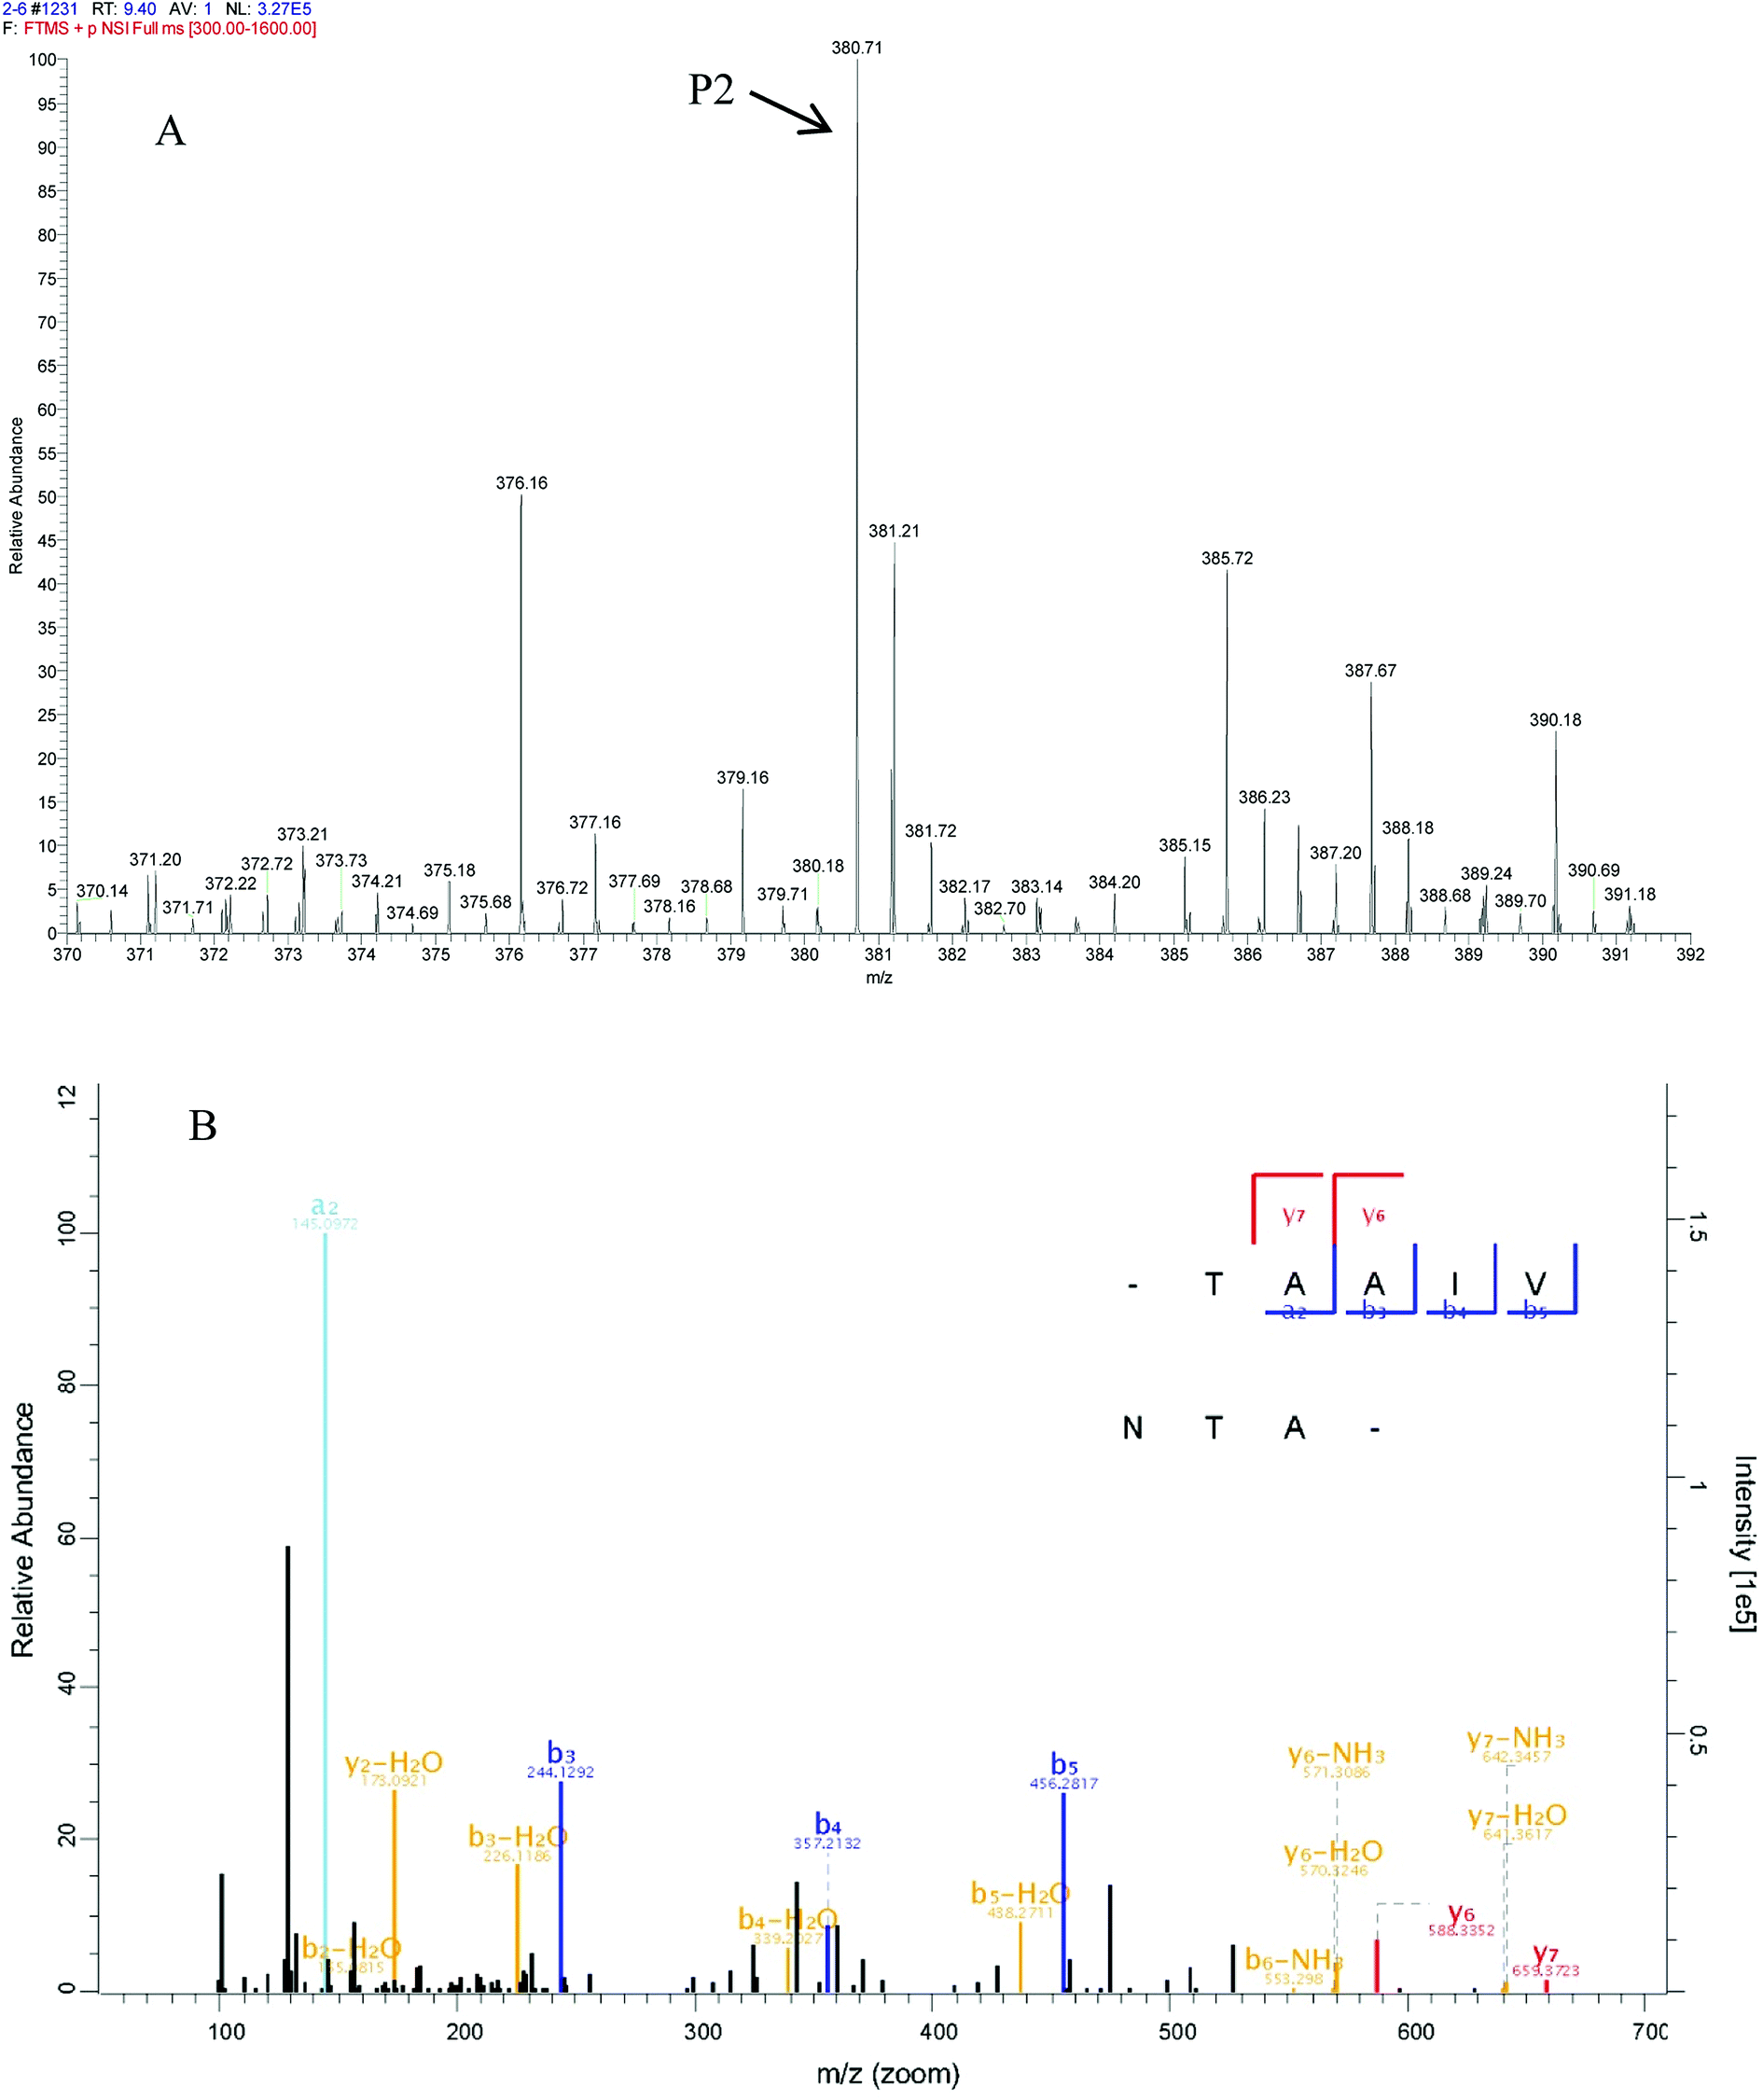 | ||
| Fig. 9 Identification of molecular mass and amino acid sequence of MPH-III-2-P2. The mass spectrum of the highest active peak (P2) was acquired (A). The accurate molecular weight of P2 was determined to 759.4 Da. The collision induced fragmentation of P2 was illustrated (B). By sequence interpretation and manual calculation, the sequence of this peptide is displayed with the fragment ions observed in the MS/MS spectrum. For clarity, only b and y ions are labeled. | ||
4. Conclusion
Marine low-value fish are used in many industries, and their commercial applications are expanding every year. However, their applicability as bioactive compounds and their active compositions have not been extensively studied. Based on the results in this study, it appeared that low-molecular-weight peptides obtained from neutrase-hydrolysed mackerel (Pneumatophorus japonicus) protein exhibited good antioxidant activity. The heptapeptide LDIQKEV (843.5 Da) and the octapeptide TAAIVNTA (759.4 Da) were identified from the MPH using a series of purification methods. For further development as novel antioxidative peptides, the in vivo effects of these peptides should be investigated.Conflicts of interest
The authors declare that there is no conflict of interests regarding the publication of this paper.Acknowledgements
The study was supported by the National Natural Science Foundation of China (No. 41506175), Key Research and Development Program of Shandong Province (2017YYSP018), Qingdao Science and Technology Project (No. 17-3-3-21-nsh) and the Key Research Program of the Chinese Academy of Sciences (No. KFZD-SW-106).References
- B. Halliwell, Lancet, 1994, 344, 721–724 CrossRef.
- Y. H. Li, L. Wei, J. R. Cao, L. G. Qiu, X. Jiang, P. Li, Q. Q. Song, H. L. Zhou, Q. Han and X. P. Diao, Chemosphere, 2016, 144, 234–240 CrossRef PubMed.
- F. Luo, R. Xing, X. Wang, H. Yang and P. Li, Int. J. Food Sci. Technol., 2017, 53, 395–403 CrossRef.
- A. T. Girgih, C. C. Udenigwe, F. M. Hasan, T. A. Gill and R. E. Aluko, Food Res. Int., 2013, 52, 315–322 CrossRef.
- C. F. Chi, F. Y. Hu, B. Wang, Z. R. Li and H. Y. Luo, Mar. Drugs, 2015, 13, 2580–2601 CrossRef PubMed.
- R. Morales-Medina, F. Tamm, A. M. Guadix, E. M. Guadix and S. Drusch, Food Chem., 2016, 194, 1208–1216 CrossRef PubMed.
- K. H. S. Farvin, L. L. Andersen, J. Otte, H. H. Nielsen, F. Jessen and C. Jacobsen, Food Chem., 2016, 204, 409–419 CrossRef PubMed.
- P. J. García-Moreno, I. Batista, C. Pires, N. M. Bandarra, F. J. Espejo-Carpio, A. Guadix and E. M. Guadix, Food Res. Int., 2014, 65, 469–476 CrossRef.
- M. Chalamaiah, B. Dinesh kumar, R. Hemalatha and T. Jyothirmayi, Food Chem., 2012, 135, 3020–3038 CrossRef PubMed.
- R. S. Croker, Fish. Bull., 1933, 40, 1–149 Search PubMed.
- K. A. M. Donnelly, M. Thakur and J. Sakai, Food Control, 2013, 33, 25–31 CrossRef.
- J. H. Bae and S. Y. Lim, Food Chem. Toxicol., 2012, 50, 823–828 CrossRef PubMed.
- R. Perez-Galvez, R. Morales-Medina, F. Espejo-Carpio, A. Guadix and E. M. Guadix, Food Funct., 2016, 7, 3890–3901 Search PubMed.
- C. W. Tan, T. T. H. Malcolm, C. H. Kuan, T. Y. Thung, W. S. Chang, Y. Y. Loo, J. M. K. J. K. Premarathne, O. B. Ramzi, M. F. S. Norshafawatie, N. Yusralimuna, Y. Rukayadi, Y. Nakaguchi, M. Nishibuchi and S. Radu, Front Microbiol., 2017, 8, 1–9 RSC.
- X. Q. Wang, H. H. Yu, R. G. Xing, X. L. Chen, S. Liu and P. C. Li, BioMed Res. Int., 2017, 1–14 Search PubMed.
- A. G. P. Samaranayaka and E. C. Y. Li-Chan, J. Funct. Foods, 2011, 3, 229–254 CrossRef.
- N. S. Sampath Kumar, R. A. Nazeer and R. Jaiganesh, Amino Acids, 2012, 42, 1641–1649 CrossRef PubMed.
- R. Morales-Medina, R. Pérez-Gálvez, A. Guadix and E. M. Guadix, Process Biochem., 2017, 52, 149–158 CrossRef.
- J. A. Vazquez, P. Ramos, J. Miron, J. Valcarcel, C. G. Sotelo and R. I. Perez-Martin, Mar. Drugs, 2017, 15, 1–14 Search PubMed.
- W. H. Taylor, Analyst, 1957, 82, 488–498 RSC.
- AOAC, Official Methods of Analysis, Association of Official Agricultural Chemists, Washington, DC, 14th edn, 1984 Search PubMed.
- S. Benjakul and M. T. Morrissey, J. Agric. Food Chem., 1997, 45, 3423–3430 CrossRef.
- S. Yarnpakdee, S. Benjakul, H. Kristinsson and H. Bakken, J. Food Sci. Technol., 2015, 52, 6194–6205 CrossRef PubMed.
- M. Jin, Y. X. Cai, J. R. Li and H. Zhao, Prog. Biochem. Biophys., 1996, 23, 553–555 Search PubMed.
- M. S. Blois, Nature, 1958, 181, 1199–1200 CrossRef.
- L. Tian, J. Liu, L. Ma, L. Zhang, S. Wang, E. Yan and H. Zhu, J. Food Process. Preserv., 2017, 41, 1–11 Search PubMed.
- M. Alia, R. Mateos, S. Ramos, E. Lecumberri, L. Bravo and L. Goya, Eur. J. Nutr., 2006, 45, 19–28 CrossRef PubMed.
- X. Fang, N. Xie, X. Chen, H. Yu and J. Chen, Food Bioprod. Process., 2012, 90, 676–682 CrossRef.
- Z. Y. Zhao, Q. Zhang, Y. F. Li, L. L. Dong and S. L. Liu, Carbohydr. Polym., 2015, 119, 101–109 CrossRef PubMed.
- K. Feng, W. Chen, L. Sun, J. Liu, Y. Zhao, L. Li, Y. Wang and W. Zhang, Carbohydr. Polym., 2015, 125, 45–52 CrossRef PubMed.
- L. Y. Liu, Y. P. Wang, C. Peng and J. J. Wang, Int. J. Mol. Sci., 2013, 14, 3124–3139 CrossRef PubMed.
- H. M. Chen, K. Muramoto, F. Yamauchi and K. Nokihara, J. Agric. Food Chem., 1996, 44, 2619–2623 CrossRef.
- C. Chen, Y.-J. Chi, M.-Y. Zhao and L. Lv, Amino Acids, 2012, 43, 457–466 CrossRef PubMed.
- L. You, M. Zhao, J. M. Regenstein and J. Ren, Food Res. Int., 2010, 43, 1167–1173 CrossRef.
- B. Li, F. Chen, X. Wang, B. Ji and Y. Wu, Food Chem., 2007, 102, 1135–1143 CrossRef.
- S. Ranathunga, N. Rajapakse and S. K. Kim, Eur. Food Res. Technol., 2006, 222, 310–315 CrossRef.
- S. Y. Jun, P. J. Park, W. K. Jung and S. K. Kim, Eur. Food Res. Technol., 2004, 219, 20–26 CrossRef.
- P. R. Roberts, J. D. Burney, K. W. Black and G. P. Zaloga, Digestion, 1999, 60, 332–337 Search PubMed.
| This journal is © The Royal Society of Chemistry 2018 |