 Open Access Article
Creative Commons Attribution 3.0 Unported Licence
Quality-by-Design approach to the fluid-bed coating of ginkgo lactone nanosuspensions
Jiawei Han†
ab,
Xin Wang†ab,
Jingxian Wangab,
Lingchong Wang ab,
Lihua Chenc,
Junsong Li
 *ab and
Wen Lia
aCollege of Pharmacy, Nanjing University of Chinese Medicine, 138 Xianlin Avenue, Nanjing 210023, PR China. E-mail: lijunsong1964@163.com; Fax: +86-25-85811517; Tel: +86-25-85811517
bJiangsu Provincial TCM Engineering Technology Research Center of High Efficient Drug Delivery System (DDS), Nanjing 210023, PR China
cCollege of Pharmacy, Jiangxi University of Traditional Chinese Medicine, 18 Yunwan Road, Nanchang 330004, PR China
First published on 15th June 2018
Abstract
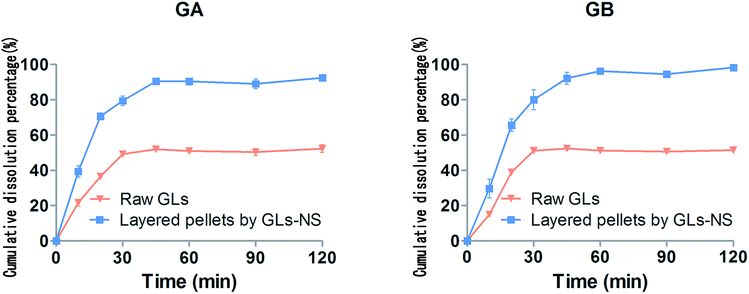
The Quality-by-Design (QbD) approach was employed to investigate the fluid-bed coating process for the conversion of ginkgo lactone (GL) liquid nanosuspensions into dried nanosuspensions. The effects of critical process variables including inlet air temperature, inlet air capacity and atomizing air pressure were investigated. The particle size and percent yield were optimized using a full factorial design. A Box-Behnken design (BBD) was employed to generate the response surface and optimize process conditions. Multi-linear regression and one-way ANOVA were used to analyze the relationship between critical variables and responses. The results showed that all three selected variables were significant factors (p < 0.05) affecting the particle size. Higher inlet temperature, inlet air capacity or atomizing air pressure will cause an increase of particle size. In addition, the percent yield primarily depended on the inlet air temperature and inlet air capacity (p < 0.05). A higher percent yield was obtained at a higher inlet air temperature or inlet air capacity. The optimal conditions for BBD, including inlet air temperature, inlet air capacity and atomizing air pressure, were set at 40 °C, 11.6 Nm3 and 0.7 bar, respectively. Compared with the raw GLs, the optimized products presented an amorphous state and possessed much faster dissolution. The particle size, percent yield, PDI, zeta-potential and redispersibility index of the optimized products were 254.3 ± 9.8 nm, 82.36 ± 1.87%, 0.155 ± 0.02, −32.9 ± 3.8 mV and 113 ± 4.4% (n = 3), respectively. These results indicate that fluid-bed coating technology based on a QbD approach was sufficient for the solidification of nanosuspensions.
Introduction
Nanosuspensions are colloidal dispersions of nanosized drug particles stabilized by surfactants. These dispersions can also be defined as biphasic systems comprising pure drug particles dispersed in aqueous media.1 A significant drawback of nanosuspensions is the physical and chemical instability of these materials in aqueous media, including agglomeration, sedimentation and crystalline transformation.2 Therefore, the solidification of nanosuspensions is considered as a key step in the production of the final nanosuspension form intended for oral delivery.Solidification methods for nanosuspensions typically include freeze-drying, spray drying, vacuum drying, fluid-bed drying, etc.3–6 Among these methods, fluid-bed coating is a “one-step” technique commonly used to add a film coating onto a substrate, and has widespread applications in the pharmaceutical industry. Fluid-bed coating involves the evaporation of a solvent and the simultaneous deposition of coating materials onto the surface of nonpareil pellets. Compared with conventional spray drying, fluid-bed coating is applicable at relatively lower temperatures and is less costly and time-consuming. Moreover, fluid-bed coating is more scalable.7,8 Thus, the solidification of nanosuspensions by fluid-bed coating is attractive and promising. However, the solidification of drug nanosuspensions by fluid-bed coating is also challenging because solidified formulations need to have the ability to reconstitute into their original nanosuspensions. Any material undergoing a drying process experiences significant stress. For example, a reduction in the solvent volume can lead to a decrease in the solubility of the surfactant or stabilizer, resulting in precipitation and rendering these unavailable for protection of the nanoparticles against aggregation. There are only a few studies7,9–11 on the fluid-bed drying of nanosuspensions, but no exhaustive study has been conducted to understand this process, particularly the impact of technological factors on redispersibility and percent yield.
Quality-by-Design (QbD) is a versatile and systematic approach mentioned in various documents of the International Conference on Harmonization (ICH) guidelines.12–14 This approach emphasizes the design/development and manufacture of formulations to ensure predefined product quality objectives.15 One of the important components of QbD is Design of Experiment (DoE).16 DoE is used to confirm significant and non-significant factors affecting product quality attributes. Moreover, this technique can be used to evaluate the relationships between those factors and define a product quality design space.17
Ginkgo lactones (GLs) have recently attracted considerable attention.18 These natural lactones could bind to the membrane receptors, inhibit the platelet-activating factor, and produce anticoagulant effect. GLs have long been used to protect against neural damage in a variety of circumstances.19 However, the poor water-solubility and low oral bioavailability of these natural compounds have greatly limited the formulation development and clinical application of GLs. Previous studies have demonstrated that nanosuspensions could enhance the oral bioavailability and bio-efficacy of GLs.20
Hence, the aim of the present study was to convert liquid nanosuspensions into dried nanosuspensions using fluid-bed coating technology. DoE, including a full factorial design and Box–Behnken, was employed in the present study. A full factorial design was used to understand the effects of the critical process parameters of fluid-bed coating and select the main factors with significant effects. Box–Behnken design (BBD) is a response surface methodology combining mathematical and statistical methods. BBD is used to establish the model and analyze multiple variables, and the objective is to optimize process conditions. Inlet air temperature, inlet air capacity and atomizing air pressure were selected as critical process variables, whereas particle size and percent yield were examined as responses. ANOVA and multifactorial analysis were performed to elucidate the interactions between critical variables, to rank order the critical variables, and to provide a predictive model for pellet-coating using fluid-bed technology. The particle size, redispersibility index (RDI), differential scanning calorimetry (DSC), power X-ray diffraction (PXRD), scanning electron microscopy (SEM) and in vitro dissolution were employed to characterize and evaluate dried nanosuspensions under optimal conditions.
Materials and methods
Materials
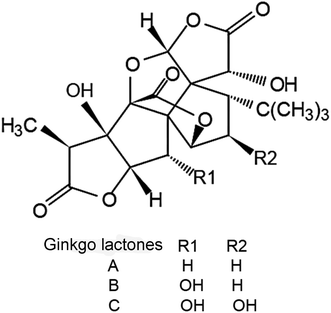
GLs containing ginkgolide A (GA) (35.0%) and ginkgolide B (GB) (62.2%) were purchased from Nanjing Zixi Biological Products Co., Ltd (Nanjing, China), and chemical structures of ginkgo lactones are shown in Fig. 1. Hydroxypropyl methyl cellulose (HPMC) was provided by BASF (Ludwigshafen, Germany). Sodium dodecyl sulfate (SDS) was provided by Aladdin Industrial Co., Ltd. (Shanghai, China). Microcrystalline cellulose (MCC) pellets (0.50–0.71 mm in diameter) were purchased from Gaocheng Biotech and Health Co, Ltd (Hangzhou, China). Deionized water was prepared using the Synergy® UV water purification system (Millipore, Billerica, MA, USA). Other reagents were of analytical grade.Preparation of liquid ginkgo lactones nanosuspensions
The liquid GLs nanosuspensions (GLs-NS) were prepared using a wet media milling (top–down) approach. Briefly, 800 mg of raw GLs was dispersed in 200 mL aqueous solution containing 0.2% (w/v) HPMC and 0.2% (w/v) SDS under magnetic stirring. The obtained mixture was disintegrated into microparticles using a high shear homogenizer (BRT, B25, Germany) at 16![[thin space (1/6-em)]](https://www.rsc.org/images/entities/char_2009.gif) 000 rpm for 5 min. The resulting suspensions were subsequently wet-milled with zirconium oxide beads (0.3–0.4 mm in diameter) using an N T-0.3 L Mill (Dongguan Longly Machinery Factory, China) and milled for 2 h at 2400 rpm to finally obtain liquid GLs-NS. The processing temperature was maintained at less than 20 °C by passing cooled water through the outer jacket.
000 rpm for 5 min. The resulting suspensions were subsequently wet-milled with zirconium oxide beads (0.3–0.4 mm in diameter) using an N T-0.3 L Mill (Dongguan Longly Machinery Factory, China) and milled for 2 h at 2400 rpm to finally obtain liquid GLs-NS. The processing temperature was maintained at less than 20 °C by passing cooled water through the outer jacket.
Coating the liquid nanosuspensions onto pellets
The layered pellets were produced by coating the liquid GLs-NS onto MCC pellets as nonpareil pellets using a fluid-bed coater with a bottom spray (Mini-Glatt, Glatt GmbH, Binzen, Germany). Briefly, 2% (w/v) lactose, as a drying protector, was added to liquid GLs-NS. The dispersion was sprayed through a nozzle (0.5 mm in diameter) onto the surface of the MCC pellets in the fluid-bed coater. The fluid-bed coating was pre-conditioned at the required setting of inlet air temperature, inlet air capacity (namely the drying capacity of the fluidized air) and atomizing air pressure. The rotational speed of the peristaltic pump was maintained at 3 rpm. After fluid-bed coating, the pellets were dried in a coating chamber at 30 °C for an additional 15 minutes to obtain the layered pellets. The dried samples were removed from the coating chamber using a plastic scraper and stored between 2 and 8 °C till further analysis.Experimental design
Based on preliminary experiments, the inlet air temperature, inlet air capacity and atomizing air pressure were selected as important fluid-bed coating process variables. Besides, polydispersity index (PDI) and zeta-potential of GLs-NS were all less than 0.2 and −30 mV pre- and post-coating, respectively. So particle size and percent yield were selected as evaluation index (data not shown). All liquid GLs-NS were prepared using a wet media milling approach as mentioned above. A full factorial design 33 (3 factors at 3 levels) was used to select significant factors. The three independent variables used at three levels in this investigation were: inlet air temperature (40–60 °C); inlet air capacity (10–20 Nm3); and atomizing air pressure (0.4–0.8 bar). Four center points were added to the design space to identify non-linearity relationship in the responses. All operating conditions were confirmed as achievable. All experiments were completely randomized to reduce systematic errors, and 200 mL of liquid GLs-NS were used for coating under different processing conditions (according to design space). Multi-linear regression and ANOVA were performed to analyze the relationships between critical variables and responses.Based on a full factorial design, a response surface methodology was adopted to optimize the coating process using the BBD. The whole design comprised 17 experimental points, and the experiment was conducted in random order. All trials were performed in triplicate, and each trial was optimized using critical response parameters, such as Y1: particle size; Y2: percent yield.
All experimental design and data analysis were achieved using Design-Expert 8 (Stat-ease®) software.
Particle size analysis of reconstituted nanosuspensions
The layered pellets (1 g) were dispersed in 20 mL of purified water, and the mixture was stirred with a paddle at 100 rpm for 5 min. Prior to measurement, the samples were passed through a 50-mesh sieve to remove the MCC inert cores, since MCC pellet did not dissolve and disintegrate in contact with purified water.21,22 Preliminary experiments revealed that MCC pellet did not affect the reconstitution test.The particle size and polydispersity index (PDI) were measured using photon correlation spectroscopy (PCS) using a Zetasizer (Nano-ZS90, Malvern Instruments Ltd., Worcestershire, UK) at 25 °C pre- and post-coating. Each sample was analyzed in triplicate, and the results were reported as the mean value of these runs.
Determination of percent yield
To calculate the percent yield, the drug amount in layered pellets and liquid GLs-NS were determined using an HPLC-UV method (as described for in vitro dissolution). The percent yield was calculated using the following formula:| Percent yield = (W0/W1) × 100 | (1) |
Characterization and in vitro evaluation of the dried GLs-NS or layed pellets under optimum conditions
| RDI = (D/D0) × 100% | (2) |
HPLC was performed using a Waters 2695 HPLC system (Waters, Milford, UK), equipped with an evaporative light-scattering detector (ELSD). The analytes were separated on a Kromasil C18 column (250 × 4.6 mm, 5 μm) maintained at 35 °C. The mobile phase was composed of methanol and water at a ratio of 36/64 (v/v) using an isocratic elution (1.0 mL min−1) for 18 min.
Results and discussion
Influence of fluid-bed coating variables on aggregation/particle size
As shown in Table 1, the particle size of GLs-NS redispersed from layered pellets varied from 248.10 to 425.30 nm using a full factorial design (PDI less than 0.2). The particle sizes of the liquid GLs-NS prior to coating were approximately 225 nm (PDI less than 0.2).| Sample number | Experimental conditions | Results | |||
|---|---|---|---|---|---|
| Inlet air temperature (°C) | Inlet air capacity (Nm3) | Atomizing air pressure (bar) | Y1: particle size (nm) | Y2: percent yield | |
| 1 | 40 | 20 | 0.4 | 281.83 | 78.45 |
| 2 | 50 | 15 | 0.6 | 282.93 | 78.63 |
| 3 | 60 | 20 | 0.8 | 425.30 | 65.94 |
| 4 | 60 | 20 | 0.4 | 395.63 | 67.18 |
| 5 | 60 | 10 | 0.4 | 280.07 | 78.76 |
| 6 | 60 | 10 | 0.8 | 323.50 | 70.87 |
| 7 | 40 | 20 | 0.8 | 259.80 | 79.02 |
| 8 | 40 | 10 | 0.4 | 248.10 | 83.42 |
| 9 | 40 | 10 | 0.8 | 297.53 | 78.59 |
| 10 | 50 | 15 | 0.6 | 292.10 | 75.48 |
| 11 | 50 | 15 | 0.6 | 288.47 | 74.30 |
| 12 | 50 | 15 | 0.6 | 271.40 | 79.51 |
As shown in Table 2, all selected variables, such as the inlet air temperature, inlet air capacity, and atomizing air pressure significantly influenced the particle size (p < 0.05).
| Source | Sum of squares | df | Mean square | F value | p-value prob > F | |
|---|---|---|---|---|---|---|
| Model | 28![[thin space (1/6-em)]](https://www.rsc.org/images/entities/char_2009.gif) 202.48 202.48 |
5 | 5640.50 | 30.58 | 0.0009 | Significant |
| A – inlet air temperature | 14![[thin space (1/6-em)]](https://www.rsc.org/images/entities/char_2009.gif) 215.80 215.80 |
1 | 14![[thin space (1/6-em)]](https://www.rsc.org/images/entities/char_2009.gif) 215.79 215.79 |
77.06 | 0.0003 | |
| B – inter air capacity | 5690.67 | 1 | 5690.68 | 30.85 | 0.0026 | |
| C – atomizing air pressure | 1262.53 | 1 | 1262.53 | 6.84 | 0.0473 | |
| AB | 6125.40 | 1 | 6125.40 | 33.20 | 0.0022 | |
| BC | 908.09 | 1 | 908.09 | 4.92 | 0.0773 | |
| Curvature | 2439.49 | 1 | 2439.49 | 13.22 | 0.0150 | Significant |
| Residual | 922.38 | 5 | 184.48 | |||
| Lack of fit | 677.22 | 2 | 338.61 | 4.14 | 0.1370 | Not significant |
| Pure error | 245.16 | 3 | 81.72 | |||
| Cor total | 31![[thin space (1/6-em)]](https://www.rsc.org/images/entities/char_2009.gif) 564.35 564.35 |
11 |
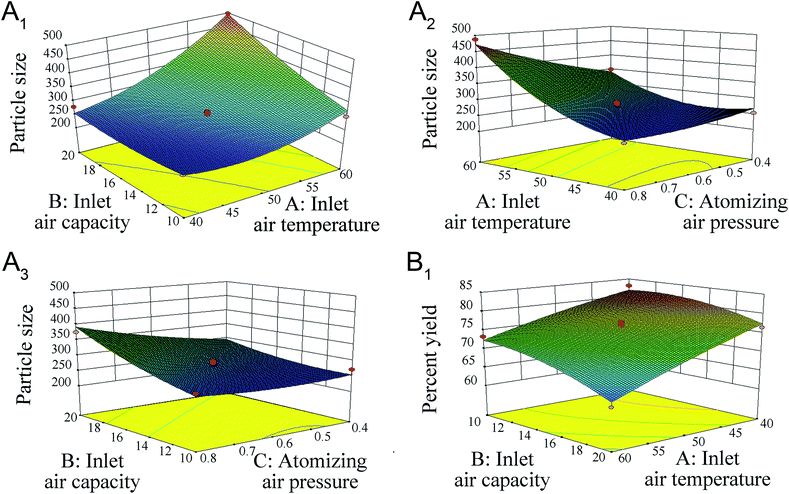
Higher inlet temperature induced further aggregation, as shown by the increase in particle size (correlation: 0.671) (Fig. 2A1), which might reflect the Ostwald ripening during the evaporation of water.
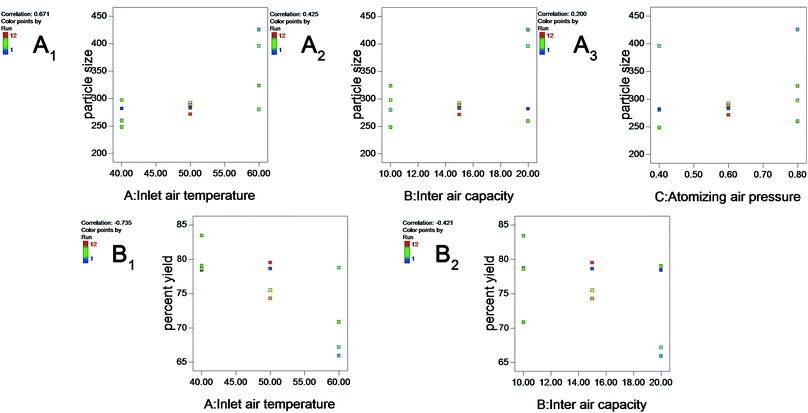 | ||
| Fig. 2 Plots showing the effect of inlet air temperature (A), inlet air capacity (B) and atomizing air pressure (C) on particle size (A1–A3) and percent yield (B1 and B2). | ||
Fig. 2A2 shows that a larger inlet air capacity could increase the size particle (correlation: 0.425). One explanation for this phenomenon might be that the higher inlet air capacity increases the product temperature. In addition, two-way interactions between critical variables in the coating process (inlet air temperature × in inlet air capacity) were significant (p < 0.05), reflecting the inter dependency of the variables.
Moreover, Table 2 shows that the curvature is significant (p < 0.05), indicating that the effects of these variables might be non-linearity. Therefore, a Box–Behnken design was used to optimize these processes and devices.
Influence of fluid-bed coating process variables on percent yield
As shown in Table 1, the percent yield varied from 65.94% to 83.42%. Two main factors were significant, inlet air temperature and inlet air capacity (p < 0.05), as shown in Table 3. The increase in inlet air temperature and inlet air capacity decreased the percent yield of the layered pellets (the correlations are −0.735 and −0.421, respectively) (Fig. 2B1 and B2). The observed decrease in yield with increasing inlet air temperature might reflect the fact that a high temperature could accelerate the water evaporation of nanosuspensions, resulting in powder formation and the failure to coat the surface of the pellets. However, an inlet air temperature less than 40 °C could cause the pellets to adhere to each other and decrease the percent yield.| Source | Sum of squares | df | Mean square | F value | p-value prob > F | |
|---|---|---|---|---|---|---|
| Model | 0.025 | 3 | 0.008 | 9.96 | 0.006 | Significant |
| A – inlet air temperature | 0.017 | 1 | 0.017 | 20.44 | 0.003 | |
| B – inter air capacity | 0.006 | 1 | 0.006 | 6.72 | 0.04 | |
| C – atomizing air pressure | 0.002 | 1 | 0.002 | 2.72 | 0.143 | |
| Curvature | 0.001 | 1 | 0.001 | 0.94 | 0.366 | Not significant |
| Residual | 0.006 | 7 | 0.001 | |||
| Lack of fit | 0.004 | 4 | 0.001 | 1.58 | 0.368 | Not significant |
| Pure error | 0.002 | 3 | 0.001 | |||
| Cor total | 0.031 | 11 |
Increasing the inlet air capacity decreased the yield as a result of complete drying (higher product temperature with higher inlet air capacity) and a consequent reduction in loss of power to the walls of the fluid-bed rather than the pellets.
Box–Behnken design to obtain the response surface for particle size and percent yield
The BBD space and experiment results are shown in Table 4. A total of 17 runs were conducted to optimize the three parameters. The best-fit model was the quadratic model for each response. The coefficients of the quadratic models and the corresponding p-values are shown in Table 5.| Sample number | Experimental conditions | Results | |||
|---|---|---|---|---|---|
| Inlet air temperature (°C) | Inlet air capacity (Nm3) | Atomizing air pressure (bar) | Y1: particle size (nm) | Y2: percent yield | |
| 1 | 50 | 10 | 0.4 | 270.70 | 75.00 |
| 2 | 40 | 20 | 0.6 | 280.37 | 76.37 |
| 3 | 50 | 20 | 0.4 | 287.90 | 71.86 |
| 4 | 50 | 20 | 0.8 | 374.90 | 70.59 |
| 5 | 60 | 15 | 0.4 | 349.60 | 67.70 |
| 6 | 50 | 15 | 0.6 | 271.40 | 76.65 |
| 7 | 50 | 15 | 0.6 | 259.70 | 77.58 |
| 8 | 40 | 10 | 0.6 | 256.60 | 83.08 |
| 9 | 50 | 15 | 0.6 | 282.93 | 77.20 |
| 10 | 50 | 15 | 0.6 | 288.47 | 74.30 |
| 11 | 50 | 10 | 0.8 | 271.60 | 75.95 |
| 12 | 50 | 15 | 0.6 | 292.10 | 75.48 |
| 13 | 60 | 15 | 0.8 | 488.27 | 70.29 |
| 14 | 40 | 15 | 0.8 | 234.00 | 80.73 |
| 15 | 60 | 20 | 0.6 | 498.07 | 62.59 |
| 16 | 60 | 10 | 0.6 | 299.70 | 73.25 |
| 17 | 40 | 15 | 0.4 | 252.50 | 79.51 |
| Source | Y1: particle size | Y2: percent yield | |||
|---|---|---|---|---|---|
| F value | p-value prob > F | F value | p-value prob > F | ||
| a Values in bold face represented significant terms (p < 0.05). Y1: correlation coefficient (R2) = 0.9668, adj. R2 = 0.9240. Y2: correlation coefficient (R2) = 0.9509, adj. R2 = 0.8878. | |||||
| Model | 22.62 | 0.0002 | 15.07 | 0.0009 | Significant |
| A – inlet air temperature | 103.98 | <0.0001 | 94.86 | <0.0001 | |
| B – intet air capacity | 32.57 | 0.0007 | 30.19 | 0.0009 | |
| C – atomizing air pressure | 12.01 | 0.0105 | 0.55 | 0.4808 | |
| AB | 16.92 | 0.0045 | 1.41 | 0.2739 | |
| AC | 13.71 | 0.0076 | 0.17 | 0.6938 | |
| BC | 4.11 | 0.0821 | 0.44 | 0.5263 | |
| A2 | 16.71 | 0.0046 | 0.56 | 0.4794 | |
| B2 | 1.45 | 0.2670 | 4.99 | 0.0607 | |
| C2 | 0.91 | 0.3712 | 1.77 | 0.2253 | |
| Lack of fit | 4.61 | 0.0869 | 2.24 | 0.2255 | Not significant |
For the Y1 response, the experimental results were fitted into a second-order 300 polynomial equation:
| Particle size = 278.92 + 76.52A + 42.83B + 26.01C + 43.65AB + 39.29AC + 21.52BC + 42.29A2 + 12.47B2 + 9.88C2 | (3) |
The regression coefficient values of eqn (3) are listed in Table 5. The inlet air temperature (A), inlet air capacity (B), atomizing air pressure (C), inlet air temperature × inlet air capacity (AB), inlet air temperature × atomizing air pressure (AC) and inlet air temperature × inlet air temperature (A2) parameters were significant at both p < 0.05 and p < 0.01. Three-dimensional response surface plots of the response variables of Y1 at different inlet air temperatures, inlet air capacities, and atomizing air pressures are shown in Fig. 3A1–A3, respectively.
For the Y2 response, the experimental results were fitted into a second-order polynomial equation:
| Percent yield = 0.76–0.057A − 0.032B + 4.381E − 003C − 9.880E − 003AB + 3.415E − 003AC − 5.548E − 003BC − 6.059E − 003A2 − 0.018B2 − 0.011C2 | (4) |
In this case, A and B were significant model terms. The surface response for percent yield is shown in Fig. 3B1.
The values of the coefficient determination (Y1: R2 = 0.9668; Y2: R2 = 0.9509) and the adjusted coefficient determination (Y1: adj. R2 = 0.9240; Y2: adj. R2 = 0.8878) of the predicted model in this response indicates a high degree of correlation between the observed and predicted values. The usability of the model was assessed using the following optimal conditions: an inlet air temperature of 40 °C, an inlet air capacity of 11.6 Nm3 and an atomizing air pressure of 0.7 bar. Under the optimal conditions, the particle size and the percent yield of layered pellets were 254.3 ± 9.8 nm and 82.36 ± 1.87% (n = 3), respectively, consistent with the predicted values (236.34 nm and 81.86%) obtained from the model. Besides, the PDI, zeta-potential and drug content of the layered pellets also measured with 0.155 ± 0.02, −32.9 ± 3.8 mV and 10.88 ± 0.03% (n = 3). These results demonstrated the validity of the model. Then, the optimal conditions were selected to prepare 3 batches of products dried GLs-Ns.
Characterization and in vitro evaluation of dried GLs-NS or layered pellets under optimum conditions
As shown in Fig. 4A, the raw GLs showed diffraction peaks at 8.34 and 9.66, ranging from 2–40° (2θ), suggesting that the drug was highly crystalline in nature. The same diffraction peaks were also observed in samples of the physical mixture. However, the PXRD patterns for the dried GLs-NS prepared via fluid-bed coating did not show any diffraction peaks at the same temperature, suggesting that the drug particles were present in an amorphous state. The DSC pattern (Fig. 4B) confirmed the results obtained by PXRD. At approximately 343 °C, the endothermic peaks of the raw GLs and the physical mixture were observed, whereas the melting peak was absent from the dried nanosuspensions. However, another raw GLs melting peak (166 °C) disappeared from the thermograms of physical mixture, indicating that the melting peak of raw GLs could be influenced by the formulations. Based on the results of DSC and PXRD, the dried drug particles in the nanosuspensions prepared via fluid-bed coating are present in an amorphous state.
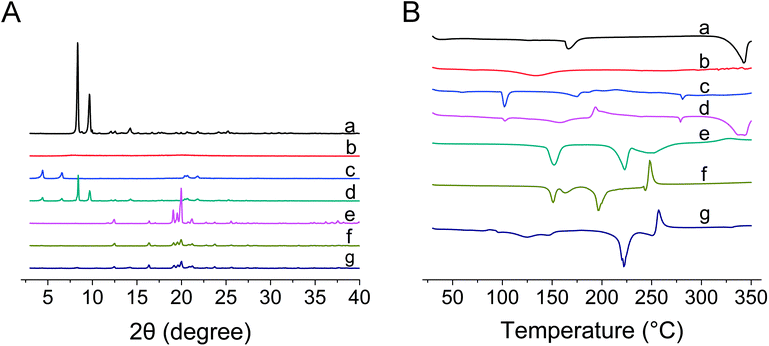 | ||
| Fig. 4 PXRD (A) and DSC (B) results of the raw GLs (a), HPMC (b), SDS (c), physical mixture of GLs with lactose (d), lactose (e), blank MCC pellet powder (f), layered pellet powder of GLs-NS (g). | ||
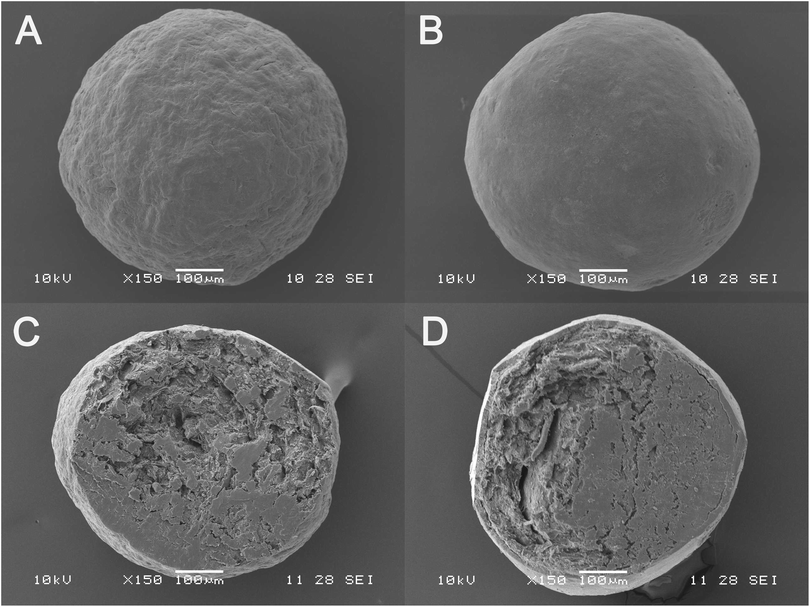
The morphology of MCC pellets, the layered pellets and cross-section of MCC pellets and layered pellets under the optimal conditions using SEM is shown in Fig. 5. Compared with the MCC pellet (Fig. 5A), the surface of layered pellet (Fig. 5B) is smoother, indicating that the MCC pellet is tightly coated by GLs-NS. The cross-section of MCC pellet and layered pellet could be clearly observed in Fig. 5C and D. The cross-section view indicates a shell of compact coating of GLs-NS around the MCC pellets core (Fig. 5D).
Conclusion
In the present study, dried GLs-NS was prepared by directly layering liquid nanosuspension onto the surface of MCC pellets using a fluid-bed process. A QbD approach was successfully applied to the fluid-bed coating of GLs-NS to obtain a better understanding of the fluid-bed coating process of nanosuspensions. The results showed that all three selected variables were significant factors (p < 0.05) affecting particle size. Higher inlet temperature, inlet air capacity or atomizing air pressure increased the particle size. Notably, the percent yield primarily depended on the inlet air temperature and inlet air capacity (p < 0.05). Higher percent yield was obtained with higher inlet air temperature or inlet air capacity. The optimal conditions for BBD, including inlet air temperature, inlet air capacity and atomizing air pressure, were set at 40 °C, 11.6 Nm3 and 0.7 bar, respectively. Compared with raw GLs, the products prepared under these optimum conditions were present in an amorphous state and possessed much faster dissolution. The particle size, percent yield, PDI, zeta-potential and redispersibility index of the product were determined as 254.3 ± 9.8 nm, 82.36 ± 1.87%, 0.155 ± 0.02, −32.9 ± 3.8 mV and 113 ± 4.4% (n = 3), respectively. These results suggested that fluid-bed coating technology following a QbD approach was suitable for the solidification of nanosuspensions.Conflicts of interest
The authors declare no conflicts of interest.Acknowledgements
This study was financially supported by the Priority Academic Program Development (PAPD) fund of the Jiangsu Higher Education Institution and by the Natural Science Foundation of Jiangsu Province (No. BK20141465).References
- F. Kesisoglou, S. Panmai and Y. Wu, Adv. Drug Delivery Rev., 2007, 59, 631–644 CrossRef PubMed.
- Y. Wang, L. Zhang, Q. W. Wang and D. R. Zhang, J. Controlled Release, 2013, 172, 1126–1141 CrossRef PubMed.
- B. H. Wang, W. B. Zhang and W. Zhang, Drying Technol., 2005, 23, 7–32 CrossRef.
- R. H. Müller, J. Möschwitzer and F. N. Bushrab, Drugs Pharm. Sci., 2006, 159, 21–51 Search PubMed.
- J. Lee and C. Yu, J. Controlled Release, 2006, 111, 185–192 CrossRef PubMed.
- B. V. Eerdenbrugh, G. V. D. Mooter and P. Augustijns, Int. J. Pharm., 2008, 364, 64–75 CrossRef PubMed.
- W. He, Y. Lu, J. Qi, L. Yin and W. Wu, Int. J. Nanomed., 2013, 8, 3119–3128 Search PubMed.
- R. Dixit and S. Puthli, J. Pharm. Sci., 2009, 98(11), 3933–3960 CrossRef PubMed.
- Q. Yao, X. G. Tao, B. Tian, Y. L. Tang, Y. J. Shao and L. F. Kou, et al., Colloids Surf., B, 2014, 113, 92–100 CrossRef PubMed.
- Y. Luo, L. Xu, X. Tao, M. Xu, J. Feng and X. Tang, Drug Dev. Ind. Pharm., 2013, 39(7), 936–946 CrossRef PubMed.
- K. Pieterjan, A. Michaël and V. D. M. Guy, J. Pharm. Pharmacol., 2011, 63, 1446–1453 CrossRef PubMed.
- ICH, International Conference on Harmonisation (ICH) of technical requirements for registration of pharmaceuticals for human use, Topic Q9: Pharmaceutical quality system, Geneva, 2005 Search PubMed.
- ICH, International Conference on Harmonisation (ICH) of technical requirements for registration of pharmaceuticals for human use, Topic Q10: Pharmaceutical quality system, Geneva, 2008 Search PubMed.
- ICH, International Conference on Harmonisation (ICH) of technical requirements for registration of pharmaceuticals for human use, Topic Q8 (R2): Pharmaceutical development, Geneva, 2009 Search PubMed.
- L. X. Yu, Pharm. Res., 2008, 25, 781–791 CrossRef PubMed.
- T. Tol, N. Kadam, N. Raotole, A. Desai and G. Samanta, J. Chromatogr. A., 2015, 1432, 26–38 CrossRef PubMed.
- M. Mcdermott, S. Chatterjee, X. Hu, A. Ash-Shakoor, R. Avery and A. Belyaeva, et al., AAPS PharmSciTech, 2015, 16, 1–13 CrossRef PubMed.
- T. A. V. Beek and P. Montoro, J. Chromatogr. A., 2009, 1216, 2002–2032 CrossRef PubMed.
- K. M. Maclennan, C. L. Darlington and P. F. Smith, Prog. Neurobiol., 2002, 67, 235–257 CrossRef PubMed.
- T. Q. Rui, L. Zhang, H. Z. Qiao, P. Huang, S. Qian and J. S. Li, et al., J. Pharm. Sci., 2015, 105(1), 242–249 CrossRef PubMed.
- C. E. Figueroa and S. Bose, Eur. J. Pharm. Biopharm., 2013, 85, 1046–1055 CrossRef PubMed.
- J. Parmentier, E. H. Tan, A. Low and J. P. Möschwitzer, Int. J. Pharm., 2017, 524, 443–453 CrossRef PubMed.
- P. F. Yue, J. Wan, Y. Wang, Y. Li, Y. Q. Ma and M. Yang, et al., Int. J. Pharm., 2013, 443(1–2), 279–287 CrossRef PubMed.
- Chinese Pharmacopoeia Commission, Chinese Pharmacopoeia, BeijingChina Medical Science Press, 2015 Search PubMed.
- Y. Hattori, Y. Haruna and M. Otsuka, Colloids Surf., B, 2013, 102, 227–231 CrossRef PubMed.
Footnote |
| † Contributed equally. |
| This journal is © The Royal Society of Chemistry 2018 |

