
 Open Access Article
 This Open Access Article is licensed under a Creative Commons Attribution-Non Commercial 3.0 Unported Licence
Application of diffuse reflectance near-infrared spectrometry and chemometrics in characterization of micro and mesoporous ZSM-5 zeolites
Shahin Amania,
Amir Bagheri Garmarudi *a,
Mohammadreza Khanmohammadia and
Fereydoon Yaripourb
*a,
Mohammadreza Khanmohammadia and
Fereydoon Yaripourb
aDepartment of Chemistry, Faculty of Science, Imam Khomeini International University, Qazvin, Iran. E-mail: bagheri@sci.ikiu.ac.ir
bCatalysis Research Group, Petrochemical Research & Technology Company NPC, Tehran, Iran
First published on 10th October 2018
Abstract
Evaluation of porosity type of zeolites is one of the critical topics in catalysis science. The relationship between external surface area and diffuse reflectance (DR) spectra in the near-infrared spectral region has been employed to propose a method for estimation of micro or mesoporosity in ZSM-5 zeolite samples. Linear discriminant analysis (LDA) was utilized to estimate degree of porosity based on near-infrared diffuse reflectance spectra. The textural properties (surface area and pore volume) of micro and mesoporous ZSM-5 samples were measured using N2 adsorption/desorption technique at 77 K and external surface area was calculated by t-plot as a reference method in this work. Several porous ZSM-5 samples with only microporous channels or mesoporous besides them were classified in terms of external surface area and meso pore volume derived from t-plot as “Micro” or “Micro + Meso” type samples. It was concluded that LDA using the PCA for feature selection is capable of generalization and could precisely predict the type of porosity in ZSM-5 zeolites.
Introduction
Aluminosilicate H-ZSM-5 zeolite is one of the most important catalysts which has been widely used in the petrochemical industry due to its strong acid sites and large active surfaces. This catalyst contains uniform microporous networks which enable size- and shape-selective catalysis.1,2 Nevertheless, the unique presence of the microporous network with aperture diameters below 2 nm also imposes significant diffusion limitation on reactions that can cause high back pressure on flow systems.3,4 Ordered mesoporous aluminosilicates with pore size between 2 and 50 nm are structures with developed pore architecture to solve the diffusion limitation drawback associated with conventional microporous zeolites which permits faster migration of the reactant and product molecules to and from the active sites and enhanced accessibility for larger molecules and viscous fluids with the remarkable stability, catalytic activity and selectivity of zeolites.3–9 Investigation and ascertainment of mesoporous and microporous structures is important in the field of catalyst design and development. Presence of mesopores in the zeolite crystallites would increase the external surface of the zeolite in addition with increasing the meso pore volume.10 In spite of several researches, the distinction between external and internal surfaces is not always clear and various definitions have been offered to external surface.11 Kaliaguine et al. have proposed the most appropriate definition of external surface area (Sex) with regard to their quantification model of XPS data which is based on the overall BET) Brunauer–Emmett–Teller (surface area without the contribution of micropores.11 Several techniques have been devised to determine external surface area (Sex) mainly based on physisorption methods. t-Plot,12 αs-method13 and conventional nitrogen BET technique of the remaining surface area have been used for this aim after plugging the micropores with a strong adsorbent prior to determination for series of zeolites including ZSM-5.11,14,15 However, performing these approaches is rather difficult because of the lack availability in reference material, unsuitability of the pore-filling sorbent and experimental conditions.11 In addition, they are expensive and time consuming. Near-infrared spectrometry has been extensively used for physicochemical characterisation studies such as estimation of particle size and size distribution,16,17 surface area analysis,18,19 attaining information about surface morphology of sample20 and determination of the bulk properties of viscosity and plasticity indices21 utilizing chemometrics approaches. In this work it has been attempt to propose a correlation between the external surface area and consequently micro or mesoporosity of zeolite samples according to literature10,14,15 together with their near infrared (NIR) spectra obtained in hydrated form. The relationship between the external surface area and near-infrared diffuse reflectance spectra is mainly based on the silanol absorbance bands which located on the external surface in H-ZSM-5. Also the surface hydroxyl groups related to the surface adsorbed water are proportional to zeolite's external surface area and consequently micro or mesoporosity of zeolite samples.18,22 This spectral correlation in combination with linear discriminant analysis (LDA) has been employed to build a classification model on the basis of a reduced subset of variables (wavenumbers). Feature extraction was performed by principal component analysis (PCA) and genetic algorithm (GA). Diffuse reflectance infrared Fourier transform (DRIFT) technique was employed which provides much higher sensitivity for weak bands in comparison with the common transmission sampling routes.Experimental
Sampling and analysis
Total number of ninety ZSM-5 zeolite samples was provided from nine different original sources by weighting different proportions of samples. Five different types of commercially available (from Petrochemical Research and Technology Company, Tehran, Iran) zeolite samples were labelled as (P1–P5) and remaining 4 types of samples were prepared in laboratory by different fabrication procedures as indicated in Table 1 (S1–S4). These nine original samples with different porosity situation were then used to prepare two sets of ZSM-5 samples of varying porosity as microporous “Micro” or mesoporous “Micro + Meso” classes. One set of zeolites containing 40 different mixtures of mesoporous samples which have been produced by weighting different proportions of the four primary mesoporous samples (P1, P2, P3 and S4) and the second set of zeolites containing 50 different mixtures of microporous samples which have been prepared by weighting different proportions of the five microporous samples (P4, P5, S1, S2 and S3) and the near infrared spectra of the mixtures were measured according to previously report.18 An AB-Bomem (MB 160D, Quebec, Canada) NIR instrument with quartz halogen source and the optional TE-cooled InAs detector was employed to record the NIR spectra using spectratech diffuse reflectance cell. Diffuse reflectance spectra were recorded with a resolution of 8 cm −1, cumulating 16 scans over the 4000–8000 cm−1 spectral region with air as the background, being exported from the WINFIRST software. The background spectrum was acquired from the integrating sphere using the same instrumental conditions employed for real samples. High background stability was observed in all the cases. Therefore, it was not necessary to scan a new background spectrum after the analysis of each sample.| Characteristic | Porosity situation | SBET (m2 g−1) | SMicro (m2 g−1) | SMeso (m2 g−1) | VTotal (cm3 g−1) | VMicro (cm3 g−1) | VMeso (cm3 g−1) | Origin |
|---|---|---|---|---|---|---|---|---|
| Sample | ||||||||
| P1 | Micro + Meso | 382.9 | 272.2 | 110.7 | 0.320 | 0.125 | 0.195 | Commercial |
| P2 | Micro + Meso | 382.8 | 240.5 | 142.3 | 0.417 | 0.102 | 0.315 | Commercial |
| P3 | Micro + Meso | 366.9 | 250 | 116.9 | 0.321 | 0.109 | 0.212 | Commercial |
| P4 | Micro | 289.1 | 261.6 | 27.5 | 0.167 | 0.124 | 0.043 | Commercial |
| P5 | Micro | 355.6 | 311.3 | 44.3 | 0.218 | 0.147 | 0.071 | Commercial |
| S1 | Micro | 388.8 | 364.6 | 24.2 | 0.198 | 0.160 | 0.038 | Synthesized |
| S2 | Micro | 372.6 | 361.1 | 11.5 | 0.177 | 0.152 | 0.025 | Synthesized |
| S3 | Micro | 362.2 | 337.1 | 25.1 | 0.191 | 0.149 | 0.042 | Synthesized |
| S4 | Micro + Meso | 264 | 129.3 | 134.7 | 0.387 | 0.091 | 0.296 | Synthesized |
For each sample, the sample was leveled to achieve a spectrum of sample and in order to prevent the cell contamination, the steel setup compartment was cleaned using acetone and soft tissue after acquisition of each sample's spectrum. Also for each sample, 3 replicated spectra were recorded, being overlaid to be ensured of the repeatability. The average was used for data processing. The textural properties of the samples were measured using N2 adsorption/desorption technique at 77 K on NOVA2000 Quanta-Chrome USA instrument. Chemometric data processing was developed by in-house programs in MATLAB v.8.1 (Math Works Inc).
Data set and data processing
NIR spectra of 90 different porous ZSM-5 samples were splitted in 2 subsets in terms of micro (class 1) or mesoporosity (class 2) according to N2 adsorption/desorption data obtained at 77 K. The Kennard–Stone (KS) algorithm was utilized to optimum splitting of the samples into training and test subsets. In this regard, 50 samples were selected to form the training set while remaining 40 ZSM-5 samples were considered as independent test set for the evaluation of the constructed models. The samples included in training and test sets were achieved from mixing of micro or meso samples with different ratios as mentioned above. So that the samples in each of the sets were independent for example with mixing sample S1 and P4 by 1–1 ratios, the new micro sample was created which it was independent of previous S1 and P4 samples. The first step in chemometric data treatment was to evaluate the data set by principal component analysis (PCA). Then multiplicative scatter correction (MSC) pre-treatment and vector normalization were conducted. In order to achieve a reliable discrimination between different porous ZSM-5 types supervised pattern recognition procedures were performed.Raw and pre-processed spectra were evaluated by soft independent modelling of class analogy (SIMCA) and linear discriminant analysis (LDA) methods after PCA variable extraction in terms of overall classification errors.
Results and discussion
Porosity determination by BET and t-plot
Prior to porosity analysis, all the samples were kept at 300 °C under N2 atmosphere for 3 h. Conventional Brunauer–Emmet–Teller (BET) equation was used to calculate the specific surface area (Stotal) from the linear part of plot according to IUPAC recommendations (adsorption data in P/Po = 0.05–0.25).23 Total pore volume (VTotal) was set based on adsorbed nitrogen volume at P/Po = 0.99. The micropore area (SMicro) and micropore volume (VMicro) were calculated from the t-plot curve. Barrett–Joyner–Halenda (BJH) method was conducted on the adsorption branch of the isotherm to depict. Mesopore volume (VMeso) was determined as the difference between calculated total volume and the corresponding micropore volume. Table 1 reveals total surface area, external surface area, micropore and mesopore volumes of the typical sample from 9 primary different type of zeolite which have been calculated from the N2 adsorption/desorption isotherms (Fig. 1). It is notable that the values were included in the Table 1 correspond to only one N2 adsorption–desorption measurement. As seen in Fig. 1 mesoporous samples exhibit a loop representing the mesoporosity in adsorption–desorption diagrams. The S1, P4 and P5 samples are Intrinsically microporous zeolite ZSM-5 and the hysteresis loop should not present in microporous zeolite. But these zeolites are nano zeolite samples.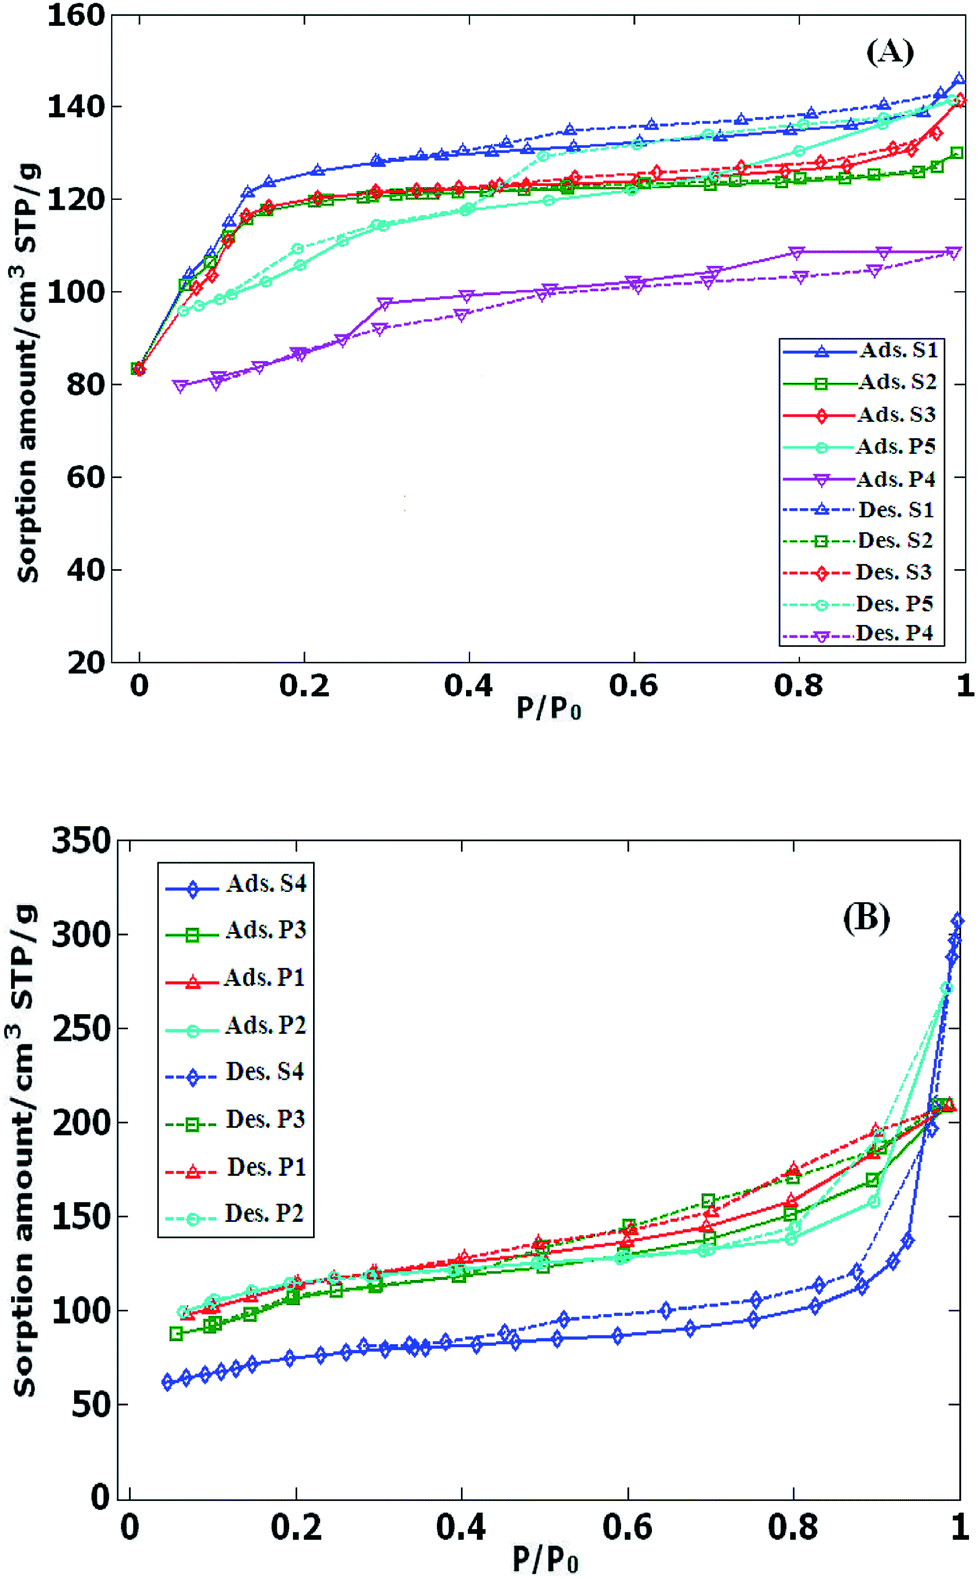 | ||
| Fig. 1 Nitrogen adsorption/desorption isotherms of (A) microporous and (B) mesoporous ZSM-5 samples at 77 K, solid line: adsorption, dash line: desorption. | ||
In nano zeolite samples in synthesis conditions the inter crystalline pores are likely formed. The dimensions of the inter crystalline pores is (2–50 nm) which would be in mesoporous range. In consequently in S1, P4 and P5 isotherms although they are microporous ZSM-5 in nature, mesoporous and relevant loops are seen.24
DR-FTNIR spectrometry of H-ZSM-5
As observed in Fig. 2 diffuse reflectance NIR spectra obtained from ZSM-5 samples in their hydrated form demonstrate spectral characteristics due to overtones and combination vibrations.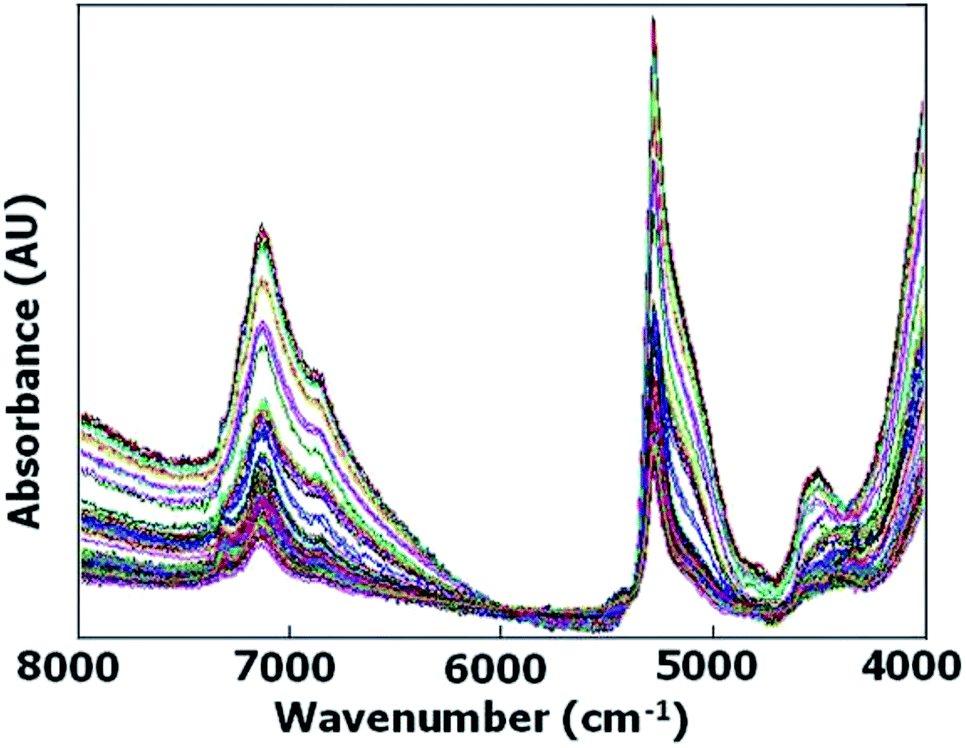 | ||
| Fig. 2 FT-NIR spectra of all meso and micro samples in raw data form. | ||
The samples were hydrated ZSM-5 zeolites and they were not preheated to keep the surface adsorbed water content. The band assignments of the surface hydroxyl groups in the near-infrared region are given in Table 2. Conventional near FTIR (FT-NIR) investigations of OH groups of H-ZSM-5 via diffuse reflectance spectroscopy have been conducted by preheated sample in a vacuum for dehydration.25,26
| Spectral region (cm−1) | Band assignment |
|---|---|
| 4660 | Combination band (OH stretching together with bending) of hydroxyl groups |
| ∼5300 | Combination band (OH stretching together with bending) of water molecules |
| 7065 and 7325 | Overtones of OH stretch silanol groups and hydrogen bonded silanol groups |
The hydroxyl groups on the surface of ZSM-5 are polarized and can form hydrogen bonding with water molecules.
However, in this work the samples were hydrated ZSM-5 zeolites and they were not preheated to keep the surface adsorbed water content which would enable to find a relationship between absorption band of water molecules in FT-NIR spectra and consequently external surface area to track the sample porosity. As the correlation between surface area and adsorbed water in silica gel particles has been studied by transflectance sampling technique,18 it was tried to analyse the amount of adsorbed water via diffuse reflectance FT-NIR spectra which would be proportional to zeolite's external surface area. On the other hand, by increasing external surface area as a result of mesoporosity enhancement, Lewis acid sites could be increased and silanol absorbance bands would be intensified. Brønsted acid sites (with high acidic strength) are formed by bridging the OH groups located inside the zeolite channels, while Lewis acid sites and weakly acidic silanol groups are found on the external surface in H-ZSM-5.22 Variation in the intensity of the band located around 5300 cm−1, which is the characteristic of the combination band of water, was observed to be more reduced in microporous crystals in comparison with mesoporous ones.
Also similar to report27 which have been demonstrated the intensity of the emission peak at 2200 nm (4545 cm−1) on the surface of the bare silica particles, can be related to the specific surface area, variation in the intensity of the band located around 4545 cm−1 was observed to be more reduced in microporous crystals in comparison with mesoporous ones.
Data pre-processing by multiplicative scatter correction (MSC)
Diffuse reflectance spectroscopy is commonly associated with scattering which may reduce its reliability. Thus it is useful to consider this deviation and try to remove its offsets. MSC is a pre-processing approach which removes the scattering effect from spectral data. It is the start point of all model-based pre-processing techniques, utilized widely in the field of vibrational spectroscopy especially diffuse reflectance.28,29 The MSC equation is:| xi = a + bxref + e | (1) |
Once a and b are estimated, xcorr that is the corrected spectrum using MSC is calculated as:
| xcorr = (xi − a)/b = xref + e/b | (2) |
A typical spectrum together with its MSC treated one is shown in Fig. 3 for both micro and meso classes.
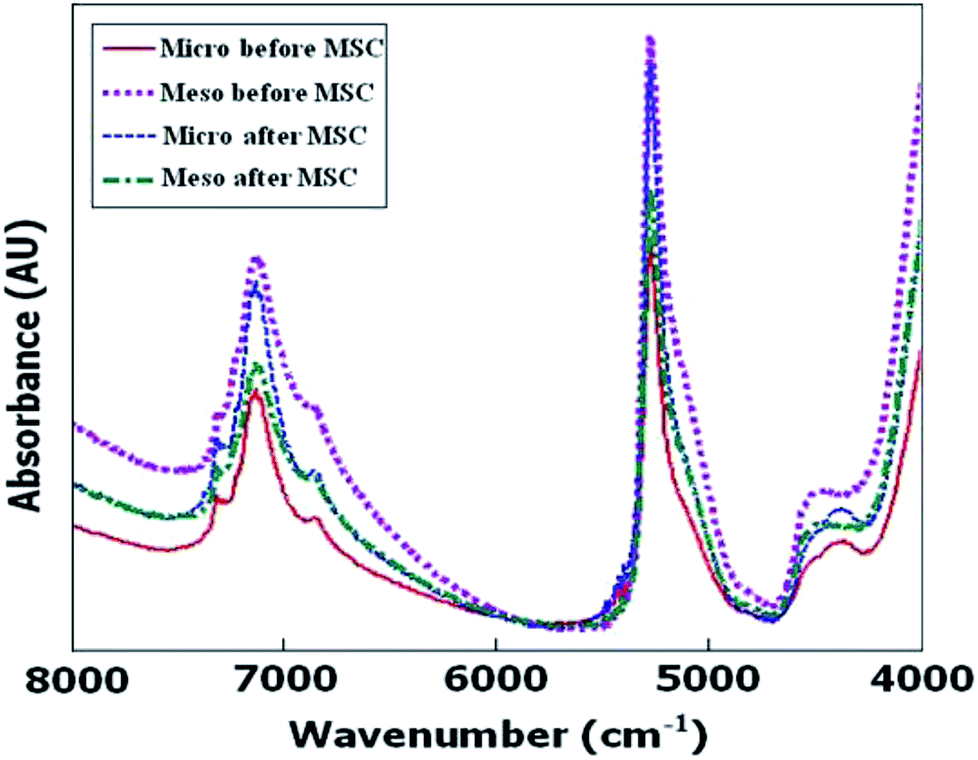 | ||
| Fig. 3 Typical raw and MSC treated diffuse reflectance FTNIR spectra of ZSM-5 samples in the 4000–8000 cm−1 spectral region. | ||
Chemometrics data processing
PCA is a common chemometrics technique for dataset size reduction and noise filtering. The PCA output consists of loading and score matrices which represent the principal components (PC's) and the coordinates of the original spectra on the new axes determined by the corresponding PC's respectively. Spectral information was mean centered prior to PCA.The 3D score plot after application of PCA on the mean centered data set has been shown in Fig. 4.
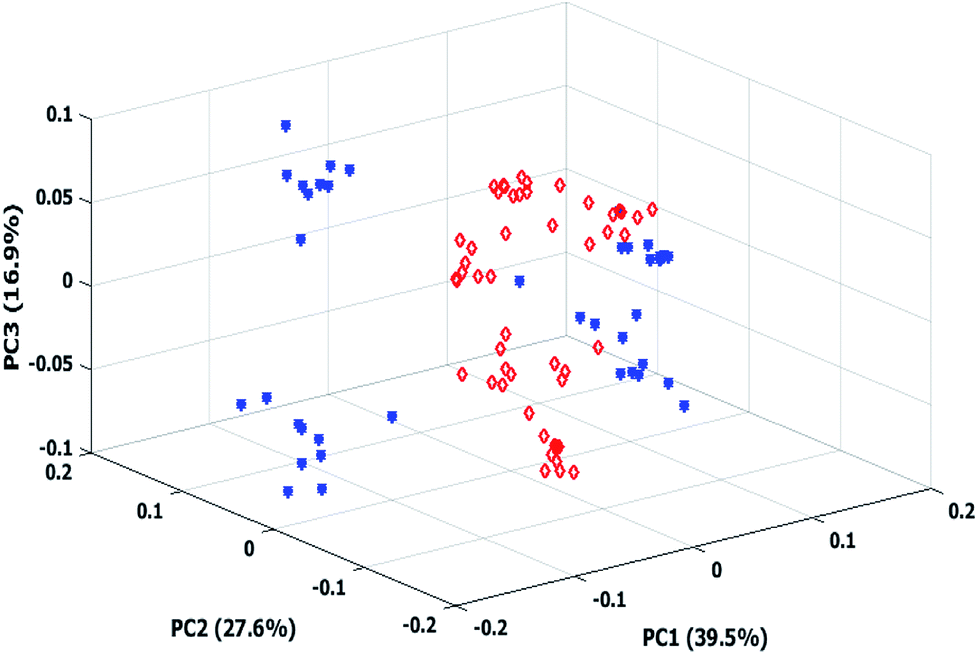 | ||
Fig. 4 PCA 3D score plot, class 1 ( ), class 2 ( ), class 2 ( ). ). | ||
It is notable that the wavenumber interval was considered for PCA was the same as initial spectra. In the score plot samples corresponding to class 2 (Micro + Meso) apparently form two or three different clusters. It may be correlated to different micro/meso ratios.
As observed in the score plot, an initial discrimination has been achieved between classes by PCA model on the MSC treated data. The first four principal components (PCs) explained 39.5, 27.6, 16.9 and 6.4% of data variance respectively. This figure illustrates an initial separation between classes, confirming PCA based models to be potentially capable of utilized and improved for obtaining reliable classification results. Another application of PCA which can be considered here is to extract the most informative parts of data. Thus PCA was employed to construct new dimensions of NIR spectral data set by reducing the total number of variables into 4 PCs displaying the most original variability of NIR data in a smaller data space.
Soft independent modeling of class analogy (SIMCA) technique is a powerful pattern recognition approach in chemometrics which is based on PCA. It aims to use many PCA disjoint models assigning a sample spectrum to one or more available classes. Thus SIMCA model was built to find the class-specific information from all NIR spectra and to model the information separately.
This means that each group class was independently modeled using PCA. Selection of the best number of principal component is an important step before any model construction by SIMCA. Predicted residual error sum-of-squares (PRESS) value is one criterion of this selection which is calculated by cross validation strategy.
The optimum number of components is the component for which the PRESS is small enough, considering of large number of factors often leads to over fitting in the model during classification of an independent test set. Fig. 5 shows PRESS plots obtained after the Leave-One-Out (LOO) cross-validation for micro and meso classes in the training set. Referring to PRESS values, more than 4 PCs were determined as optimum. Explained variance versus principal components plot of each class is also shown in Fig. 5.
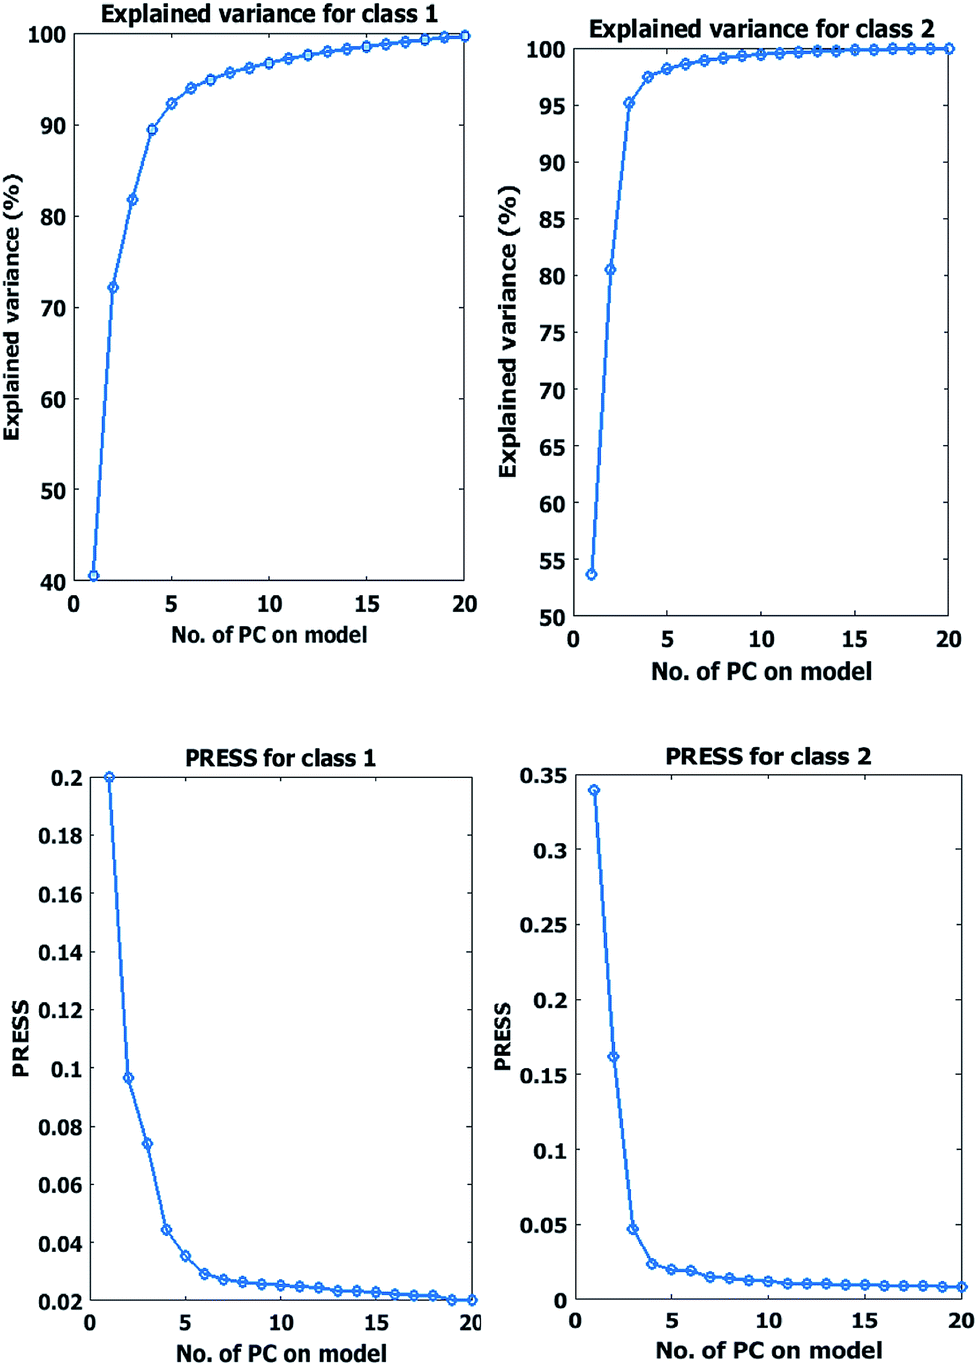 | ||
| Fig. 5 PRESS and covered variance plot of SIMCA model for class 1 (micro) and 2 (meso) in training set. | ||
The result of variance analysis showed considering 4 PCs in both classes could explain the majority of cumulative variance. However, the outcome of SIMCA model with 4 or more PCs is not satisfactory. Therefore, several classification models have been evaluated for training set samples, employing different ‘number of factors’. Data set classification errors were 40%, 20% and 15% by 4, 5 and 6 PCs respectively. Q and T2 are two common criteria in SIMCA model constructing for discrimination of class groups from each other. Q is the Euclidean distance of the residuals to the PC model, computed as a squared prediction error and T2 or Hotelling's T2 is a normalized sum of squared errors for the response featured models which indicates a statistical measure of the multivariate distance of each observation from the center of the data set. Fig. 6 shows the Q versus hotelling T2 explaining the capability of calibration model with 4 selected PCs based on PRESS plots. It can be concluded from these figures that even with the high number of PCs distinct discrimination between classes could not be reached. The other drawback of models with large number of PCs is the probable incorporation of unwanted data and time consumption.
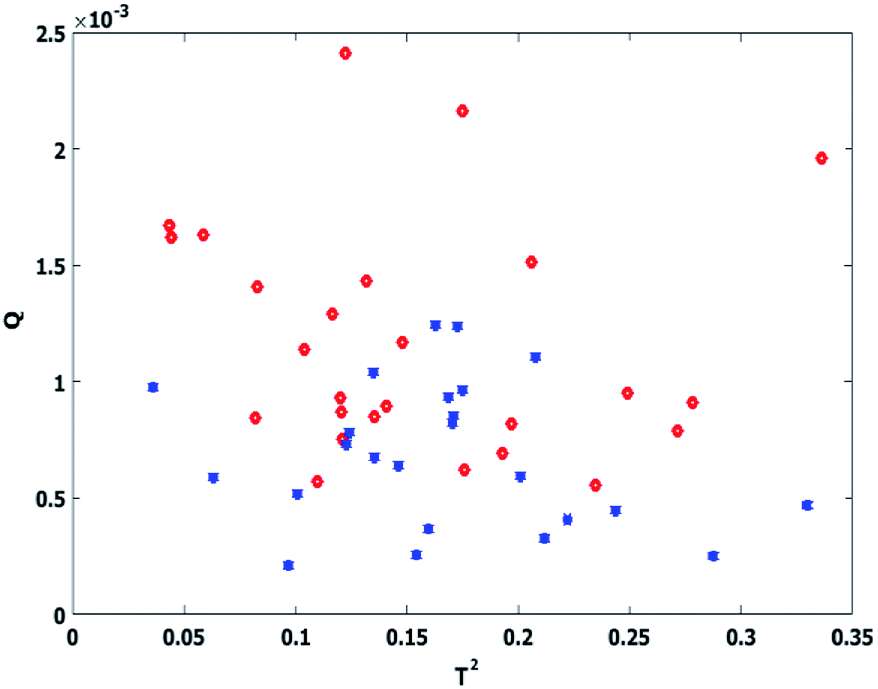 | ||
Fig. 6 Q versus T2 in SIMCA model for training set based on class 1 ( ) and class 2 ( ) and class 2 ( ). ). | ||
Discriminant analysis
LDA is a powerful supervised multivariate method which employs linear decision boundaries between classes by Mahalanobis distance while the inter-class variance is maximized and the intra-class variance is minimized.33Consider x = [x1, x2, … xd]T belonging to jth class from possible classes of DRIFT spectral data, the classification variables x1, x2, … xd correspond to reflectance measurements obtained at d wavenumbers. The squared Mahalanobis distance r2(x, mj) between x and the center of the jth class is defined as:
| r2(x, mj) = (x − mj)TS−1(x − mj) | (3) |
Considering PCA scores as input variables for LDA, the four PC was aimed to be utilized based on PRESS and explained variance plot which is explained more than 90% of the variance of data. The prediction results, obtained by the proposed MSC-LDA are detailed in Table 3.
| Training | Validation | |||
|---|---|---|---|---|
| LDA | GA-LDA | LDA | GA-LDA | |
| Error rate (%) | 2 | 6 | 5 | 5 |
| Sensitivity (%) | 100 | 100 | 100 | 100 |
| Specificity (%) | 95.8 | 90.3 | 92.3 | 89.5 |
The performance of the classifier is evaluated by the correct classification rate (CCR) statistical parameter which can be a criterion of precision and it is calculated as follows:

The best validation results were achieved with the MSC normalized spectra in terms of CCR, 98% in training set and 95% in test set while it was 90% and 86% before preprocessing for training and test set respectively.
Genetic algorithm variable selection
Genetic Algorithm (GA) has been widely applied for optimization goals. Classification of zeolite samples according to their porosity deals with associating a given input spectral pattern with one of distinct sample classes (meso or micro) by a number of NIR spectral features, representing some combination bands and overtones made on the zeolite samples that are being classified. Thus the spectral data set was proposed as a set of d-dimensional vectors, where d is the number of different features. Finally obtained patterns are points in this d-dimensional space while classes are sub-spaces. In the other words, it was tried to determine to which region a given sample's pattern falls in. The final step was to define a decision borderline which partitions the feature space into regions associated with each class.36 In this work the applied GA had a population size of 100, generation of 32, mutation rate of 0.005, being coupled with LDA and it was resulted in three regions selected variables in the best situation after optimizing. Fig. 7 shows the selected variables regions of GA, labeled in the spectrum. The reason to perform GA on whole spectral region was to obtain the most useful sub-regions by which the correlation between the aimed factor the spectral feature may be achieved.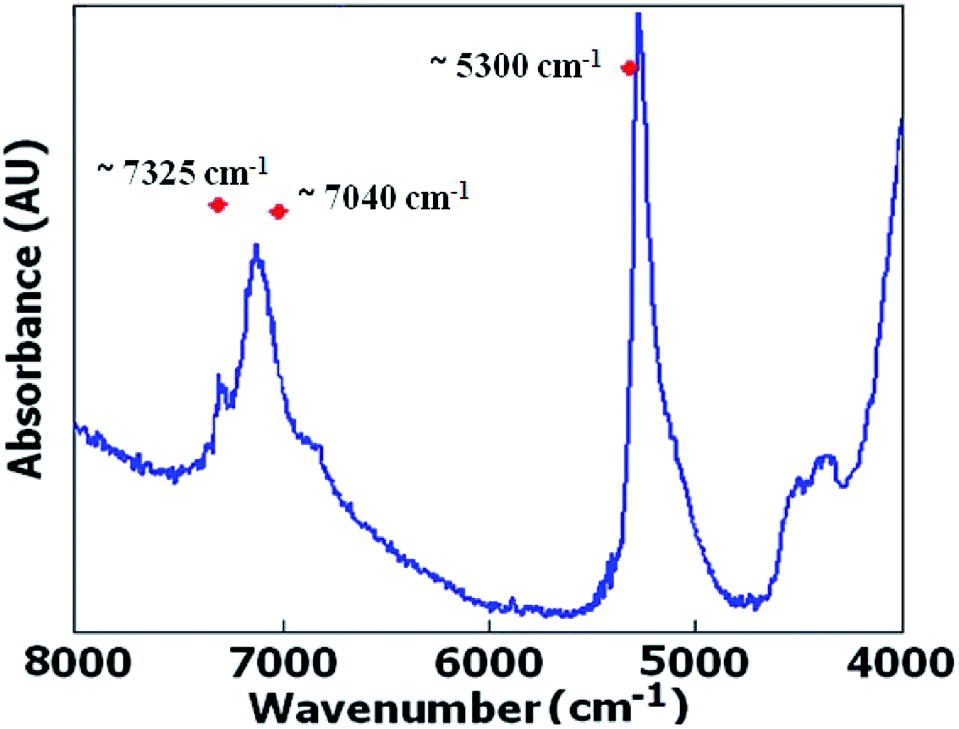 | ||
Fig. 7 Spectral region of ZSM-5 DR-FTNIR spectra selected by GA ( ). ). | ||
Fig. 8 shows the posterior probability of each class for calibration and test sets, in which a sporadic situation is obtained by LDA based on PCA. This may cause some doubts about the further capabilities of the model for prediction of unknown samples and development of practical method of analysis.
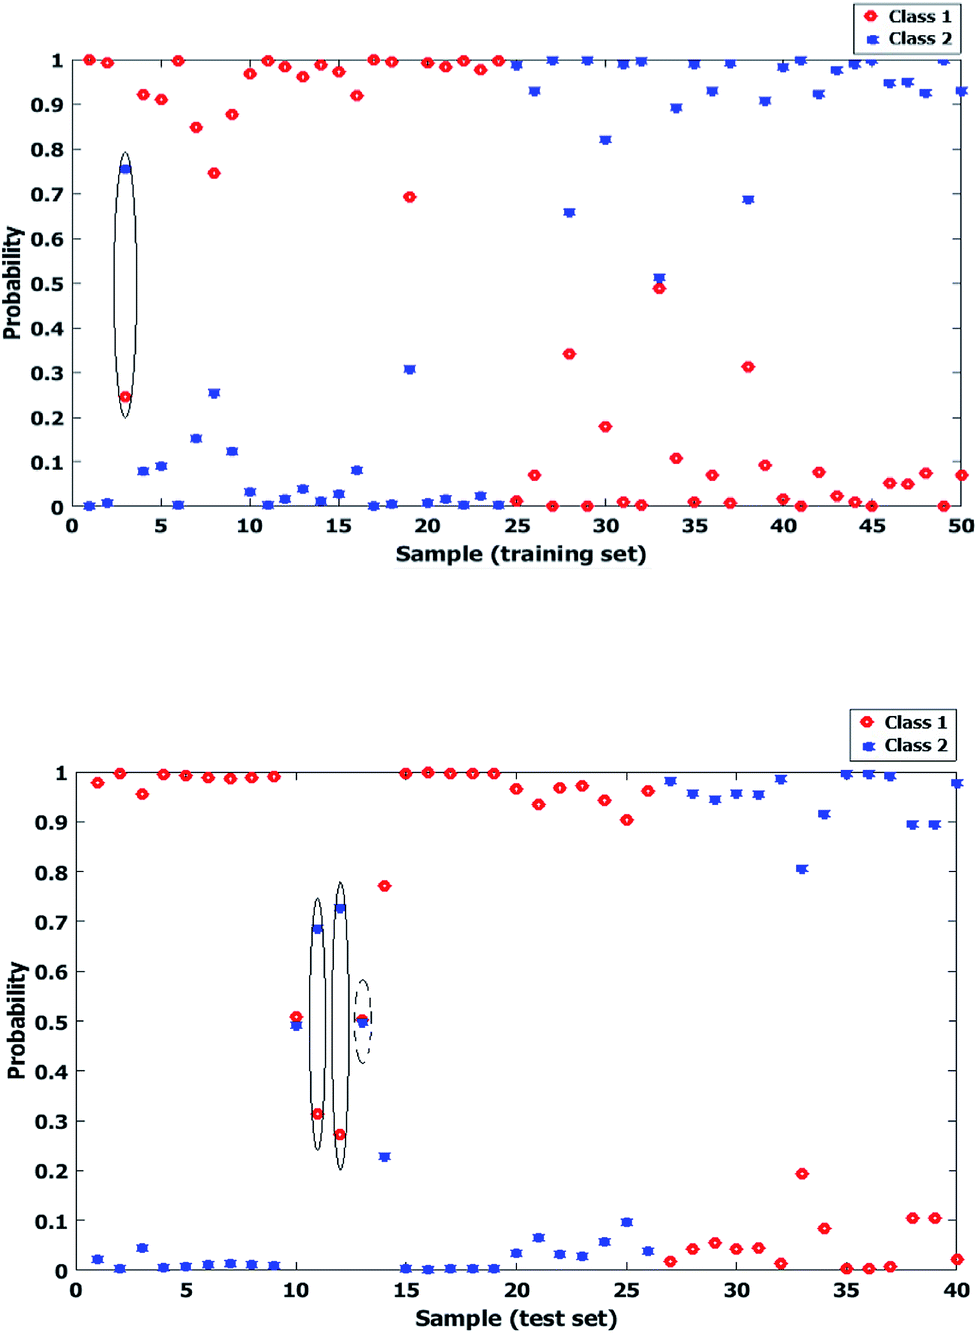 | ||
| Fig. 8 Probability of each two classes of zeolite samples for calibration (up) and test (down) data sets after performing LDA based on PCA. (Misclassified cases have been marked.) | ||
On the other hand, as seen in Fig. 9 a wider distance is obtained between probability levels of the classes by GA-LDA model. While there are no major differences between the statistical results obtained by both PCA-LDA and GA-LDA models, it is obvious that GA selected spectral regions are around 5300, 7000 and 7300 cm−1 which are directly correlated to functional groups, affecting the external surface area of micro and mesoporous samples in NIR spectral region.
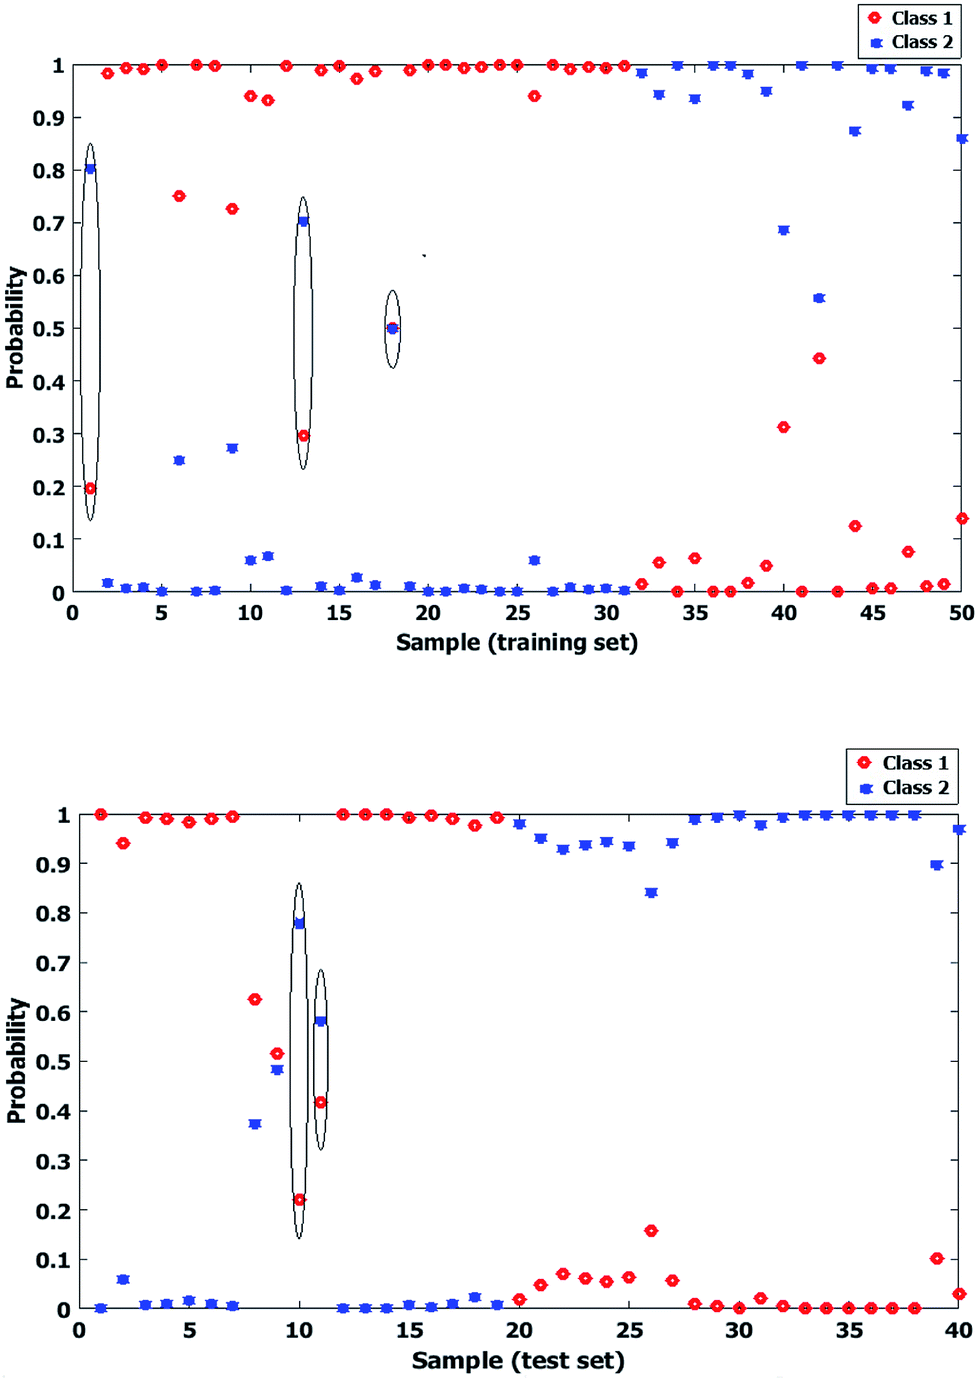 | ||
| Fig. 9 Probability of each two classes of zeolite samples for calibration (up) and test (down) data sets after performing LDA by genetic algorithm feature selection for micro or mesoporosity recognition. (Misclassified cases have been marked.) | ||
Conclusions
A pattern recognition approach has been developed for porosity based investigation of ZSM-5 samples based on their diffuse reflectance near infrared spectra. The abundance of adsorbed O–H groups on surface of ZSM-5 zeolites is different and strongly depends on external surface area. These changes were evaluated by DR-FTNIR spectroscopy being employed for estimation of the micro or mesoporosity by LDA chemometrics approach. It was tried to propose a chemometric supported procedure to generate a reliable FT-NIR-based porosity classification analysis without any physical or chemical sample preparation. The predictive model was constructed by LDA in combination with PCA and GA feature selection. The main objective was to discriminate between the spectra of micro and mesopores samples. Results showed 95% of accuracy for PCA or GA-LDA model so it can be concluded that DR-FT-NIR spectroscopy would be a reliable approach for detection of porosity variations in ZSM-5 samples. The proposed method is rapid, easy and does not need any sample preparation, thus being possible to be considered as a general porosity recognition tool in catalyst industry.Conflicts of interest
There are no conflicts to declare.References
- M. Choi, K. Na, J. Kim, Y. Sakamoto, O. Terasaki and R. Ryoo, Nature, 2009, 461, 246 CrossRef CAS PubMed.
- A. Corma, J. Catal., 2003, 216, 298 CrossRef CAS.
- Y. Wei, T. E. Parmentier, K. P. de Jong and J. Zecevic, Chem. Soc. Rev., 2015, 44, 7234 RSC.
- Y. Tao, H. Kanoh, L. Abrams and K. Kaneko, Chem. Rev., 2006, 106, 896 CrossRef CAS PubMed.
- J. S. Beck, J. C. Vartuli, W. J. Roth, M. E. Leonowicz, C. T. Kresge, K. D. Schmitt, C. T. W. Chu, D. H. Olson, E. W. Sheppard, S. B. McCullen, J. B. Higgins and J. L. Schlenker, J. Am. Chem. Soc., 1992, 114, 10834 CrossRef CAS.
- K. Na, M. Choi and R. Ryoo, Microporous Mesoporous Mater., 2013, 166, 3 CrossRef CAS.
- C. T. Kresge, M. E. Leonowicz, W. J. Roth, J. C. Vartuli and J. S. Beck, Nature, 1992, 359, 710–712 CrossRef CAS.
- D. Zhao, Science, 1998, 279, 548 CrossRef CAS PubMed.
- Y. Tao, H. Kanoh and K. Kaneko, J. Am. Chem. Soc., 2003, 125, 6044 CrossRef CAS PubMed.
- A. Corma, Chem. Rev., 1997, 97, 2373 CrossRef CAS PubMed.
- A. Sayari, E. Crusson and S. Kaliaguine, Langmuir, 1991, 7, 314 CrossRef CAS.
- P. Hudec, J. Novansky, S. Silhar, T. N. Trung, M. Zubek and J. Madar, Adsorpt. Sci. Technol., 1986, 3, 159 CrossRef CAS.
- P. M. Carrott and K. W. Sing, Chem. Ind., 1986, 1, 786 Search PubMed.
- I. Suzuki, S. OKI and S. Namba, J. Catal., 1986, 100, 219 CrossRef CAS.
- I. Suzuki, S. Namba and T. Yashima, J. Catal., 1983, 81, 485 CrossRef CAS.
- M. Blanco and A. Peguero, Talanta, 2008, 77, 647 CrossRef CAS.
- M. Khanmohammadi, A. Bagheri Garmarudi, N. Khoddami, K. Shabani and M. Khanlari, Microchem. J., 2010, 95, 337 CrossRef CAS.
- A. A. Christy, Colloids Surf., A, 2008, 322, 248 CrossRef CAS.
- C. W. Huck, N. Heigl, M. Najam-ul-Haq, M. Rainer, R. M. Vallant and G. K. Bonn, Open Anal. Chem. J., 2007, 1, 21 CrossRef CAS.
- M. Khanmohammadi, H. Elmizadeh and K. Ghasemi, Iran. J. Pharm. Res., 2015, 14, 665 CAS.
- C. J. Silva and C. Pasquini, Analyst, 2015, 140, 512 RSC.
- T. Armaroli, L. J. Simon, M. Digne, T. Montanari, M. Bevilacqua, V. Valtchev, J. Patarin and G. Busca, Appl. Catal., A, 2006, 306, 78–84 CrossRef CAS.
- K. S. W. Sing, D. H. Everett, R. A. W. Haul, L. Moscon, R. A. Picrotti, J. Ranquerol and T. Sieminiewiska, Pure Appl. Chem., 1985, 57, 603 CAS.
- J. Ahmadpour and M. Taghizadeh, J. Nat. Gas Sci. Eng., 2015, 23, 184 CrossRef CAS.
- L. M. Kustov, V. Yu. Borovkov and V. B. Kazansky, J. Catal., 1981, 72, 149 CrossRef CAS.
- V. B. Kazansky, L. M. Kustov and V. Yu. Borovkov, Zeolites, 1983, 3, 77 CrossRef CAS.
- F. B. Gonzaga, I. C. Jardim and C. Pasquini, J. Chromatogr. A, 2006, 1122, 174 CrossRef CAS PubMed.
- M. R. Maleki, A. M. Mouazen, H. Ramon and J. De Baerdemaeker, Biosyst. Eng., 2007, 96, 427 CrossRef.
- N. K. Afseth and A. Kohler, Chemom. Intell. Lab. Syst., 2012, 117, 92 CrossRef CAS.
- K. E. Kramer, R. E. Morris and S. L. Rose-Pehrsson, Chemom. Intell. Lab. Syst., 2008, 92, 33 CrossRef CAS.
- Y. Chen and S. N. Thennadil, Anal. Chim. Acta, 2012, 746, 37 CrossRef CAS PubMed.
- Y. Mou, X. You, D. Xu, L. Zhou, W. Zeng and S. Yu, Chemom. Intell. Lab. Syst., 2014, 132, 168 CrossRef CAS.
- R. A. Fisher, Ann. Eugen., 1936, 7, 179 CrossRef.
- A. L. Brito, L. R. Brito, F. A. Honorato, M. J. Pontes and L. F. Pontes, Food Res. Int., 2013, 51, 924 CrossRef CAS.
- E. D. Moreira, M. J. Pontes, R. K. Galvão and M. C. Araújo, Talanta, 2009, 79, 1260 CrossRef CAS PubMed.
- Y. Felkel, N. Dorr, F. Glatz and K. Varmuza, Chemom. Intell. Lab. Syst., 2010, 101, 14 CrossRef CAS.
| This journal is © The Royal Society of Chemistry 2018 |