 Open Access Article
Indocyanine green conjugated lipid microbubbles as an ultrasound-responsive drug delivery system for dual-imaging guided tumor-targeted therapy†
Yan Li‡
a,
Wenqi Huang‡ *b,
Chunyan Lic and
Xiaoteng Huangd
aDepartment of Ultrasound, The First People's Hospital of Shangqiu City, Shangqiu, Henan 476100, China
bMedical Imaging Center, The First People's Hospital of Shangqiu City, Shangqiu, Henan 476100, China. E-mail: huangwq0613@sohu.com; Tel: +86-13781446699
cDepartment of Neurology, The First People's Hospital of Shangqiu City, Shangqiu, Henan 476100, China
dHenan University of Chinese Medicine, Zhengzhou, Henan 450046, China
First published on 25th September 2018
Abstract
Herein, a multifunctional traceable and ultrasound-responsive drug targeted delivery system based on indocyanine green (ICG) and folic acid (FA) covalently conjugated lipid microbubbles (ILMBs–FA) is proposed. After encapsulation of the anticancer drug resveratrol (RV), the composite (RILMBs–FA) with fluorescence and ultrasound imaging capacity was studied for highly sensitive dual-imaging guided tumor targeted therapy. The resulting RILMBs–FA with an average particle size of 1.32 ± 0.14 μm exhibited good stability and biocompatibility characteristics. The RILMBs–FA featured a high RV loading ratio and the encapsulated RV has been demonstrated to be released from the microbubbles triggered by ultrasound (US) waves. In addition, it was found that the linked FA could facilitate a high cellular uptake of RILMBs–FA via the FA receptor-mediated endocytosis pathway. Compared to free RV and RILMBs, RILMBs–FA with US irradiation demonstrated a more significant tumor cell-killing efficacy mediated by apoptosis in vitro. Eight hours post intravenous injection of RILMBs–FA, the composites showed maximum accumulation in tumorous tissues according to in vivo fluorescence and US images. This ultimately led to the best tumor inhibition effect among all tested drugs under US irradiation. In vivo biosafety evaluations showed that RILMBs–FA featured high biocompatibility characteristics and no significant systemic toxicity over the course of one month. Taken in concert, these results demonstrate the versatility of this drug delivery system with dual-imaging and ultrasound-triggered drug release characteristics for potential future applications in cancer theranostics.
1. Introduction
In recent decades, cancer has become one of the most serious global health threats to humans.1 Thus, the development of cancer theranostics with high efficacy has become one of the crucial goals in medicine.2 Traditional treatment regimens for cancer include surgical excision, radiotherapy and chemotherapy.3 However, frequent and serious side effects with poor survival rates are often observed.4 These drawbacks include the systemic radiotoxicity and toxicity of chemotherapeutic drugs that are often non-specific to different tumors.5 In recent years, one study has focused on simultaneous and precise noninvasive imaging diagnosis and targeted chemotherapy, generally regarded as a novel and an ideal strategy in the treatment of cancer.6 Because of advantages such as real-time data acquisition, low cost operation, high safety and portability, ultrasound (US) imaging has become one of the most commonly used clinical tumor diagnostic tools.7–9 Combined with tumor-targeted ultrasound contrast agents, e.g. tumor targeted microbubbles or nanobubbles, US imaging can help observe the distribution of contrast agents and tumor structures with both high resolution and sensitivity.10,11 Moreover, US irradiation with focus and non-invasive deep penetration capacity in soft tissue has been demonstrated to enhance the intercellular uptake of drugs and trigger the release of drugs from the bubbles.12–15 For example, Yan et al. have developed various functionalized bubbles as US imaging contrast agents and US-triggered therapeutic drug delivery carriers for the development of tumor theranostics.15Dual-modality imaging with only one contrast agent has been regarded to be a more precise diagnostic tool for tumors.16,17 Among various clinical tumor imaging modalities, near-infrared (NIR) fluorescence imaging has been extensively applied in clinical applications, e.g. guided tumor resection procedures, due to its high sensitivity and imaging speed.18–20 Recently, some researchers have reported fluorescent bubbles that integrated US imaging and fluorescence imaging as dual-imaging contrast agents for the diagnosis of tumors.16,21–23 For instance, Mai et al. have developed a cyanine 5.5 conjugated nanobubble as a tumor-selective contrast agent for tumor ultrasound/fluorescence dual-imaging.16 However, most of the used fluorescence molecules have not been approved by the Food and Drug Administration (FDA) which limits their future clinical translation. In addition, the used dyes were mostly encapsulated in the bubbles, which would lead leak of the small molecule dye that affect the imaging capacity. Indocyanine green (ICG) represents an FDA-approved fluorescent molecule.20,24 Because of its low toxicity and high fluorescence yield, ICG has been widely used for disease diagnosis in clinical applications.25 However, ICG features some drawbacks such as poor colloid- and photo-stability, low specificity, and short half-life in the bloodstream, which limit further and more extensive applications.26 To solve these issues, free ICG is typically conjugated with a vehicle, e.g. a polymer, liposomes, lipid, transition metal dichalcogenides, etc. to form a composite.24,27–30
In this study, a biocompatible lipid-PEG microbubble has been developed as a multifunctional platform for the use as a tumor theranostic (Scheme 1). Free ICG and the tumor-targeted molecule folic acid (FA) were covalently conjugated to microbubbles (ILMBs–FA). This tumor-targeted fluorescence bubble integrated US and fluorescence dual-imaging capacities. In order to equip the material with tumor therapeutic features, the known anticancer drug resveratrol (RV) was encapsualated into the ILMBs–FA to form the theranostic agent RILMBs–FA.31–33 The obtained RILMBs–FA with uniform morphology and great biocompatibility not only improved the stability of RV with ICG further enhancing the half-life, but also functioned as an US-triggered RV-targeted delivery carrier. As a US and fluorescent dual-imaging probe, the fluorescence imaging ability was used to detect the cellular target uptake, in vivo biodistribution, and tumor accumulation of the theranostic agent. The US imaging capacity was further used to confirm the tumor accumulation of RILMBs–FA. Guided by the dual-imaging results, the targeted anticancer efficacy of RILMBs–FA with or without US irradiation was demonstrated both in vitro and in vivo.
2. Experimental section
2.1 Materials
Resveratrol (purity ≥ 99%) and perfluoropropane (C3F8) was purchased from Sigma (St. Louis, MO, USA). Disaturated phosphatidylcholine (DSPC), 1,2-distearoyl-sn-glycerol-3-phosphoethanolamine-N-[folate (polyethylene glycol)-2000] (DSPE-PEG2000–FA), 1,2-distearoyl-sn-glycero-3-phosphoethanolamine-N-[indocyanine green (polyethylene glycol)-2000] (DSPE-PEG2000–ICG) and 1,2-distearoyl-sn-glycero-3-phosphoethanolamine-N-[carboxy(polyethylene glycol)-2000] (DSPE-PEG2000–COOH) were supplied by Xi'an Ruixi Biotechnology Co., Ltd (China).2.2 Cell culture and animal model
Human liver hepatocellular carcinoma cell line HepG2 was provided by Shanghai Institute of Cell Biology, Chinese Academy of Sciences. The cells were cultured in DMEM media containing 10% fetal bovine serum and 1% penicillin–streptomycin solution in 5% CO2 at 37 °C.Balb/c nude mice (male, 3–5 weeks) bearing HepG2 tumor model were provided by Vital River Laboratory Animal Technology Co., Ltd. (Beijing, China). All experimental procedures were performed in accordance to the Guidelines for the Care and Use of Laboratory Animals of Henan University of Chinese Medicine and were approved by the Ethics Committee of Henan University of Chinese Medicine.
2.3 Preparation and characterizations of RILMBs–FA
The DSPC, RV (dissolved in DMSO), DSPE-PEG2000–ICG and DSPE-PEG2000–FA (8![[thin space (1/6-em)]](https://www.rsc.org/images/entities/char_2009.gif) :
:![[thin space (1/6-em)]](https://www.rsc.org/images/entities/char_2009.gif) 1
1![[thin space (1/6-em)]](https://www.rsc.org/images/entities/char_2009.gif) :
:![[thin space (1/6-em)]](https://www.rsc.org/images/entities/char_2009.gif) 0.5
0.5![[thin space (1/6-em)]](https://www.rsc.org/images/entities/char_2009.gif) :
:![[thin space (1/6-em)]](https://www.rsc.org/images/entities/char_2009.gif) 0.5, molar ratios) were firstly blended in CHCl3 and the solvent was removed under nitrogen flow at 25 °C. The lipid components of the mixture at final concentration were 8 mg mL−1. The excess CHCl3 were further removed under vacuum over 1.5 h. The dried phospholipid mixture was hydrated at 65 °C in 6 mL phosphate buffered saline (PBS). Afterwards, C3F8 was added into the mixture. At last, the admixture was mechanically vibrated for 60 s. The prepared MBs were washed three times with PBS solution in a bucket rotor centrifuged at 500g for 2.5 min to remove excess unincorporated lipids and then dialyzed in deionized water for 12 h to remove the unbound RV and excess DMSO. ICG and FA conjugated and RV-loaded MBs were obtained (RILMBs–FA). RILMBs–FA without RV (ILMBs–FA) were also prepared as the contrast. In addition, the RILMBs–FA without FA (RILMBs) was prepared according to the similar preparation method of RILMBs–FA when the DSPE-PEG–FA was replaced by DSPE-PEG. The bright and fluorescence images of the particles and cells were observed by confocal laser scanning microscopy (FV1200, OLYMPUS, Japan). The size and zeta of the particles were detected using a Zetasizer Nano ZS system (Malvern Instruments, Malvern, UK). UV-Vis spectrophotometer (Shimadzu/Model UV-1601PC, Kyoto, Japan) and spectrofluorometer (F900, Edinburgh Instruments Ltd, UK) were respectively used to detect the absorption and fluorescence spectra of the particles.
0.5, molar ratios) were firstly blended in CHCl3 and the solvent was removed under nitrogen flow at 25 °C. The lipid components of the mixture at final concentration were 8 mg mL−1. The excess CHCl3 were further removed under vacuum over 1.5 h. The dried phospholipid mixture was hydrated at 65 °C in 6 mL phosphate buffered saline (PBS). Afterwards, C3F8 was added into the mixture. At last, the admixture was mechanically vibrated for 60 s. The prepared MBs were washed three times with PBS solution in a bucket rotor centrifuged at 500g for 2.5 min to remove excess unincorporated lipids and then dialyzed in deionized water for 12 h to remove the unbound RV and excess DMSO. ICG and FA conjugated and RV-loaded MBs were obtained (RILMBs–FA). RILMBs–FA without RV (ILMBs–FA) were also prepared as the contrast. In addition, the RILMBs–FA without FA (RILMBs) was prepared according to the similar preparation method of RILMBs–FA when the DSPE-PEG–FA was replaced by DSPE-PEG. The bright and fluorescence images of the particles and cells were observed by confocal laser scanning microscopy (FV1200, OLYMPUS, Japan). The size and zeta of the particles were detected using a Zetasizer Nano ZS system (Malvern Instruments, Malvern, UK). UV-Vis spectrophotometer (Shimadzu/Model UV-1601PC, Kyoto, Japan) and spectrofluorometer (F900, Edinburgh Instruments Ltd, UK) were respectively used to detect the absorption and fluorescence spectra of the particles.
2.4 RV encapsulation efficiency and US-triggered release
As mentioned in Section 2.3, the obtained MBs were firstly dialyzed in deionized water for 12 h. To determine the free RV concentration, the optical absorbance of the dialysate was measured with a UV-Vis spectrometer at 304 nm and compared against a calibration curve to calculate the amount of unencapsulated RV. The encapsulated RV in MBs was determined as unencapsulated RV subtracted from the total RV used. The encapsulation efficiency (EE) of RV was calculated according to the eqn (1) as below:
 | (1) |
In addition, the RV release ratio triggered by US irradiation was evaluated. In detail, RILMBs–FA (1 mL) was added into the Eppendorf tube, which was sealed by parafilm. The US transducer was filled with ultrasonic coupling agent and the tube was placed onto the surface of transducer. After 60 s US irradiation (1 MHz transducer, 1 MPa US intensity), these tubes were centrifuged for 25 min at 13![[thin space (1/6-em)]](https://www.rsc.org/images/entities/char_2009.gif) 000g. The supernatant was collected and extracted by CHCl3. The cumulative release efficiency (CRE) was detected every 10 s during 60 s US irradiation. The CRE was calculated according to the following eqn (2):
000g. The supernatant was collected and extracted by CHCl3. The cumulative release efficiency (CRE) was detected every 10 s during 60 s US irradiation. The CRE was calculated according to the following eqn (2):
 | (2) |
2.5 Cellular uptake
HepG2 cells were seeded in 20 mm Petri dishes. After cultured for 24 h, free ICG, RILMBs, RILMBs–FA + FA and RILMBs–FA (with same ICG concentration) were incubated with cells for 5 h. Afterwards, the treated cells were washed by PBS thrice, fixed by 4% paraformaldehyde for 10 min, and stained by 0.2 mg mL−1 of 4′,6-diamidino-2-phenylindole (DAPI) solution (Aladdin, Shanghai, China) for 10 min. The fluorescence images of the cells were captured by confocal laser scanning microscopy and the fluorescence intensity of the cells was detected using flow cytometer (Beckman Coulter, Miami, FL) according to the protocol.2.6 In vitro hemolysis test
For hemolysis test of RILMBs–FA, 1 mL whole blood was collected from health mouse. Through centrifugation, the red blood cells (RBCs) were separated. Various concentration of RILMBs–FA in PBS was incubated with RBCs. After 1 h incubation at 37 °C, the treated RBCs were centrifuged with10![[thin space (1/6-em)]](https://www.rsc.org/images/entities/char_2009.gif) 000 rpm for 1 min. The absorbance of the supernatants was detected by UV-Vis spectrophotometer at 541 nm. The hemolytic percent (HP) was calculated according to the following eqn (3):
000 rpm for 1 min. The absorbance of the supernatants was detected by UV-Vis spectrophotometer at 541 nm. The hemolytic percent (HP) was calculated according to the following eqn (3):
 | (3) |
2.7 In vitro anticancer efficacy and apoptosis staining
A standard CCK-8 assay (7Sea PharmTech, Shanghai, China) was utilized to evaluate the cytotoxicity of the in vitro anticancer efficacy. Firstly, ILMBs–FA at predetermined concentrations (10, 50, 150, 300, 600 μg mL−1) were cultured with adherent cells. After 24 h incubation, DMEM media containing 10% CCK-8 were added into each well and the cells were cultured for further 30 min at 37 °C. A Multimode Plate Reader (EnVision; PerkinElmer) was used to detect the absorbance value of the treated cells at 450 nm wavelength to characterize the cell viability. Moreover, RV, RILMBs and RILMBs–FA (at the same concentration of RV) and LMBs with or without US irradiation were treated with HepG2 cells for 3 h. Afterwards, the cells were irradiated by US for 60 s and then were incubated for 24 h. The viability of the treated cells was also detected by CCK-8 assay. In addition, these treated cells were stained by Hoechst 33258 dye and the fluorescence images of the cells were captured by confocal laser scanning microscopy.2.8 In vivo fluorescence imaging and biodistribution study
The fluorescence signal of the tumor bearing mice were detected pre-injected and 0.1, 2, 8 and 12 h post-injected with ICG, RILMBs and RILMBs–FA by a commercial Maestro in vivo imaging system (CRi Inc., Woburn, USA) at 735 nm excitation wavelength. In addition, the fluorescence signal of excised heart, liver, spleen, lungs, kidneys and tumor at 8 h post-injection of ICG, RILMBs and RILMBs–FA was also detected. The content of ICG, RILMBs and RILMBs–FA in these samples was determined by ICG fluorescence.2.9 In vitro and in vivo US imaging
In vitro US imaging was obtained by a Doppler ultrasonic diagnostic apparatus (Esaote Healthy Co., Ltd., Italy) with 12 MHz linear transducer. The ICG, RILMBs and RILMBs–FA (with same concentration of bubbles) were dispersed in PBS and mixed with agarose gel to form a pie shape phantom. The US imaging was taken from the horizontal section of the phantom. In vivo US imaging were conducted on tumor-bearing mice at pre-injection (0 h) and 8 h post-injection of RILMBs–FA intravenously.2.10 In vivo anticancer efficacy and toxicity study
HepG2 tumor bearing mice were randomly divided into five groups (n = 5) and then were treated by intravenously injection of saline (control), free RV, RILMBs + US and RILMBs–FA and RILMBs–FA + US, respectively. During the treatment, the tumor volume and body weight of the mice were monitored every three days. The tumor volume (TV) was calculated as the eqn (4):
 | (4) |
The tumor growth change was showed by relative tumor volumes (RTV) which were calculated as the follow eqn (5):
 | (5) |
In addition, healthy mice (n = 5) were intravenously injected with 150 μL RILMBs–FA at a dose of 15 mg kg−1. At 0, 7 and 14 days post-injection of RILMBs–FA, the whole blood was collected for complete blood counts evaluations at the First People's Hospital of Shangqiu, Henan province. Furthermore, the heart, liver, spleen, lung and kidney of the treated mice at 14 days post-injection of RILMBs–FA were collected, fixed by 4% paraformaldehyde overnight and dehydrated in 25% sucrose for hematoxylin and eosin (H&E, Sigma) staining. The HE staining images were observed using an inverted microscope.
3. Results and discussion
3.1 Preparation and characterization of RILMBs–FA
RILMBs–FA was synthesized as shown in Scheme 1. DSPE-PEG2000–FA and DSPE-PEG2000–ICG were around the bubbles to form a hydrophilic monolayer and stabilize the entire bubble structure. Fig. 1a and b show high magnification optical microscopy images and green fluorescence images using fluorescent microscope and indicate that RILMBs–FA exhibited a uniform spherical shape. The average diameter and zeta potentials of RILMBs–FA were determined to be 1.29 ± 0.03 μm and −31.1 ± 0.69 mV, respectively (Fig. 1c and d).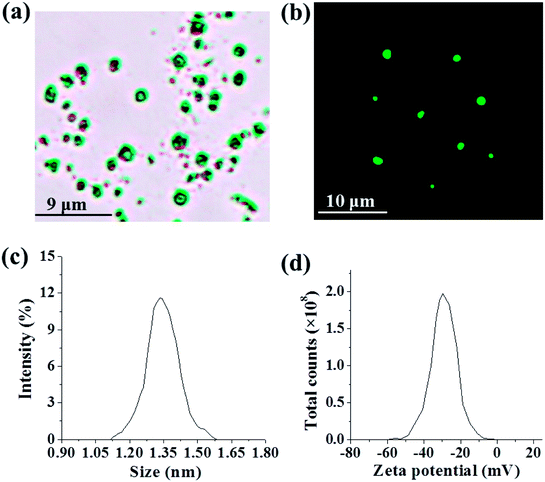 | ||
| Fig. 1 (a and b) Optical microscope image and fluorescence image of RILMBs–FA. (c and d) The size and zeta potential distribution of RILMBs–FA. | ||
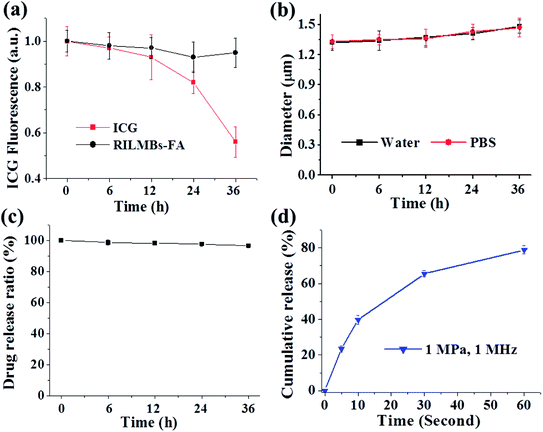
Fig. 2a shows that the UV-Vis spectra of RILMBs–FA, which simultaneously exhibited the absorbance peaks of ICG and RV at wavelengths of 780 nm and 304 nm, respectively, demonstrating the existence of both ICG and RV in RILMBs–FA. As shown in the fluorescence spectra results shown in Fig. 2b and c, RILMBs–FA exhibited both ICG and RV fluorescence emission signals at 800 nm and 400 nm, respectively. These results demonstrate that RILMBs–FA features optical properties of both ICG and RV. In addition, we evaluated the influence of scatting on the absorbance and fluorescence spectra. The results were shown in Fig. S1,† the feature peak absorbance and fluorescence intensity of the RILMBs–FA increased linearly with enhancement of their concentration (0.5, 0.25, 0.125, 0.0625, 0.03125 mg mL−1), which indicated the scatting didn't affect the absorbance and fluorescence of the RILMBs–FA at the concentration of 0.5, 0.25, 0.125, 0.0625, 0.03125 mg mL−1. Fig. 3a shows the fluorescence stability of ICG and RILMBs–FA in aqueous solution. After 36 h of storage at 37 °C, the ICG fluorescence intensity of RILMBs–FA remained constant and no significant change compared to its initial intensities could be observed. However, the fluorescence intensity of free ICG decreased rapidly compared to its initial intensity. It was reported that free ICG could aggregate that induced fluorescence signal quenching and decrease.24,30 The average size of RILMBs–FA in water and PBS slightly increased over the course of 36 h (Fig. 3b and S2†). In addition, RV leakage could be detected after 36 h (Fig. 3c). These results indicate that RILMBs–FA featured a good stability, likely due to the PEG surrounding RILMBs–FA.
 | ||
| Fig. 2 (a) The absorbance spectra of free RV, ICG and RILMBs–FA. (b) The fluorescence spectra of free ICG and RILMBs–FA. (c) The fluorescence spectra of free RV and RILMBs–FA. | ||
After calculation according to the eqn (1), the maximum RV and ICG encapsulation efficiency of RILMBs–FA were 99.1 ± 1.3% and 23.6 ± 2.1%, respectively. The US-triggered RV release ratio of RILMBs–FA was detected upon exposure to US irradiation for 60 s. The drug release profile of RILMBs–FA was recorded as functions of the cumulative RV release ration and the US treatment time. As shown in Fig. 3d, upon US irradiation with 1 MPa ultrasound pressure and 1 MHz frequency for 60 s, the drug release ratio was found to increase with increasing irradiation time. The highest RV release rate was 89.7 ± 3.1% after US irradiation for 60 s. These results showed that RILMBs–FA exhibited a suitable US-triggered drug release capability, likely due to the destruction of microbubbles leading to drug release.34–37
3.2 In vitro cellular uptake and biocompatibility
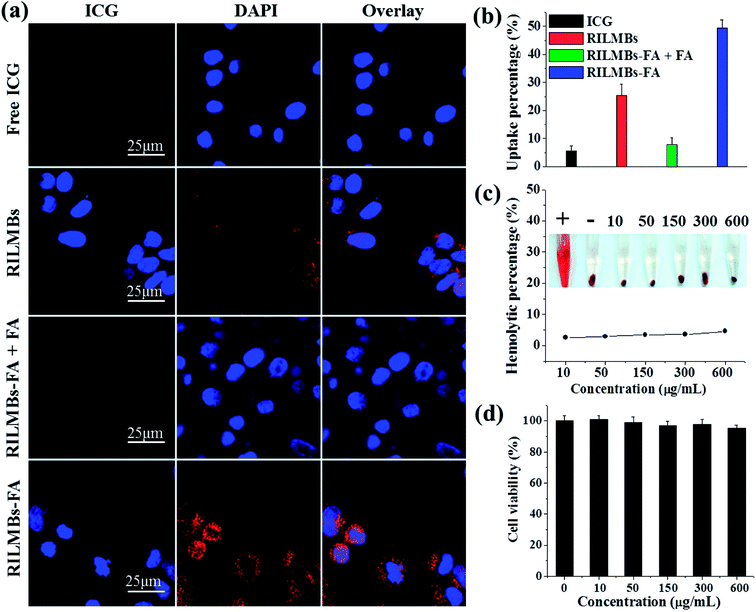
Fig. 4a shows that intense ICG red fluorescence could be observed in the perinuclear region in RILMBs–FA treated cells compared to that of free ICG and RILMBs treated cells. This latter finding indicated that a sufficient amount of RILMBs–FA could enter the cells. However, after pre-treatment with free FA, HepG2 incubated with RILMBs–FA showed very little ICG red fluorescence, likely due to free FA blocking the FA receptor on the HepG2 surface. In addition, a similar cellular uptake behavior of RILMBs–FA was observed by FCM and determined to be 48.9 ± 4.2%, much higher than that of free ICG, RILMBs, RILMBs–FA + FA and RILMBs–FA. This series of results demonstrates that RILMBs–FA may enter cells via the FA receptor mediated endocytosis pathway.38,39As shown in Fig. 4c, RILMBs–FA at a concentration range of 10 to 600 μg mL−1 induced a low hemolysis ratio that was similar to the negative control. This finding indicated that RILMBs–FA featured appropriate hemocompatibility characteristics. Moreover, the negligible cytotoxicity of the carrier ILMBs–FA without RV suggested that the prepared bubbles exhibited excellent in vitro biocompatibility properties (Fig. 4d).
3.3 In vitro anticancer efficacy and apoptosis detection
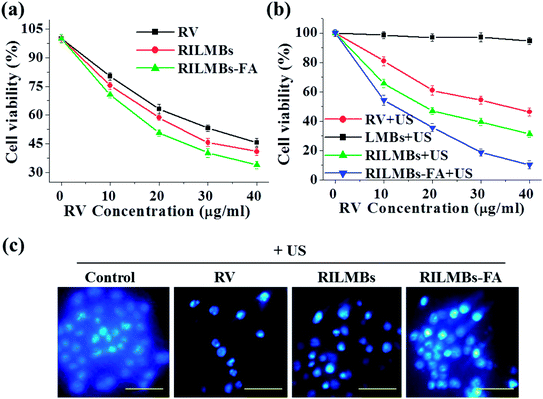
As shown in Fig. 5a, free RV, RILMBs and RILMBs–FA with the same RV concentration ranging between 0 and 40 μg mL−1 demonstrated an enhanced cell-killing ability in a dose-dependent manner. Under US irradiation for 60 s, RILMBs–FA exhibited the highest cell death rate. As a control, cells treated by lipid-bubbles (LMBs) with US irradiation for 60 s showed no significant viability decrease, indicating that no cytotoxicity of LMBs plus US irradiation could be observed. The enhanced in vitro anticancer efficacy of RILMBs–FA could likely be attributed to the efficient FA mediated active targeting effect and the enhanced RV release rate triggered by US irradiation. Moreover, the cell nuclei of cells treated with free RV, RILMBs and RILMBs–FA plus US irradiation were stained by Hoechst 33258 to evaluate the cell death type. As shown in Fig. 5c, cells treated by RILMBs and RILMBs–FA with US irradiation showed nuclear condensation, similar to that of RV with US irradiation. In contrast, the control cells showed a uniform nucleoplasm. Nuclear condensation has been reported to be a unique characteristic of apoptotic cells. Therefore, the results obtained throughout this study indicated the cell death mediated by apoptosis was induced by the release of RV, triggered by US irradiation.35,403.4 In vivo fluorescence imaging and biodistribution
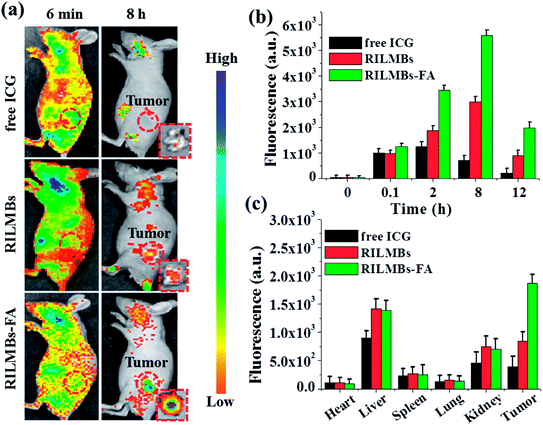
As shown in Fig. 6a, 6 min post injection, strong fluorescence signals could be obtained throughout the entire mouse body, likely from the presence of free ICG, RILMBs and RILMBs–FA in the bloodstream. Upon increasing the time, increased fluorescence signals were observed in the tumor regions, especially in the RILMBs–FA group compared to that in ICG and RILMBs groups. 8 h post injection, the tumor fluorescence intensity of RILMBs–FA treated mice reached a peak value, which was further confirmed by the fluorescence images of the corresponding excised tumor (Fig. 6a). Fig. 6b shows the fluorescence signal change in the tumor region 12 h post injection of free ICG, RILMBs and RILMBs–FA, respectively. This finding showed that the tumor fluorescence signal in RILMBs–FA group was significantly higher than that of the free ICG and RILMBs groups at all studied time points. In addition, Fig. 6c shows ex vivo fluorescence quantitative results of harvested tumors and hearts, livers, spleens, lungs and kidneys from euthanized mice 12 h post injection. The liver and kidney tissue in the groups of free ICG, RILMBs and RILMBs–FA showed strong fluorescence signals, indicating that the particles were mainly metabolized via the hepatic and renal pathway.41 Remarkably, because of the enhanced permeability and retention (EPR) effect and the FA mediated tumor targeted effect,42–45 the tumor fluorescence signal in the RILMBs–FA group proved to be stronger than that in the free ICG and RILMBs group.3.5 In vitro and in vivo US imaging
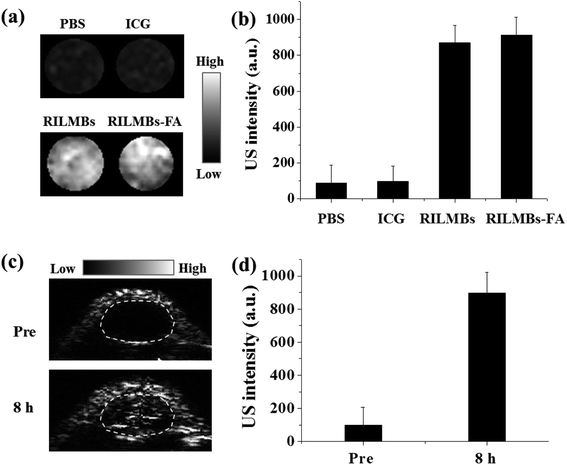
The microbubbles in RILMBs–FA resulted in a well enhanced US imaging capacity. As shown in Fig. 7a and b, the RILMBs–FA as well as RILMBs with equal number of bubbles featured the same contrast-enhancing image intensity, higher than that of PBS and ICG. Pre injection of RILMBs–FA, the inner tumor tissues exhibited less US signal. However, the tumor accumulation of RILMBs–FA after systemic injection of RILMBs–FA was clearly manifested by enhanced echogenicity of tumor ultrasound images (Fig. 7c). The quantitative results showed that the US signal intensity in the tumors of mice 8 h post injection of RILMBs–FA was about 9.3 folds compared with that pre injection (Fig. 7d). This result implied that the RILMBs–FA may potentially be useful as highly sensitive US imaging probes in enhanced US imaging.3.6 In vivo anticancer efficacy and toxicity evaluation
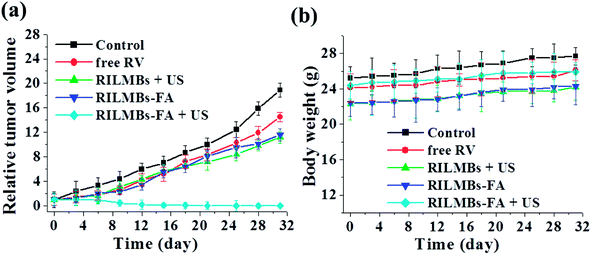
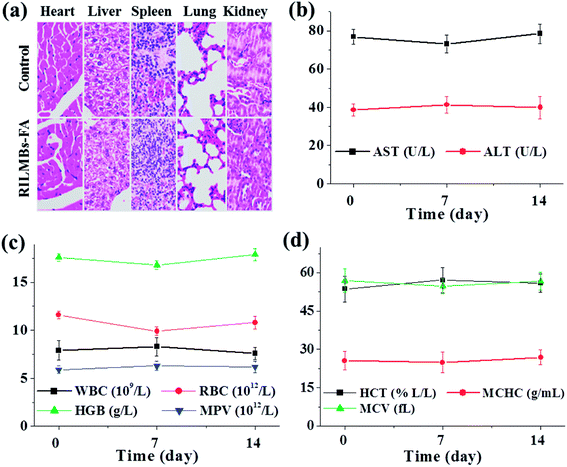
Guided by in vivo fluorescence and US dual-imaging, 8 h post injection of RILMBs–FA, US irradiation was applied to the tumors for 1 min. Among the treated groups including control, RV, RILMBs + US, RILMBs–FA, and RILMBs–FA + US groups, the RILMBs–FA + US group exhibited the most remarkable tumor growth suppression and no tumor relapse after about one month of treatment (Fig. 8a). During the treatment period for one month, the body weight of mice in all groups did not decrease (Fig. 8b), and there were no obvious histological lesions of mice in RILMBs–FA + US group according to HE staining images (Fig. 9a).Furthermore, the parameters of blood in RILMBs–FA injected mice 0, 7 and 14 days post-injection, including aspartate aminotransferase (AST), alanine aminotransferase (ALT), white blood cell count (WBC), red blood cell count (RBC), hemoglobin (HGB), mean platelet volume (MPV), hematocrit (HCT), mean corpuscular hemoglobin concentration (MCHC) and mean corpuscular volume (MCV) were demonstrated to be normal compared to those values of the control mice (Fig. 9b–d). These results demonstrated that RILMBs–FA exhibiting suitable in vivo biocompatibility characteristics may represent a promising material for future clinical applications in tumor therapy.
4. Conclusions
In summary, we have prepared an integrated theranostic agent, RILMBs–FA, that was demonstrated to covalently conjugate ICG and FA, and encapsulate RV to lipid-PEG microbubbles for fluorescence and US imaging-guided tumor target therapy in vitro and in vivo. Due to the coating with PEG and lipid, the obtained RILMBs–FA exhibited excellent stability and biocompatibility characteristics. US irradiation could efficiently trigger RV release from RILMBs–FA, likely due to the destruction of the microbubbles. The modified FA facilitated a highly efficient cellular uptake of RILMBs–FA via FA receptor-mediated endocytosis pathway. The conjugated ICG and microbubbles resulted in fluorescence and US imaging capabilities of RILMBs–FA that was demonstrated both in vitro and in vivo. The obtained imaging results showed that RILMBs–FA could actively target tumor tissues and reach a peak accumulation 8 h post injection. Guided by the imaging diagnostic results, in vitro and in vivo experiments indicated that compared with free RV, RILMBs–FA plus US irradiation featured an excellent anticancer efficacy induced by apoptosis, without significant systemic toxicity. Taken in concert, the results indicate that RILMBs–FA may be a promising tumor-integrated theranostic agent for the use in future nanomedicine applications.Conflicts of interest
The authors report no conflicts of interest in this work.References
- L. A. Torre, F. Bray, R. L. Siegel, J. Ferlay, J. Lortet-Tieulent and A. Jemal, CA: Cancer J. Clin., 2015, 65, 87–108 Search PubMed.
- F. S. Wang, J. G. Fan, Z. Zhang, B. Gao and H. Y. Wang, Hepatology, 2014, 60, 2099–2108 CrossRef PubMed.
- P. A. Jones, J. P. J. Issa and S. Baylin, Nat. Rev. Genet., 2016, 17, 630 CrossRef PubMed.
- K. D. Miller, R. L. Siegel, C. C. Lin, A. B. Mariotto, J. L. Kramer, J. H. Rowland, K. D. Stein, R. Alteri and A. Jemal, CA: Cancer J. Clin., 2016, 66, 271–289 Search PubMed.
- A. Shimabukuro-Vornhagen, B. Böll, M. Kochanek, É. Azoulay and M. S. von Bergwelt-Baildon, CA: Cancer J. Clin., 2016, 66, 496–517 Search PubMed.
- M. S. Muthu, D. T. Leong, L. Mei and S. S. Feng, Theranostics, 2014, 4, 660–677 CrossRef PubMed.
- F. Kiessling, S. Fokong, J. Bzyl and W. Lederle, Adv. Drug Delivery Rev., 2014, 72, 15–27 CrossRef PubMed.
- A. Zlitni and S. S. Gambhir, Curr. Opin. Chem. Biol., 2018, 45, 113–120 CrossRef PubMed.
- H. Hu, X. Zhang, J. Sun, L. An, J. Du, H. Yang, F. Li, H. Wu and S. Yang, RSC Adv., 2016, 6, 103754–103762 RSC.
- H. Yang, W. Cai, L. Xu, X. Lv, Y. Qiao, P. Li, H. Wu, Y. Yang, L. Zhang and Y. Duan, Biomaterials, 2015, 37, 279–288 CrossRef PubMed.
- K. Hoyt, H. Umphrey, M. Lockhart, M. Robbin and A. Forero-Torres, Ultrasound Med. Biol., 2015, 41, 2292–2302 CrossRef PubMed.
- S. R. Sirsi and M. A. Borden, Adv. Drug Delivery Rev., 2014, 72, 3–14 CrossRef PubMed.
- I. De Cock, E. Zagato, K. Braeckmans, Y. Luan, N. de Jong, S. C. De Smedt and I. Lentacker, J. Controlled Release, 2015, 197, 20–28 CrossRef PubMed.
- J. R. McLaughlan, S. Harput, R. H. Abou-Saleh, S. A. Peyman, S. Evans and S. Freear, Ultrasound Med. Biol., 2017, 43, 346–356 CrossRef PubMed.
- X. Zhu, J. Guo, C. He, H. Geng, G. Yu, J. Li, H. Zheng, X. Ji and F. Yan, Sci. Rep., 2016, 6, 21683 CrossRef PubMed.
- L. Mai, A. Yao, J. Li, Q. Wei, M. Yuchi, X. He, M. Ding and Q. Zhou, PLoS One, 2013, 8, e61224 CrossRef PubMed.
- M. C. H. Hekman, O. C. Boerman, M. de Weijert, D. L. Bos, E. Oosterwijk, H. F. Langenhuijsen, P. F. A. Mulders and M. Rijpkema, Clin. Cancer Res., 2016, 22, 4634–4642 CrossRef PubMed.
- M. R. Grootendorst, M. Cariati, A. Kothari, D. S. Tuch and A. Purushotham, Clin. Transl. Imaging., 2016, 4, 353–366 CrossRef PubMed.
- C. Chi, Y. Du, J. Ye, D. Kou, J. Qiu, J. Wang, J. Tian and X. Chen, Theranostics, 2014, 4, 1072–1084 CrossRef PubMed.
- L. Wang, Y. Hu, Q. Peng, J. Zhou, Q. Zhou, S. An and C. Niu, RSC Adv., 2016, 6, 50513–50520 RSC.
- A. Kheirolomoom, P. A. Dayton, A. F. H. Lum, E. Little, E. E. Paoli, H. Zheng and K. W. Ferrara, J. Controlled Release, 2007, 118, 275–284 CrossRef PubMed.
- J. S. Xu, J. Huang, R. Qin, G. H. Hinkle, S. P. Povoski, E. W. Martin and R. X. Xu, Biomaterials, 2010, 31, 1716–1722 CrossRef PubMed.
- X. Cheng, H. Li, Y. Chen, B. Luo, X. Liu, W. Liu, H. Xu and X. Yang, PLoS One, 2013, 8, e85003 CrossRef PubMed.
- J. Chen, X. Li, X. Liu, H. Yan, Z. Xie, Z. Sheng, X. Gong, L. Wang, X. Liu, P. Zhang, H. Zheng, L. Song and C. Liu, Biomater. Sci., 2018, 6, 1503–1516 RSC.
- L. Boni, G. David, A. Mangano, G. Dionigi, S. Rausei, S. Spampatti, E. Cassinotti and A. Fingerhut, Clinical Endoscopy, 2015, 29, 2046–2055 CrossRef PubMed.
- C. Zhang, T. Lu, J. Tao, G. Wan and H. Zhao, RSC Adv., 2016, 6, 15460–15468 RSC.
- J. C. Kraft and R. J. Y. Ho, Biochemistry, 2014, 53, 1275–1283 CrossRef PubMed.
- W. H. Jian, T. W. Yu, C. J. Chen, W. C. Huang, H. C. Chiu and W. H. Chiang, Langmuir, 2015, 31, 6202–6210 CrossRef PubMed.
- N. Beziere, N. Lozano, A. Nunes, J. Salichs, D. Queiros, K. Kostarelos and V. Ntziachristos, Biomaterials, 2015, 37, 415–424 CrossRef PubMed.
- Y. Xin, T. Liu and C. Yang, Int. J. Nanomedicine, 2016, 11, 5807–5821 CrossRef PubMed.
- M. R. Vijayakumar, R. Kosuru, S. K. Singh, C. B. Prasad, G. Narayan, M. S. Muthu and S. Singh, RSC Adv., 2016, 6, 74254–74268 RSC.
- L. Hai, D. He, X. He, K. Wang, X. Yang, J. Liu, H. Cheng, X. Huang and J. Shangguan, J. Mater. Chem. B, 2017, 5, 5783–5792 RSC.
- T. Geng, X. Zhao, M. Ma, G. Zhu and L. Yin, Nanoscale Res. Lett., 2017, 12, 437 CrossRef PubMed.
- H. Ke, J. Wang, Z. Dai, Y. Jin, E. Qu, Z. Xing, C. Guo, J. Liu and X. Yue, J. Mater. Chem., 2011, 21, 5561–5564 RSC.
- Y. Lv, Y. Cao, P. Li, J. Liu, H. Chen, W. Hu and L. Zhang, Adv. Healthcare Mater., 2017, 6, 1700354 CrossRef PubMed.
- Y. Zheng, Y. Zhang, M. Ao, P. Zhang, H. Zhang, P. Li, L. Qing, Z. Wang and H. Ran, J. Microencapsulation, 2012, 29, 437–444 CrossRef PubMed.
- H. Y. Huang, S. H. Hu, S. Y. Hung, C. S. Chiang, H. L. Liu, T. Chiu, H. Lai, Y. Chen and S. Chen, J. Controlled Release, 2013, 172, 118–127 CrossRef PubMed.
- X. Zhao, X. Jia, L. Liu, J. Zeng, K. Tian, T. Zhou and P. Liu, Biomacromolecules, 2016, 17, 1496–1505 CrossRef PubMed.
- H. Jin, J. Pi, F. Yang, J. Jiang, X. Wang, H. Bai, M. Shao, L. Huang, H. Zhu, P. Yang, L. Li, T. Li, J. Cai and Z. W. Chen, Sci. Rep., 2016, 6, 30782 CrossRef PubMed.
- R. Venkatadri, T. Muni, A. K. V. Iyer, J. S. Yakisich and N. Azad, Cell Death Dis., 2017, 7, e2104 CrossRef PubMed.
- H. Arami, A. Khandhar, D. Liggitt and K. M. Krishnan, Chem. Soc. Rev., 2015, 44, 8576–8607 RSC.
- T. Ojha, V. Pathak, Y. Shi, W. E. Hennink, C. T. W. Moonen, G. Storm, F. Kiessling and T. Lammers, Adv. Drug Delivery Rev., 2017, 119, 44–60 CrossRef PubMed.
- J. Chen, H. Liu, C. Zhao, G. Qin, G. Xi, T. Li, X. Wang and T. Chen, Biomaterials, 2014, 35, 4986–4995 CrossRef PubMed.
- W. T. Chen, S. T. Kang, J. L. Lin, C. H. Wang, R. C. Chen and C. K. Yeh, Biomaterials, 2015, 53, 699–708 CrossRef PubMed.
- S. D. Jo, S. H. Ku, Y. Y. Won, S. H. Kim and I. C. Kwon, Theranostics, 2016, 6, 1362–1377 CrossRef PubMed.
Footnotes |
| † Electronic supplementary information (ESI) available. See DOI: 10.1039/c8ra03193b |
| ‡ These authors contribute equally. |
| This journal is © The Royal Society of Chemistry 2018 |


