DOI:
10.1039/C8RA02962H
(Paper)
RSC Adv., 2018,
8, 28179-28188
Fabrication of Ag3PO4/GO/NiFe2O4 composites with highly efficient and stable visible-light-driven photocatalytic degradation of rhodamine B
Received
6th April 2018
, Accepted 19th July 2018
First published on 6th August 2018
Abstract
Effective visible-light-driven Ag3PO4/GO/NiFe2O4 Z-scheme magnetic composites were successfully fabricated by a simple ion-exchange deposition method. The Ag3PO4/GO/NiFe2O4 (8%) composite exhibited excellent photocatalytic activity (degradation efficiency was ∼96% within 15 min and kinetic constant reached 0.1956 min−1) and stability when compared to Ag3PO4, NiFe2O4, and Ag3PO4/NiFe2O4 for rhodamine B (RhB) degradation. Furthermore, by electrochemical and fluorescence measurements, the Ag3PO4/GO/NiFe2O4 (8%) material also showed larger transient photocurrent, lower impedance, and longer fluorescence lifetime (7.82 ns). Comparing the activity result dependence with characterization results, it was indicated that photocatalytic activity depended on fast charge transfer from Ag3PO4 to NiFe2O4 through GO sheet. The h+ and ·O2− species played important roles in RhB degradation under visible-light. A possible Z-scheme mechanism is proposed over the Ag3PO4/GO/NiFe2O4 (8%) composite. This study might provide a promising visible light responsive photocatalyst for the photocatalytic degradation of organic dyes in wastewater.
1. Introduction
Nowadays, abundant textile dyes have been discharged into the environment with the development of the economy and industry. This poses a serious threat to the environment and human health worldwide.1–4 Developing environment-friendly, effective, stable and low-cost technology for water treatment is one of the key issues.5 Among various dye wastewater treatment technologies (such as traditional biological methods, adsorption, reverse osmosis, coagulation, ozonation, electrochemical method, and Fenton process),6–14 semiconductor-based photocatalysis allows the use of sunlight, which is a clean and renewable source of energy, for the destruction of dye pollutants.15–18 To date, various metal oxides and sulfide and phosphate composites have been investigated for the development of effective photocatalysts.19–21 Recently, significant attention has been directed toward the design and synthesis of highly efficient visible-light-driven photocatalysts (such as Ag3PO4 and AgBr) that can utilize solar energy.22,23 However, Ag3PO4 suffers from poor photostability due to fast photoreduction to metallic Ag.24–27 Therefore, it is urgently required to develop effective strategies to improve the stability of Ag3PO4 while simultaneously maintaining or enhancing its photocatalytic performance.28,29
Many efforts have been made to overcome the abovementioned disadvantages, and a variety of Ag3PO4-based composite photocatalysts were suggested using methods, including hybridization, morphology control, and semiconductor hetero-coupling.30 The development of multifunctional adsorption materials has been a major area of focus in the field of contaminant remediation over the last decade. Magnetic nanomaterials have attracted much attention because of their unique physical and chemical properties and potential applications in the separation and removal of pollutants from the environment.31 Ferrites are one of the most promising photocatalysts with the characteristic behavior of absorbing visible light, and possess band gaps in the range 1.1–2.3 eV.32 Moreover, ferrites overcome the technical problem of separation and reuse as they are magnetically separable.33,34 Among the class of ferrites, nickel ferrite (NiFe2O4) is significant because of its excellent chemical stability, remarkable mechanical hardness, high electromagnetic performance and ferromagnetic behavior.35 Some researchers found that ferrite semiconductors could inhibit Ag3PO4 photocorrosion, according to the previous reports.27,36 However, the semiconductor–semiconductor contact interface is a crucial factor in ensuring continuous flow of electrons between the source and target photocatalysts.37
Graphene-oxide (GO), similar to graphene, has attracted great attention because of its unique properties. Particularly, great efforts have been devoted towards the preparation of semiconductor/GO composites aimed at improving charge transportation and separation.2,38 However, if the contact interfaces of Ag3PO4–NiFe2O4 composites could introduce a solid electron mediator (GO), whose effective suppression of charge recombination would result in the improvement of photocatalytic activity and stability.
Herein, visible-light-driven Ag3PO4/GO/NiFe2O4 composites were successfully fabricated by a simple ion-exchange deposition method and showed remarkably enhanced photocatalytic activity as compared to Ag3PO4, NiFe2O4, and Ag3PO4/NiFe2O4 for RhB degradation under visible light irradiation. Based on characterization results of all samples, it was indicated that the photocatalytic activity depended on efficient photogenerated charge separation. Moreover, Ag3PO4/GO/NiFe2O4 (8%) could be easily removed from water by adding an external magnetic field and could be reused. h+ and ·O2− species played important roles in RhB degradation under visible-light. A possible Z-scheme mechanism for RhB degradation over the Ag3PO4/GO/NiFe2O4 (8%) photocatalyst is proposed.
2. Experimental
2.1. Catalyst preparation
2.1.1 Synthesis of Ag3PO4. All reagents were of analytical grade and used without further purification. Ammonia solution (1 M) was slowly added to 100 mL (15.1 g) AgNO3 solution dropwise under vigorous stirring to form silver ammonia solution. Subsequently, 100 mL Na2HPO4 (6.82 g) was added dropwise to the above dispersion with mechanical agitation, followed by sonication for another 20 min. Finally, the precipitates in the solution were centrifuged and meticulously washed with deionized water. The as-obtained samples were dried at 65 °C for 12 h under vacuum.
2.1.2 Synthesis of NiFe2O4. NiFe2O4 nanostructure was successfully prepared by a simple hydrothermal process according to the previous literature.39 Briefly, to an aqueous solution (200 mL) containing Ni(NO3)2·6H2O (2.27 g) and Fe(NO3)3·9H2O (5.34 g), NaOH solution (2.0 M) was added with magnetic stirring at room temperature (RT). The mixture was then transferred to a Teflon-lined stainless-steel autoclave of 140 mL capacity. The sealed tank was heated to and maintained at 180 °C for 12 h in an oven and cooled to RT. The resultant brown precipitates were collected by filtration and washed with water and ethanol more than 3 times, and finally dried in an oven at 60 °C for 12 h.
2.1.3 Synthesis of graphite oxide (GO). GO was prepared from natural flake graphite according to the modified Hummer's method.40 In a typical synthesis, 2.0 g graphite powder was added to 80 mL cold (0 °C) concentrated H2SO4 in an ice bath. Then, NaNO3 (4.0 g) and KMnO4 (8.0 g) were added gradually under stirring and the temperature of the mixture was maintained below 10 °C. The reaction mixture was continually stirred for 4 h at temperature below 10 °C. Successively, the mixture was stirred at 35 °C for 4 h, and then diluted with 200 mL deionized (DI) water. After adding DI water, the mixture was stirred for 1 h. The reaction was then terminated by adding 15 mL 30% H2O2 solution. The solid product was separated by centrifugation and washed repeatedly with 5% HCl solution until sulfate could not be detected with BaCl2. For further purification, the resultant solid was re-dispersed in DI water and dialyzed for 3 days to remove residual salts and acids. The suspension was dried in a vacuum oven at 45 °C for 48 h to obtain graphite oxide.
2.1.4 Synthesis of Ag3PO4/NiFe2O4. Ag3PO4/NiFe2O4 composite was prepared by a simple ion-exchange deposition method. The loading of NiFe2O4 was 8% for Ag3PO4/NiFe2O4 composite. Typically, 1 M ammonia solution was slowly added to 100 mL (15.1 g) AgNO3 solution dropwise with vigorous stirring to form silver ammonia solution. Then, a certain amount of NiFe2O4 sample was added under vigorous stirring and sonication for 30 min. Na2HPO4 (6.82 g, 100 mL) was added dropwise to the above dispersion with mechanical agitation, followed by sonication for another 20 min. Finally, the obtained precipitates were centrifuged and washed with deionized water. The as-obtained samples were dried at 65 °C for 12 h under vacuum.
2.1.5 Synthesis of GO/NiFe2O4. GO/NiFe2O4 was prepared by a hydrothermal process as previously reported.41 A certain amount of GO (138 mL, 5 mg mL−1) solution dissolved in 62 mL deionized water. Next, 2.27 g Ni(NO3)2·6H2O and 5.34 g Fe(NO3)3·9H2O were added with stirring at room temperature for a certain period of time. Then, excess NaOH was added to the solution slowly until pH = 10.5. The mixture was transferred to a Teflon-lined autoclave and maintained at 180 °C for 12 h. The composites were washed with deionized water several times and dried at 60 °C for 12 h under vacuum. The theoretical loading of GO was 30% in GO/NiFe2O4 catalyst.
2.1.6 Synthesis of Ag3PO4/GO/NiFe2O4 composites. The as-obtained GO/NiFe2O4 powder was used for composite preparation. The synthesis of Ag3PO4/GO/NiFe2O4 composites was carried out by a simple ion-exchange deposition method.41 The GO/NiFe2O4 loading was x% (x = 4, 8, 12 and 16) and denoted as Ag3PO4/GO/NiFe2O4(x%). Typically, taking Ag3PO4/GO/NiFe2O4 (8%) catalyst as an example, 1 M ammonia solution was slowly added to 100 mL (15.1 g) AgNO3 solution dropwise under vigorous stirring to form silver ammonia solution. Subsequently, 0.64 g GO/NiFe2O4 (30%) sample was added under vigorous stirring and sonicated for 30 min. Then, 100 mL Na2HPO4 (6.82 g) was added dropwise to the above dispersion with mechanical agitation and then sonicated for another 20 min. The obtained precipitate was centrifuged, washed with deionized water several times, and dried at 65 °C for 12 h. Finally, the products were collected and ground to powder by an agate mortar for further use.
2.2. Characterization techniques
The phase formation in the composites was investigated via powder X-ray diffraction (XRD) on a Rigaku D/max 2400/PC diffractometer with Cu Kα (λ = 1.5406 Å) at 40 kV and 150 mA. Diffraction patterns in the 5–90° region were recorded at the rate of 5° min−1. The chemical compositions and chemical bonding states of the specimens were defined by X-ray photoelectron spectroscopy (XPS, equipped with a standard monochromatic Al Kα source (hν) 1486.6 eV, ESCALAB 250Xi, ThermoFisher Scientific, UK). Field emission scanning electron microscopy (FE-SEM, HITACHI S-4800) and energy-dispersive X-ray spectroscopy analysis (Thermo Fisher, Noran 7) were employed for detailed discussion of morphologies of the specimens. Transmission electron microscopy (TEM) and HRTEM images were taken with a Tecnai-G2-F30 field emission transmission electron microscope operating at an accelerating voltage of 300 kV. Absorbance spectra of the samples were recorded on a UV-vis spectrometer (UV-765 UV-vis spectrometer, Shanghai Jingke) in the range of 200–800 nm. UV-vis diffuse reflectance spectra (DRS) of the samples were recorded using a UV/Vis/NIR PerkinElmer Lambda 950 double beam spectrophotometer equipped with a standard 150 mm integrating sphere, and total reflectance was measured relative to a BaSO4 reference. TOC was determined using a TOC analyzer (Elementar vario TOC cube, Hanau, Germany). Magnetic hysteresis loops at room temperature were obtained using a VSM (LAKESHORE-7304, USA) at room temperature. The photoluminescence (PL) spectra of samples were investigated on an Edinburgh FL/FS900 spectrophotometer with excitation wavelength of 350 nm.
2.3. Photocatalytic activities measurement
Photocatalytic activities of all the samples were measured by photocatalytic degradation of aqueous RhB (10 mg L−1) solutions, where the photocatalytic reaction was conducted in a specially designed glass reactor equipped with a water-cooling system to maintain the solution at room temperature. The light source was designed for 300 W xenon short arc lamps equipped with ultraviolet cutoff filter (providing visible light ≥400 nm). Typically, 20 mg sample was added to 100 mL aqueous solution of organic dye, and the reactant was mixed quickly. Prior to irradiation, the suspension was magnetically stirred in the dark for 20 min to establish adsorption–desorption equilibrium between photocatalysts and organic dyes. The as-obtained solution was then exposed to irradiation with fixed distance of 15 cm under magnetic stirring. At regular intervals of time, 4 mL of the suspension was withdrawn and immediately filtered with a filter membrane to remove the photocatalysts; the initial concentration of RhB (10 mg L−1) in the solution was defined as C0 and the resulting concentration of the solution was named C. The absorbance of the filtered solution was measured using a UV visible spectrophotometer. The C/C0 ratio as a function of irradiation time was used to evaluate the degradation efficiency of photocatalyst. In addition, to accomplish the next cycle of experiment, the catalyst was recovered from the solution using an external magnet after completion of the reaction. The magnetically recovered-catalyst was washed, dried, and weighed for further use.
2.4. Electrochemical measurements
All electrochemical measurements were recorded on an electrochemical analyzer (CHI660E) in a homemade standard three-electrode quartz cell comprising an organic glass enclosure with a quartz window and a 1.2 cm diameter opening opposite the window to the clamped working electrode. A platinum plate was used as the counter electrode and a saturated calomel electrode (SCE) was used as the reference electrode. The working electrode was prepared by drop-coating sample suspensions and Nafion directly on a pre-cleaned indium tin oxide glass (ITO glass) surface. The surface area of the working electrode exposed to the electrolyte was about 0.95 cm2. The electrolyte was 0.01 M Na2SO4 aqueous solution without any additives. The visible light irradiation source was a 300 W Xe lamp system equipped with 400 nm cut-off filter.
3. Results and discussion
3.1. X-ray diffraction analysis
The crystallographic structure and phase purity of all samples were examined by powder X-ray diffraction. As shown in Fig. 1, all the diffraction peaks of NiFe2O4 resemble the cubic spinel structure (JCPDS no. 10-0325). The diffraction peaks at 18.39, 30.29°, 35.70°, and 62.92° were indexed to the (111), (220), (311) and (440) crystal planes of NiFe2O4, respectively.42 In the spectrum of Ag3PO4, all of the peaks could be indexed to the cubic structural phase (JCPDS no. 06-0505).43,44 The peaks at 10.6° were attributed to the (002) crystal planes of GO (marked with ♦).45 In the case of Ag3PO4/GO/NiFe2O4 (8%) nanocomposite, the major diffraction peaks (marked with ♥![[thin space (1/6-em)]](https://www.rsc.org/images/entities/char_2009.gif) and ♣ ) could be clearly indexed to the cubic Ag3PO4 phase and cubic NiFe2O4 spinel phase. This result further illustrates that the Ag3PO4/GO/NiFe2O4 composite was successfully synthesized by a simple ion-exchange deposition method.
and ♣ ) could be clearly indexed to the cubic Ag3PO4 phase and cubic NiFe2O4 spinel phase. This result further illustrates that the Ag3PO4/GO/NiFe2O4 composite was successfully synthesized by a simple ion-exchange deposition method.
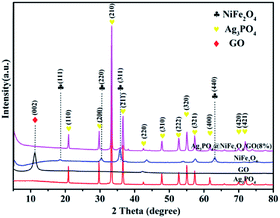 |
| | Fig. 1 XRD patterns of Ag3PO4, GO, NiFe2O4, and Ag3PO4/GO/NiFe2O4 (8%) samples. | |
3.2. X-ray photoelectron spectroscopy analysis
XPS analysis was performed to investigate the chemical composition and bonding state of the Ag3PO4/GO/NiFe2O4 (8%) photocatalyst. Fig. 2a shows the XPS survey (wide-scan) spectrum confirming the existence of P, C, Ag, O, Fe, and Ni in the Ag3PO4/GO/NiFe2O4 (8%) composite. In Fig. 2b, Ag 3d XPS spectrum shows that peaks located at 374.03 and 367.96 eV can be ascribed to Ag 3d3/2 and Ag 3d5/2, respectively, indicating the existence of Ag+.46,47 No peaks were found at 369.2 or 375.8 eV, verifying the absence of Ag0.48 As shown in Fig. 2c, the peaks centered at 711.3 eV (Fe 2p3/2) and 725.6 eV (Fe 2p1/2) might be ascribed to Fe3+.49 XPS peaks of Ni 2p can be found at 856.7 eV and 874.4 eV (Fig. 2d) and can be assigned to Ni 2p3/2 and Ni 2p1/2, respectively, corresponding to Ni2+.50 The observed P 2p binding energies at 133.8 eV were typical of oxidized phosphate species (PO43−) in Ag3PO4 (shown in Fig. 2e).51,52 The high resolution spectrum for the C 1s region revealed four carbon peaks, which were located at 284.9 eV, 286.3 eV, 287.5 eV, and 289.3 eV (see Fig. 2f). The peaks at 284.9 and 286.3 eV are typical of C![[double bond, length as m-dash]](https://www.rsc.org/images/entities/char_e001.gif) C and C–OH bonds, and the peaks at 287.5 and 289.3 eV are usually associated with C–O–C and C
C and C–OH bonds, and the peaks at 287.5 and 289.3 eV are usually associated with C–O–C and C![[double bond, length as m-dash]](https://www.rsc.org/images/entities/char_e001.gif) O bonds, respectively. These results are in good agreement with those previously reported.1,53 The abovementioned XPS results confirmed the coexistence of GO/NiFe2O4 and Ag3PO4 in Ag3PO4/GO/NiFe2O4 composites.
O bonds, respectively. These results are in good agreement with those previously reported.1,53 The abovementioned XPS results confirmed the coexistence of GO/NiFe2O4 and Ag3PO4 in Ag3PO4/GO/NiFe2O4 composites.
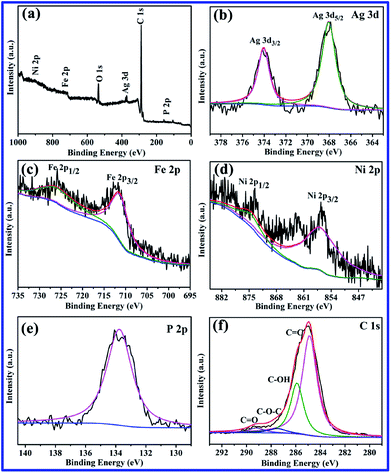 |
| | Fig. 2 XPS spectra of Ag3PO4/GO/NiFe2O4 (8%) sample. (a) The fully scanned spectrum, and high resolution spectra of (b) Ag 3d, (c) Fe 2p, (d) Ni 2p, (e) P 2p, and (f) C 1s. | |
3.3. UV-vis DRS FTIR transmittance spectroscopy analysis
Fig. 3a presents the UV-vis diffuse reflectance spectra (DRS) of NiFe2O4, Ag3PO4, and Ag3PO4/GO/NiFe2O4 (8%) samples, which are widely used to measure the optical properties of semiconductor materials. Clearly, the Ag3PO4/GO/NiFe2O4 (8%) composite absorbed in both ultraviolet light and visible light regions and the largest wavelength of incident light was about 490 nm. The estimated values of band gap energies (Eg) were obtained by extrapolation of the linear parts of the curves obtained by plotting (αhv)2 versus hv. As shown in Fig. 3b, Eg of Ag3PO4, NiFe2O4, and Ag3PO4/GO/NiFe2O4 (8%) were 2.42 eV 1.67 eV, and 2.01 eV, respectively. These values are in agreement with those obtained in earlier reports.54,55 Fig. 4 shows the FTIR spectra of GO, Ag3PO4, Ag3PO4//NiFe2O4, and Ag3PO4/GO/NiFe2O4 (8%) samples over the range of 400–4000 cm−1. The strong bands centered at 555 cm−1 were assigned to the O![[double bond, length as m-dash]](https://www.rsc.org/images/entities/char_e001.gif) P–O bending vibration and those at 1010 cm−1 were assigned to the asymmetric stretching of PO43− groups.56 The 1650 cm−1 band was ascribed to the H2O bending mode. The absorption band at 3400–3650 cm−1 was related to the stretching vibration of adsorbed water.57,58 As expected for NiFe2O4 structures, there were two broad bands with low transmittances in the range of 400–525 cm−1 and 560–630 cm−1 that were observed in each spectrum.59–61 Accordingly, these two absorption bands were related to tetrahedral and octahedral vibrational trivalent cations of Fe3+. Different vibrational modes in the octahedral and tetrahedral components were attributed to linked distance differences of Fe3+–O2− in the two modes.59 In the spectrum of GO, the absorption bands at 1620 cm−1 and 1400 cm−1 corresponded to the C–O stretching and deformation vibration from carboxyl, and the absorption bands centered at 3390 cm−1 and 1247 cm−1 were attributed to the O–H stretching and CO stretching vibrations of the –COOH group.62
P–O bending vibration and those at 1010 cm−1 were assigned to the asymmetric stretching of PO43− groups.56 The 1650 cm−1 band was ascribed to the H2O bending mode. The absorption band at 3400–3650 cm−1 was related to the stretching vibration of adsorbed water.57,58 As expected for NiFe2O4 structures, there were two broad bands with low transmittances in the range of 400–525 cm−1 and 560–630 cm−1 that were observed in each spectrum.59–61 Accordingly, these two absorption bands were related to tetrahedral and octahedral vibrational trivalent cations of Fe3+. Different vibrational modes in the octahedral and tetrahedral components were attributed to linked distance differences of Fe3+–O2− in the two modes.59 In the spectrum of GO, the absorption bands at 1620 cm−1 and 1400 cm−1 corresponded to the C–O stretching and deformation vibration from carboxyl, and the absorption bands centered at 3390 cm−1 and 1247 cm−1 were attributed to the O–H stretching and CO stretching vibrations of the –COOH group.62
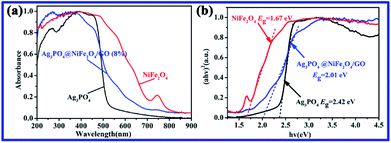 |
| | Fig. 3 (a) UV-vis DRS and (b) the plot of (αhv)2 vs. hv of NiFe2O4, Ag3PO4, and Ag3PO4/GO/NiFe2O4 (8%). | |
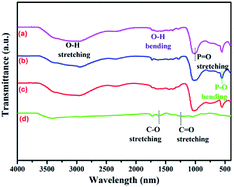 |
| | Fig. 4 FTIR spectra of (a) Ag3PO4/GO/NiFe2O4 (8%), (b) Ag3PO4/NiFe2O4, (c) Ag3PO4 and (d) GO samples. | |
3.4. FE-SEM and TEM analysis
To better understand the structures and morphologies of GO, Ag3PO4, and Ag3PO4/GO/NiFe2O4 (8%), characterization of FE-SEM and TEM images of all the samples was performed. As shown in Fig. 5a, pure Ag3PO4 has cubic structure with average diameter of 4 μm. NiFe2O4 particles were dispersed on Ag3PO4 surface and the average particle diameter was 50 nm (see Fig. 5b). TEM images of GO and Ag3PO4/GO/NiFe2O4 (8%) samples are given in Fig. 5c and d, respectively. Clearly, Ag3PO4/GO/NiFe2O4 (8%) has a large number of NiFe2O4 nanoparticles and the GO sheet was located on the Ag3PO4 surface. d-spacing fringes of 0.269 nm matching (210) planes of cubic Ag3PO4 phase and d-spacing fringes of 0.295 and 0.252 nm matching the (220) and (311) planes of cubic NiFe2O4 spinel structure are also observed in Fig. 5e. SAED of Ag3PO4/GO/NiFe2O4 (8%) exhibits an alternate lattice spacing characteristic (see Fig. 5f). All the above results indicate that GO/NiFe2O4 nanoparticles combined successfully with the Ag3PO4 surface. The energy dispersive X-ray (EDX) data proved the presence of Ag, P, O, Ni, Fe, and C in Ag3PO4/GO/NiFe2O4 (8%) (see Fig. 6a). In addition, Fig. 6b shows a dark field image of high-angle annular scanning transmission electron microscopy (HAADF-STEM). Moreover, elemental mapping of Ag3PO4/GO/NiFe2O4 (8%) samples distinctly indicated that the distributions of Ag, P, O, Ni, Fe, and C were relatively homogeneous on the Ag3PO4/GO/NiFe2O4 (8%) surface.
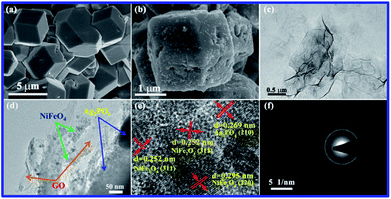 |
| | Fig. 5 SEM images of Ag3PO4 (a) and Ag3PO4/NiFe2O4 (b); TEM images of GO (c) and Ag3PO4/GO/NiFe2O4 (8%) (d); HRTEM (e) and SAED (f) of Ag3PO4/GO/NiFe2O4 (8%) composite. | |
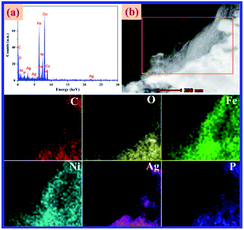 |
| | Fig. 6 (a) EDX and (b) HAADF-STEM and elemental mapping images of Ag3PO4/GO/NiFe2O4 (8%) composite. | |
3.5. Photocatalytic activity
As shown in Fig. 7a, Ag3PO4/GO/NiFe2O4 (8%) decomposed ∼96% of RhB within 15 min of irradiation. More importantly, the photocatalytic activity of Ag3PO4/GO/NiFe2O4 (8%) exceeded that of other samples under the same conditions. The reaction rate constants (k, min−1) were determined from the first-order equation: ln(C0/C) = kt. As shown in Fig. 7b, Ag3PO4/GO/NiFe2O4 (8%) exhibits higher rate constant (k = 0.1956 min−1) than those of Ag3PO4, NiFe2O4, and Ag3PO4/NiFe2O4.
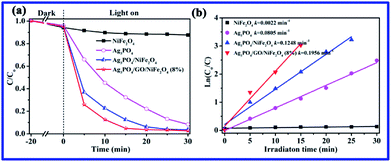 |
| | Fig. 7 (a) Photocatalytic activities of Ag3PO4, NiFe2O4, Ag3PO4/NiFe2O4, and Ag3PO4/GO/NiFe2O4 (8%) composites for RhB degradation, and (b) plots of ln(C0/C) versus irradiation time. | |
To further demonstrate the excellent performance of Ag3PO4/GO/NiFe2O4 (8%) and other Ag3PO4-based photocatalysts, a detailed comparison of RhB degradation rate constant on Ag3PO4-based photocatalyst under visible light irradiation is shown in Table 1. The Ag3PO4/GO/NiFe2O4 (8%) photocatalyst exhibited excellent photocatalytic activity (k = 0.1956 min−1), further confirming its outstanding photocatalytic behavior.
Table 1 Photocatalytic degradation of RhB by Ag3PO4-based photocatalysts in aqueous solution
| Photoactive nanocomposite |
Initial dye conc. (mg L−1) |
Catalyst dose (g L−1) |
Rate constant (min−1) |
Reference |
| Ag3PO4/GO/NiFe2O4 (8%) |
10 |
0.2 |
0.1956 |
In this work |
| Ag3PO4 |
10 |
0.5 |
0.0372 |
63 |
| Ag3PO4/SnSe2 |
10 |
0.66 |
0.0724 |
64 |
| Ag3PO4/RGO/Ag |
10 |
0.5 |
0.1411 |
65 |
| Ag3PO4/TiO2 |
10 |
0.25 |
0.1300 |
66 |
| TiO2/Ag3PO4/GO |
10 |
0.5 |
0.1281 |
67 |
| Ag3PO4/g-C3N4 |
10 |
0.5 |
0.0739 |
68 |
| GO/Ag3PO4/g-C3N4 |
10 |
0.4 |
0.162 |
69 |
In addition, the effect of different loadings of GO/NiFe2O4 over Ag3PO4/GO/NiFe2O4 on the photocatalytic activity was studied, as shown in Fig. 8a. Clearly, Ag3PO4/GO/NiFe2O4 (8%) showed excellent photocatalytic activity for RhB degradation. The UV-vis absorbance spectra of RhB solution with Ag3PO4/GO/NiFe2O4 (8%) under visible light irradiation at different times are shown in Fig. 8b. It could be observed that the characteristic absorption peak at 553 nm steadily decreased as the exposure time increased during the process of RhB photodegradation. Correspondingly, the original color of RhB dye solution completely disappeared. This further indicated that Ag3PO4/GO/NiFe2O4 (8%) exhibited excellent photocatalytic activity for RhB decomposition under visible light.
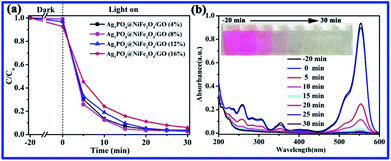 |
| | Fig. 8 (a) Photocatalytic activities of Ag3PO4/GO/NiFe2O4 (x%, x = 4, 8, 12, 16) for RhB degradation, (b) RhB solution UV-visible spectra at different irradiation times for Ag3PO4/GO/NiFe2O4 (8%). | |
As shown in Fig. 9a, the TOC result suggests that 43% of RhB was mineralized in the photocatalytic system of Ag3PO4/GO/NiFe2O4 (8%) composite within 30 min of irradiation. To investigate the magnetic properties of all samples, the M − H loop is depicted in Fig. 9b. Ms of pure NiFe2O4 and Ag3PO4/GO/NiFe2O4 (8%) composite were 34.56 and 2.92 emu g−1, respectively. The Ag3PO4/GO/NiFe2O4 (8%) composite has good magnetic properties due to introduction of magnetic NiFe2O4. The Ag3PO4/GO/NiFe2O4 (8%) composite not only showed high photocatalytic activity for degradation of RhB, but also could be easily separated from water bodies, effectively avoiding secondary pollution. Apart from photocatalytic activity, the stability of the photocatalyst is also an important factor for practical application of this material.
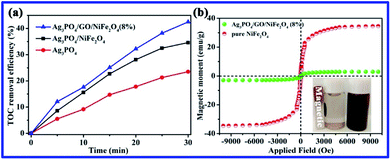 |
| | Fig. 9 (a) TOC removal efficiency for the photodegradation of RhB over pure Ag3PO4, Ag3PO4/NiFe2O4, and Ag3PO4/GO/NiFe2O4 (8%); (b) the M − H loops of NiFe2O4 and Ag3PO4/GO/NiFe2O4 (8%). | |
Furthermore, control experiments were performed and the results were given in Fig. 10. Clearly, the RhB degradation efficiency was 2.9% without any photocatalyst under visible light after 30 min irradiation; this degradation was mainly due to the RhB self-sensitization effect.10,70 The degradation efficiency of the GO/NiFe2O4 sample was lower (about 13.7%). Compared to the other samples, the GO/NiFe2O4 sample exhibited low photocatalytic activity for RhB degradation under visible light irradiation. These results further confirmed that the photocatalytic activity enhancement of Ag3PO4/GO/NiFe2O4 (8%) catalyst was not induced by the self-sensitization effect but rather by Ag3PO4.
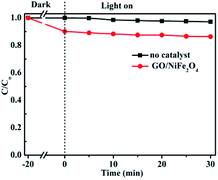 |
| | Fig. 10 Photocatalytic degradations of RhB in GO/NiFe2O4 and blank (no catalyst) systems with visible light irradiation. | |
3.6. Stability test of Ag3PO4/GO/NiFe2O4 (8%) sample
To study the photocatalytic stability of the Ag3PO4/GO/NiFe2O4 (8%) sample, cycling degradation experiments of RhB dyes were performed, and the results are shown in Fig. 11a. Clearly, Ag3PO4/GO/NiFe2O4 (8%) exhibited excellent stability during four cycles of degradation of RhB solution under visible-light irradiation. As shown in Fig. 11b, it was found that the used Ag3PO4/GO/NiFe2O4 (8%) catalyst had no significant difference between fresh sample and used sample in terms of crystal phase structure.
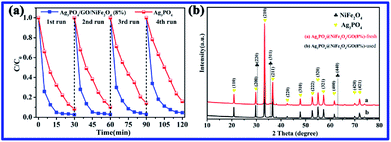 |
| | Fig. 11 (a) Stability tests of the Ag3PO4 and Ag3PO4/GO/NiFe2O4 (8%) composites. (b) XRD of Ag3PO4/GO/NiFe2O4 (8%) fresh and used samples. | |
In addition, the Ag3PO4/GO/NiFe2O4 (8%) fresh and used catalysts were characterized by SEM (see Fig. 12). For Ag3PO4/GO/NiFe2O4 (8%)-fresh sample, the SEM result showed cubic structure morphology with size of ∼3 μm (see Fig. 12a). Compared with the morphology of Ag3PO4/GO/NiFe2O4 (8%)-fresh sample, the morphology of the used photocatalyst showed slight photocorrosion phenomenon (shown in Fig. 12b). Recently, it was found that the introduction of other components (such as GO, g-C3N4, ZnFe2O4, PANI) on the surface of Ag3PO4 suppressed Ag3PO4 photocorrosion.10,12,53,71 This result further implied that the presence of GO/NiFe2O4 enhanced the stability of Ag3PO4, which might be attributed to the protective role of GO/NiFe2O4 in the process of photocorrosion of Ag3PO4. Therefore, the Ag3PO4/GO/NiFe2O4 (8%) composite is a stable visible-light-driven photocatalyst for RhB degradation.
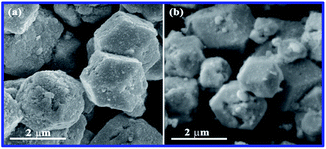 |
| | Fig. 12 SEM images of (a) Ag3PO4/GO/NiFe2O4 (8%)-fresh and (b) used samples for RhB degradation. | |
3.7. Electrochemical analysis
To further explore the role of GO in Ag3PO4/GO/NiFe2O4 (8%), electrochemical analyses, including transient photocurrent response and electrochemical impedance spectroscopy (EIS) Nyquist plots (shown in Fig. 13), of all samples were carried out. The transient photocurrent–time curves of pure GO, Ag3PO4, Ag3PO4/NiFe2O4, and Ag3PO4/GO/NiFe2O4 (8%) samples were measured by several on–off runs (see Fig. 13a). It was easily observed that the photocurrent over Ag3PO4/GO/NiFe2O4 (8%) electrode was greatly improved compared to that of the other electrodes. These results indicated that the Ag3PO4/GO/NiFe2O4 (8%) composite significantly enhanced photoelectric response compared with GO, Ag3PO4, and Ag3PO4/NiFe2O4 systems, which was beneficial for the former's enhanced photocatalytic activity.72,73 In addition, Fig. 13b displays that the Nyquist plots from the EIS analysis cycled in 0.01 M Ns2SO4 electrolyte solution exhibit semicircles at high frequencies. Considering that the preparation of electrodes and the electrolyte used are identical, the high frequency semicircle is relevant to the resistance of the electrode.74 In electrochemical spectra, the high-frequency arc corresponds to the charge transfer limiting process and can be attributed to double-layer capacitance (Cdl) in parallel with charge transfer resistance (Rct) at the contact interface between the electrode and electrolyte solution.75,76 In the Nyquist plots, the Ag3PO4/GO/NiFe2O4 (8%) sample exhibited the smallest semicircle compared with that of GO, Ag3PO4, and Ag3PO4/NiFe2O4 electrodes. The charge transfer resistance Rct of Ag3PO4/GO/NiFe2O4 (8%) was 118.2 Ω, which was much smaller than that of Ag3PO4 and Ag3PO4/NiFe2O. Clearly, the introduction of GO led to a significantly decreased diameter in the semicircular Nyquist plot as compared to that of Ag3PO4/NiFe2O4, suggesting faster charge transfer rate in the Z-scheme system.77–79
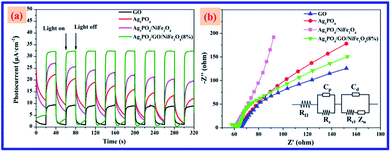 |
| | Fig. 13 (a) Transient photocurrent response and (b) electrochemical impedance spectroscopy (EIS) Nyquist plots of GO, Ag3PO4, Ag3PO4/NiFe2O4, and Ag3PO4/GO/NiFe2O4 (8%) electrodes in 0.01 M Na2SO4 aqueous solution. | |
3.8. Photoluminescence intensity and lifetime analysis
Furthermore, the photoluminescence (PL) spectra of Ag3PO4, Ag3PO4/NiFe2O4, and Ag3PO4/GO/NiFe2O4 (8%) samples are displayed in Fig. 14. PL spectra of all samples were excited using excitation wavelength at 350 nm. Apparently, the fluorescence intensity of Ag3PO4/GO/NiFe2O4 (8%) decreased compared to that of Ag3PO4 and Ag3PO4/NiFe2O4 samples, further demonstrating that the fluorescence of Ag3PO4/GO/NiFe2O4 (8%) was quenched by the introduction of GO mediator. Generally, lower PL signal signifies higher separation efficiency of electron–hole pairs.80 In other words, the PL results demonstrated the improved electron–hole pair separation efficiency of the Ag3PO4/GO/NiFe2O4 (8%) composite.
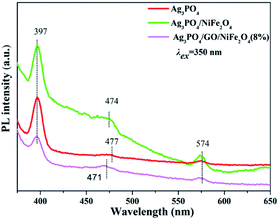 |
| | Fig. 14 Photoluminescence spectra of Ag3PO4, Ag3PO4/NiFe2O4 and Ag3PO4/GO/NiFe2O4 (8%) samples in pure water at excitation wavelength of 350 nm. [Catalyst] = 1 mg mL−1. | |
Fluorescence lifetimes were acquired by fitting the decay profiles with two exponential terms (see Table 2). Apparently, the average lifetimes of Ag3PO4, Ag3PO4/NiFe2O4, and Ag3PO4/GO/NiFe2O4 (8%) were 6.98, 5.81, and 7.82 ns, respectively. The slower PL decay kinetics and longer fluorescence lifetimes of Ag3PO4/GO/NiFe2O4 (8%) implied the photo-excited electron transfer from the conduction band (CB) of Ag3PO4 to the valence band (VB) of NiFe2O4 by GO mediator. The PL result is in good agreement with the electrochemical results.
Table 2 Average fluorescence lifetimes of Ag3PO4, Ag3PO4/NiFe2O4 and Ag3PO4/GO/NiFe2O4 (8%) samples in pure H2O; [catalyst] = 1 mg mL−1
| Samples |
Lifetime, τ (ns) |
Pre-exponential factors B |
Average lifetime, 〈τ〉 (ns) |
χ2 |
| Ag3PO4 |
τ1 = 9.53 |
B1 = 33.36 |
6.98 |
1.103 |
| τ2 = 3.52 |
B2 = 66.64 |
| Ag3PO4/NiFe2O4 |
τ1 = 4.38 |
B1 = 27.01 |
5.81 |
1.203 |
| τ2 = 6.18 |
B2 = 72.99 |
| Ag3PO4/GO/NiFe2O4 (8%) |
τ1 = 8.40 |
B1 = 51.14 |
7.82 |
1.109 |
| τ2 = 7.09 |
B2 = 48.86 |
3.9. Possible photocatalytic mechanism
Generally, ·O2−, h+ and ·OH play important roles in organic dye degradation.81 To realize the underlying photocatalytic mechanism, various scavengers (1 mM EDTA-Na2 for h+, 1 mM isopropanol for ·OH, and 1 mM ascorbic acid for ·O2−) were added to the photocatalytic system.79 As shown in Fig. 15, it is found that the degradation rate was drastically inhibited by addition of h+ and ·O2− capture agents EDTA-Na2 and ascorbic acid, respectively, which further illuminated that h+ and ·O2− played important roles in RhB degradation process.
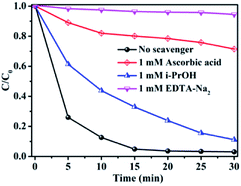 |
| | Fig. 15 Photocatalytic activity of Ag3PO4/GO/NiFe2O4 (8%) with different quenchers. | |
A possible mechanism is proposed for RhB degradation over Ag3PO4/GO/NiFe2O4 (8%) under visible-light irradiation (see Scheme 1). The Z-scheme mechanism reveals that the photocatalysts retain stronger oxidation and reduction ability, which deeply contribute to the improvement in photocatalytic activity.82 The photogenerated electrons from NiFe2O4 can reduce O2 to ·O2− (φ°(O2/·O2−) = −0.33 V vs. NHE) through a one-electron reduction reaction.83 This was mainly because the CB potential of NiFe2O4 was −0.60 eV. ·O2− and h+ species with strong oxidation abilities can degrade the RhB dye to organic intermediate products,84 which was confirmed via TOC removal efficiency spectra of RhB eliminated by Ag3PO4/GO/NiFe2O4 (8%) composite (see Fig. 8a). This result further suggested that GO improved charge transportation and separation and enhanced photocatalytic performance.
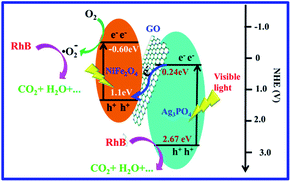 |
| | Scheme 1 Schematic diagram of the photocatalytic mechanism of Ag3PO4/GO/NiFe2O4 (8%) with visible-light irradiation. | |
4. Conclusions
In summary, an effective visible-light-driven Ag3PO4/GO/NiFe2O4 (8%) Z-scheme magnetic composite was successfully fabricated by a simple ion-exchange deposition method. Compared to Ag3PO4, NiFe2O4, and Ag3PO4/NiFe2O4, the Ag3PO4/GO/NiFe2O4 (8%) photocatalyst exhibited excellent photocatalytic activity and stability (degradation efficiency was ∼96% after 15 min irradiation) for RhB degradation under visible light irradiation. Furthermore, according to the electrochemical and fluorescence measurements, the Ag3PO4/GO/NiFe2O4 (8%) material also showed larger transient photocurrent, lower impedance, and longer fluorescence lifetime (7.82 ns). Comparing the activity result dependence with the characterization results, it was indicated that photocatalytic activity depended on fast charge transfer from Ag3PO4 to NiFe2O4 through GO sheet. h+ and ·O2− species played an important role in RhB degradation under visible-light. A possible Z-scheme mechanism is proposed for degradation over the Ag3PO4/GO/NiFe2O4 (8%) photocatalyst. This study might provide a promising visible light responsive photocatalyst for the photocatalytic degradation of organic dyes in wastewater.
Conflicts of interest
There are no conflicts to declare.
Acknowledgements
This study was financially supported by the National Natural Science Foundation of China (Grant No. 51768031, No. 51468033) and the Key Research and Development Program in Gansu Province (Grant No. 17YF1NA056).
References
- C. Mu, Y. Zhang, W. Cui, Y. Liang and Y. Zhu, Appl. Catal., B, 2017, 212, 41–49 CrossRef.
- M. N. Chong, B. Jin, C. W. K. Chow and C. Saint, Water Res., 2010, 44, 2997–3027 CrossRef PubMed.
- H. Kyung, J. Lee and W. Choi, Environ. Sci. Technol., 2005, 39, 2376–2382 CrossRef PubMed.
- Y. Zhao, R. Liu, J. Zhao, L. Xu and C. Sibille, Bioresour. Technol., 2017, 234, 224–232 CrossRef PubMed.
- B. Bethi, S. H. Sonawane, B. A. Bhanvase and S. P. Gumfekar, Chem. Eng. Process., 2016, 109, 178–189 CrossRef.
- X. Y. Huang, X. Y. Mao, H. T. Bu, X. Y. Yu, G. B. Jiang and M. H. Zeng, Carbohydr. Res., 2011, 346, 1232–1240 CrossRef PubMed.
- L. Du, J. Wu and C. Hu, Electrochim. Acta, 2012, 68, 69–73 CrossRef.
- C. Bai, X. Xiong, W. Gong, D. Feng, M. Xian, Z. Ge and N. Xu, Desalination, 2011, 278, 84–90 CrossRef.
- M. F. Hou, L. Liao, W. D. Zhang, X. Y. Tang, H. F. Wan and G. C. Yin, Chemosphere, 2011, 83, 1279–1283 CrossRef PubMed.
- L. Liu, Y. Qi, J. Lu, S. Lin, W. An, Y. Liang and W. Cui, Appl. Catal., B, 2016, 183, 133–141 CrossRef.
- W. Cui, W. An, L. Liu, J. Hu and Y. Liang, J. Hazard. Mater., 2014, 280, 417–427 CrossRef PubMed.
- L. Liu, L. Ding, Y. Liu, W. An, S. Lin, Y. Liang and W. Cui, Appl. Catal., B, 2017, 201, 92–104 CrossRef.
- H. Wang, Y. Liang, L. Liu, J. Hu, P. Wu and W. Cui, Appl. Catal., B, 2017, 208, 22–34 CrossRef.
- X. Wang, Y. Liang, W. An, J. Hu, Y. Zhu and W. Cui, Appl. Catal., B, 2017, 219, 53–62 CrossRef.
- S. Fang, K. Lv, Q. Li, H. Ye, D. Du and M. Li, Appl. Surf. Sci., 2015, 358, 336–342 CrossRef.
- A. P. Bhirud, S. D. Sathaye, R. P. Waichal, L. K. Nikam and B. B. Kale, Green Chem., 2012, 14, 2790–2798 RSC.
- Z. Zhang, S. Zhai, M. Wang, H. Ji, L. He, C. Ye, C. Wang, S. Fang and H. Zhang, J. Alloys Compd., 2016, 659, 101–111 CrossRef.
- S. K. Apte, S. N. Garaje, G. P. Mane, A. Vinu, S. D. Naik, D. P. Amalnerkar and B. B. Kale, Small, 2011, 7, 957–964 CrossRef PubMed.
- S. Livraghi, M. C. Paganini, E. Giamello, A. Selloni, C. D. Valentin and G. Pacchioni, J. Am. Chem. Soc., 2006, 128, 15666–15671 CrossRef PubMed.
- Q. Li, B. Guo, J. Yu, J. Ran, B. Zhang, H. Yan and J. R. Gong, J. Am. Chem. Soc., 2011, 133, 10878–10884 CrossRef PubMed.
- Q. Xiang, J. Yu and M. Jaroniec, J. Phys. Chem. C, 2011, 115, 7355–7363 CrossRef.
- Y. Bi, S. Ouyang, N. Umezawa, J. Cao and J. Ye, J. Am. Chem. Soc., 2011, 133, 6490–6492 CrossRef PubMed.
- F. Chen, W. An, L. Liu, Y. Liang and W. Cui, Appl. Catal., B, 2017, 217, 65–80 CrossRef.
- Y. Bi, H. Hu, S. Ouyang, Z. Jiao, G. Lu and J. Ye, J. Mater. Chem., 2012, 22, 14847–14850 RSC.
- A. Samal, D. P. Das, K. K. Nanda, B. K. Mishra, J. Das and A. Dash, Chem. - Asian J., 2016, 11, 584–595 CrossRef PubMed.
- S. S. Patil, M. G. Mali, A. Roy, M. S. Tamboli, V. G. Deonikar, D. R. Patil, M. V. Kulkarni, S. S. Al-Deyab, S. S. Yoon, S. S. Kolekar and B. B. Kale, J. Energy Chem., 2016, 25, 845–853 CrossRef.
- S. S. Patil, M. S. Tamboli, V. G. Deonikar, G. G. Umarji, J. D. Ambekar, M. V. Kulkarni, S. S. Kolekar, B. B. Kale and D. R. Patil, Dalton Trans., 2015, 44, 20426–20434 RSC.
- Y. Li, P. Wang, C. Huang, W. Yao, Q. Wu and Q. Xu, Appl. Catal., B, 2017, 205, 489–497 CrossRef.
- Q. Wu, P. Wang, F. Niu, C. Huang, Y. Li and W. Yao, Appl. Surf. Sci., 2016, 378, 552–563 CrossRef.
- X. Du, J. Wan, J. Jia, C. Pan, X. Hu, J. Fan and E. Liu, Mater. Des., 2017, 119, 113–123 CrossRef.
- F. Halouane, Y. Oz, D. Meziane, A. Barras, J. Juraszek, S. K. Singh, S. Kurungot, P. K. Shaw, R. Sanyal, R. Boukherroub, A. Sanyal and S. Szunerits, J. Colloid Interface Sci., 2017, 507, 360–369 CrossRef PubMed.
- L. Yang, Y. Zhang, X. Liu, X. Jiang, Z. Zhang, T. Zhang and L. Zhang, Chem. Eng. J., 2014, 246, 88–96 CrossRef.
- R. M. Khafagy, J. Alloys Compd., 2011, 509, 9849–9857 CrossRef.
- W. Fan, M. Li, H. Bai, D. Xu, C. Chen, C. Li, Y. Ge and W. Shi, Langmuir, 2016, 32, 1629–1636 CrossRef PubMed.
- Y. Xia, Z. He, J. Su, B. Tang, K. Hu, Y. Lu, S. Sun and X. Li, RSC Adv., 2018, 8, 4284–4294 RSC.
- Z. Chen, W. Wang, Z. Zhang and X. Fang, J. Phys. Chem. C, 2013, 117, 19346–19352 CrossRef.
- A. Iwase, Y. H. Ng, Y. Ishiguro, A. Kudo and R. Amal, J. Am. Chem. Soc., 2011, 133, 11054–11057 CrossRef PubMed.
- X. j. Chen, Y. Z. Dai, X. Y. Wang, J. Guo, T. H. Liu and F. F. Li, J. Hazard. Mater., 2015, 292, 9–18 CrossRef PubMed.
- D. Hong, Y. Yamada, T. Nagatomi, Y. Takai and S. Fukuzumi, J. Am. Chem. Soc., 2012, 134, 19572–19575 CrossRef PubMed.
- Z. Ji, X. Shen, J. Yang, G. Zhu and K. Chen, Appl. Catal., B, 2014, 144, 454–461 CrossRef.
- F. Wu, X. Wang, M. Li and H. Xu, Ceram. Int., 2016, 42, 16666–16670 CrossRef.
- B. K. Kang, M. H. Woo, J. Lee, Y. H. Song, Z. Wang, Y. Guo, Y. Yamauchi, J. H. Kim, B. Lim and D. H. Yoon, J. Mater. Chem. A, 2017, 5, 4320–4324 RSC.
- P. Ma, Y. Yu, J. Xie and Z. Fu, Adv. Powder Technol., 2017, 28, 2797–2804 CrossRef.
- T. Zhou, G. Zhang, P. Ma, X. Qiu, H. Zhang, H. Yang and G. Liu, J. Alloys Compd., 2018, 735, 1277–1290 CrossRef.
- F. Chen, S. Li, Q. Chen, X. Zheng, S. Fang and Z. Chen, Mater. Lett., 2016, 185, 561–564 CrossRef.
- Y. S. Xu and W. D. Zhang, Dalton Trans., 2013, 42, 1094–1101 RSC.
- Q. Cao, L. Xiao, J. Li, C. Cao, S. Li and J. Wang, Powder Technol., 2016, 292, 186–194 CrossRef.
- J. Cao, B. Luo, H. Lin, B. Xu and S. Chen, J. Hazard. Mater., 2012, 217–218, 107–115 CrossRef PubMed.
- Z. Xing, Z. Ju, J. Yang, H. Xu and Y. Qian, Nano Res., 2012, 5, 477–485 CrossRef.
- R. Jin, H. Jiang, Y. Sun, Y. Ma, H. Li and G. Chen, Chem. Eng. J., 2016, 303, 501–510 CrossRef.
- C. Liu, D. Yang, J. Yang, Y. Tian, Y. Wang and Z. Jiang, ACS Appl. Mater. Interfaces, 2013, 5, 3824–3832 CrossRef PubMed.
- P. Wang, Y. Li, Z. Liu, J. Chen, Y. Wu, M. Guo and P. Na, Ceram. Int., 2017, 43, 11588–11595 CrossRef.
- X. Chen, Y. Dai, J. Guo, T. Liu and X. Wang, Ind. Eng. Chem. Res., 2016, 55, 568–578 CrossRef.
- X. Chen, Y. Dai, J. Guo, F. Bu and X. Wang, Mater. Sci. Semicond. Process., 2016, 41, 335–342 CrossRef.
- S. S. Patil, M. S. Tamboli, V. G. Deonikar, G. G. Umarji, J. D. Ambekar, M. V. Kulkarni, S. S. Kolekar, B. B. Kale and D. R. Patil, Dalton Trans., 2015, 44, 20426–20434 RSC.
- S. Hokkanen, E. Repo, L. J. Westholm, S. Lou, T. Sainio and M. Sillanpää, Chem. Eng. J., 2014, 252, 64–74 CrossRef.
- J. Ma, J. Zou, L. Li, C. Yao, T. Zhang and D. Li, Appl. Catal., B, 2013, 134–135, 1–6 CrossRef.
- S. Krungchanuchat, N. Ekthammathat, A. Phuruangrat, S. Thongtem and T. Thongtem, Mater. Lett., 2017, 201, 58–61 CrossRef.
- M. Srivastava, S. Chaubey and A. K. Ojha, Mater. Chem. Phys., 2009, 118, 174–180 CrossRef.
- G. Dixit, Adv. Mater. Lett., 2012, 3, 21–28 CrossRef.
- B. Senthilkumar, R. Kalai Selvan, P. Vinothbabu, I. Perelshtein and A. Gedanken, Mater. Chem. Phys., 2011, 130, 285–292 CrossRef.
- Y. Tong, T. Lu, S. Xu and L. Xu, Mater. Lett., 2017, 200, 79–82 CrossRef.
- K. Wang, J. Xu, X. Hua, N. Li, M. Chen, F. Teng, Y. Zhu and W. Yao, J. Mol. Catal. A: Chem., 2014, 393, 302–308 CrossRef.
- P. Tan, X. Chen, L. Wu, Y. Y. Shang, W. Liu, J. Pan and X. Xiong, Appl. Catal., B, 2017, 202, 326–334 CrossRef.
- C. Cui, Y. Wang, D. Liang, W. Cui, H. Hu, B. Lu, S. Xu, X. Li, C. Wang and Y. Yang, Appl. Catal., B, 2014, 158–159, 150–160 CrossRef.
- W. Yao, B. Zhang, C. Huang, C. Ma, X. Song and Q. Xu, J. Mater. Chem., 2012, 22, 4050–4055 RSC.
- B. Lu, N. Ma, Y. Wang, Y. Qiu, H. Hu, J. Zhao, D. Liang, S. Xu, X. Li, Z. Zhu and C. Cui, J. Alloys Compd., 2015, 630, 163–171 CrossRef.
- D. Jiang, J. Zhu, M. Chen and J. Xie, J. Colloid Interface Sci., 2014, 417, 115–120 CrossRef PubMed.
- N. Wang, Y. Zhou, C. Chen, L. Cheng and H. Ding, Catal. Commun., 2016, 73, 74–79 CrossRef.
- L. Shi, F. Wang, L. Liang, K. Chen, M. Liu, R. Zhu and J. Sun, Catal. Commun., 2017, 89, 129–132 CrossRef.
- N. Shao, J. Wang, D. Wang and P. Corvini, Appl. Catal., B., 2017, 203, 964–978 CrossRef.
- J. Xian, D. Li, J. Chen, X. Li, M. He, Y. Shao, L. Yu and J. Fang, ACS Appl. Mater. Interfaces, 2014, 6, 13157–13166 CrossRef PubMed.
- S. Soedergren, A. Hagfeldt, J. Olsson and S. E. Lindquist, J. Phys. Chem., 1994, 98, 5552–5556 CrossRef.
- D. Wang, D. Choi, J. Li, Z. Yang, Z. Nie, R. Kou, D. Hu, C. Wang, L. V. Saraf, J. Zhang, I. A. Aksay and J. Liu, ACS Nano, 2009, 3, 907–914 CrossRef PubMed.
- T. Lu, Y. Zhang, H. Li, L. Pan, Y. Li and Z. Sun, Electrochim. Acta, 2010, 55, 4170–4173 CrossRef.
- H. L. Guo, X. F. Wang, Q. Y. Qian, F. B. Wang and X. H. Xia, ACS Nano, 2009, 3, 2653–2659 CrossRef PubMed.
- Y. Zhang, W. Cui, W. An, L. Liu, Y. Liang and Y. Zhu, Appl. Catal., B, 2018, 221, 36–46 CrossRef.
- H. Wang, Y. Liang, L. Liu, J. Hu and W. Cui, J. Hazard. Mater., 2018, 344, 369–380 CrossRef PubMed.
- Y. Liang, S. Lin, L. Liu, J. Hu and W. Cui, Appl. Catal., B, 2015, 164, 192–203 CrossRef.
- Q. Liu, J. Huan, N. Hao, J. Qian, H. Mao and K. Wang, ACS Appl. Mater. Interfaces, 2017, 9, 18369–18376 CrossRef PubMed.
- D. Wang, F. Jia, H. Wang, F. Chen, Y. Fang, W. Dong, G. Zeng, X. Li, Q. Yang and X. Yuan, J. Colloid Interface Sci., 2018, 519, 273–284 CrossRef PubMed.
- Y. Hong, Y. Jiang, C. Li, W. Fan, X. Yan, M. Yan and W. Shi, Appl. Catal., B, 2016, 180, 663–673 CrossRef.
- H. Katsumata, T. Sakai, T. Suzuki and S. Kaneco, Ind. Eng. Chem. Res., 2014, 53, 8018–8025 CrossRef.
- M. Ge, Y. Chen, M. Liu and M. Li, J. Environ. Chem. Eng., 2015, 3, 2809–2815 CrossRef.
|
| This journal is © The Royal Society of Chemistry 2018 |
Click here to see how this site uses Cookies. View our privacy policy here.  Open Access Article
 *a,
Hao Yanga,
Hongwei Zhanga,
Ruini Suob,
Yingshuang Xiec and
Gang Liub
![[thin space (1/6-em)]](https://www.rsc.org/images/entities/char_2009.gif) and ♣ ) could be clearly indexed to the cubic Ag3PO4 phase and cubic NiFe2O4 spinel phase. This result further illustrates that the Ag3PO4/GO/NiFe2O4 composite was successfully synthesized by a simple ion-exchange deposition method.
and ♣ ) could be clearly indexed to the cubic Ag3PO4 phase and cubic NiFe2O4 spinel phase. This result further illustrates that the Ag3PO4/GO/NiFe2O4 composite was successfully synthesized by a simple ion-exchange deposition method.
![[double bond, length as m-dash]](https://www.rsc.org/images/entities/char_e001.gif) C and C–OH bonds, and the peaks at 287.5 and 289.3 eV are usually associated with C–O–C and C
C and C–OH bonds, and the peaks at 287.5 and 289.3 eV are usually associated with C–O–C and C![[double bond, length as m-dash]](https://www.rsc.org/images/entities/char_e001.gif) O bonds, respectively. These results are in good agreement with those previously reported.1,53 The abovementioned XPS results confirmed the coexistence of GO/NiFe2O4 and Ag3PO4 in Ag3PO4/GO/NiFe2O4 composites.
O bonds, respectively. These results are in good agreement with those previously reported.1,53 The abovementioned XPS results confirmed the coexistence of GO/NiFe2O4 and Ag3PO4 in Ag3PO4/GO/NiFe2O4 composites.

![[double bond, length as m-dash]](https://www.rsc.org/images/entities/char_e001.gif) P–O bending vibration and those at 1010 cm−1 were assigned to the asymmetric stretching of PO43− groups.56 The 1650 cm−1 band was ascribed to the H2O bending mode. The absorption band at 3400–3650 cm−1 was related to the stretching vibration of adsorbed water.57,58 As expected for NiFe2O4 structures, there were two broad bands with low transmittances in the range of 400–525 cm−1 and 560–630 cm−1 that were observed in each spectrum.59–61 Accordingly, these two absorption bands were related to tetrahedral and octahedral vibrational trivalent cations of Fe3+. Different vibrational modes in the octahedral and tetrahedral components were attributed to linked distance differences of Fe3+–O2− in the two modes.59 In the spectrum of GO, the absorption bands at 1620 cm−1 and 1400 cm−1 corresponded to the C–O stretching and deformation vibration from carboxyl, and the absorption bands centered at 3390 cm−1 and 1247 cm−1 were attributed to the O–H stretching and CO stretching vibrations of the –COOH group.62
P–O bending vibration and those at 1010 cm−1 were assigned to the asymmetric stretching of PO43− groups.56 The 1650 cm−1 band was ascribed to the H2O bending mode. The absorption band at 3400–3650 cm−1 was related to the stretching vibration of adsorbed water.57,58 As expected for NiFe2O4 structures, there were two broad bands with low transmittances in the range of 400–525 cm−1 and 560–630 cm−1 that were observed in each spectrum.59–61 Accordingly, these two absorption bands were related to tetrahedral and octahedral vibrational trivalent cations of Fe3+. Different vibrational modes in the octahedral and tetrahedral components were attributed to linked distance differences of Fe3+–O2− in the two modes.59 In the spectrum of GO, the absorption bands at 1620 cm−1 and 1400 cm−1 corresponded to the C–O stretching and deformation vibration from carboxyl, and the absorption bands centered at 3390 cm−1 and 1247 cm−1 were attributed to the O–H stretching and CO stretching vibrations of the –COOH group.62


