
 Open Access Article
 This Open Access Article is licensed under a Creative Commons Attribution-Non Commercial 3.0 Unported Licence
A CO2-tunable plasmonic nanosensor based on the interfacial assembly of gold nanoparticles on diblock copolymers grafted from gold surfaces†
Huaxiang Chena,
Yuliang Wang bd,
Xiaolai Lib,
Benliang Lianga,
Shaohua Dong*c,
Tingting Youa and
Penggang Yin*a
bd,
Xiaolai Lib,
Benliang Lianga,
Shaohua Dong*c,
Tingting Youa and
Penggang Yin*a
aKey Laboratory of Bio-inspired Smart Interfacial Science and Technology of Ministry of Education, School of Chemistry, Beihang University, Beijing, 100191, China. E-mail: pgyin@buaa.edu.cn
bSchool of Mechanical Engineering and Automation, Beihang University, Beijing, 100191, China
cPipeline Technology Research Center, China University of Petroleum-Beijing, Beijing, 102249, China. E-mail: shdong@cup.edu.cn
dBeijing Advanced Innovation Center for Biomedical Engineering, Beihang University, Beijing, 100083, China
First published on 18th June 2018
Abstract
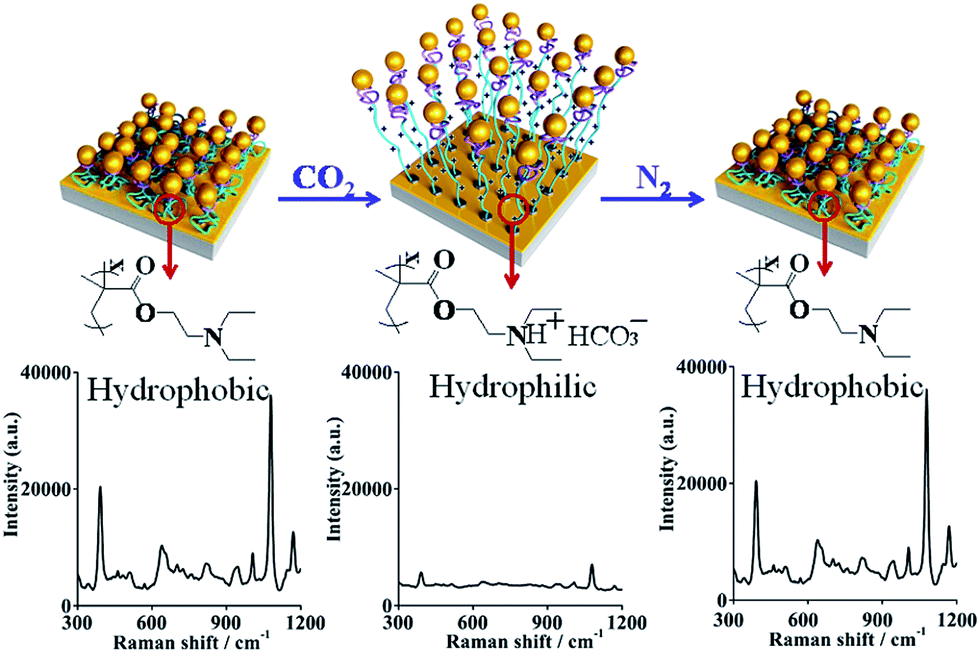
A general stepwise strategy for the fabrication of CO2-tunable plasmonic nanosensors was described for the first time, based on gold surface functionalization by CO2-responsive poly(N,N-diethylaminoethyl methacrylate) (PDEAEMA) brushes via a surface-initiated atom transfer radical polymerization (SI-ATRP) method, then the extremity of PDEAEMA was functionalized by linking the polyacrylamide (PAAm) brushes via ATRP, where they were assembled with gold nanoparticles (AuNPs) efficiently by altering the deposition time. The swelling–shrinking states of the PDEAEMA brushes can be tuned just by passing CO2 and N2 through a solution alternately. The unique plasmonic surface-enhanced Raman scattering (SERS) sensing properties of these stimulable substrates were investigated using 4-mercaptophenol (4MPh) as a molecular probe. When alternating CO2 and N2 bubbling in the water solution, the reversible switching of the SERS signals was complete. By in situ contact-mode atomic force microscopy, the thickness of the polymer layer was observed to be 26 nm in CO2 saturated water, and after N2 bubbling to remove CO2 it decreased to 15 nm, causing the AuNPs to move near to the gold surface. Meanwhile, the distance between the nearby AuNPs becomes smaller, and the surface coverage (φ) of the AuNPs increased from 27% to 35%. The reported CO2-responsive plasmonic nanosensor provided a dynamic SERS platform, with reversible regulation for electromagnetic coupling between the AuNPs and the gold surface, and between nearby AuNPs.
1. Introduction
Since being discovered by Fleischmann et al. in 1974,1 surface-enhanced Raman scattering (SERS) has garnered vital interest and has become one of the most powerful and sensitive tools for the chemical and biochemical analysis of molecules adsorbed on metallic substrates.2–7 This technology, with its “fingerprinting” properties and limited influence from water, has a large potential for plasmonic nanosensor applications for characterization and chemical detection.8 In SERS, high SERS activity is predominantly based on two factors: (i) electromagnetic enhancement, a strong local field enhancement caused by the excitation of a localized surface plasmon (LSP); (ii) chemical enhancement, observed when a resonant charge transfer occurs between adsorbed molecules and nanoparticles.9–11Currently, one of the key research goals is to fabricate dynamic SERS-active substrates in response to environmental stimuli due to their plasmonic properties and biomedical applications.12–15 Electric field enhancements, caused by vast “hot spots” within the gap both between two NPs and between NPs and a gold film, can be reversibly altered by changing the environmental conditions, such as temperature and pH. Temperature-responsive gold/PNIPAM/NPs hybrid plasmonic devices were described as a dynamic SERS platform, with thermally switchable electromagnetic coupling between AuNPs and the gold surface, as recently reported by H. Gehan et al.10 However, to the best of our knowledge, gas-responsive dynamic SERS substrates have never been reported so far.
As an important environmental stimulus, carbon dioxide (CO2) regulates many organism behaviors, such as finding mates and seeking food.16,17 In the present study, after the ultrapure water used was saturated with CO2, the pH of the solution decreased from 7 to 4.9; while after N2 bubbling, the initial pH value of 7 was recovered.18 Brushes of poly(N,N-diethylaminoethyl methacrylate) (PDEAEMA) can be switched between swelling and shrinking states just by passing CO2 and N2 through the water solution.19
In this work, CO2-responsive Au film–PDEAEMA–PAAm–AuNPs hybrid plasmonic nanostructures were fabricated successfully and applied as SERS-active nanosensors. Firstly, PDEAEMA brushes grafted onto a gold surface were obtained via ATRP methods. Secondly, the extremity of PDEAEMA was functionalized by linking PAAm brushes via ATRP. Lastly, AuNPs were assembled on PAAm layers with different deposition times. On the surface of the samples, AuNPs were fixed efficiently by altering the immersion times. In a CO2 saturated water solution, the thickness of the polymer layer was as high as 26 nm. After N2 bubbling, which removes CO2, the thickness deceased to 15 nm. Meanwhile, electromagnetic coupling between the AuNPs and the gold surface, or between nearby AuNPs, can be altered reversibly, leading to a reversible change in SERS intensity.
2. Materials and methods
2.1 Reagents and instruments
Gold coated silicon wafers (〈111〉 oriented, 1000 Å coating, titanium adhesion layer, 0.4 in. × 500 μm) were purchased from Aldrich. 2-(Diethylamino)ethyl methacrylate (DEAEMA, 99% Aldrich) was passed through an activated basic alumina column to remove the inhibitory substances before use. CuIBr (98%), 1,1,4,7,7-pentamethyldi ethylenetriamine (PMDETA, 99%), acrylamide (AAm, 99.9%) and the initiator bis[2-(2-bromoisobutyryloxy)undecyl]disulphide (DTBU) were purchased from Sigma-Aldrich and used as received. 4-Mercaptophenol (4MPh, 99%), methanol (99.8%), ethanol (99.5%) and tetrahydrofuran (99.9%) were purchased from J&K Scientific. All of the deionized water was obtained using a Millipore Direct-Q system.2.2 Preparation of the initiator-modified gold surfaces
Initiator-modified gold surfaces were prepared (Scheme 1, step 1). After being rinsed by tetrahydrofuran, ethanol, water and ethanol, Au-coated silicon wafers were soaked in 1 mM ethanol solution of initiator DTBU, kept immersed for 12 h at 20 °C, then the substrates were washed sequentially with THF and ethanol, and then dried in a stream of nitrogen before use. The initiator-modified gold surfaces (Au film–Br) were immediately used for polymerization. 1H-NMR spectra and the chemical structure of DTBU can be seen in Fig. S1.†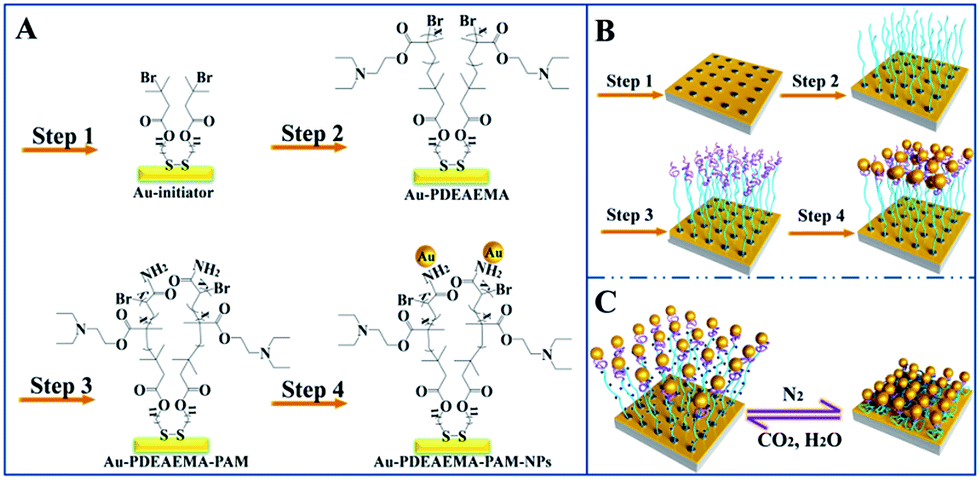 | ||
| Scheme 1 (A) Stepwise synthetic route of the Au film–PDEAEMA–PAAm–AuNPs substrates. (B) Schematics of the functionalization steps for the prepared Au film–PDEAEMA–PAAm–AuNPs substrates. (C) Schematic of the CO2-tunable reversible swelling–shrinking transition. | ||
2.3 ATRP of DEAEMA and AAm on Au film–Br surfaces
Diblock copolymers PDMAEMA-b-PAAm grafted from Au film–Br surfaces were synthesized by the ATRP technique.Firstly, the Br-terminated PDMAEMA brushes on gold films (Au film–PDEAEMA–Br) were prepared (Scheme 1, step 2) according to ref. 19. CuIBr (0.062 g) complexed with PMDETA (0.435 g) as a catalyst, DEAEMA (2.8 g) and MeOH (5 ml) were added in a flask under vigorous stirring, and degassed by three freeze/vacuum/nitrogen cycles. The Au–Br substrates were transferred into the flask and the reaction was continued at 80 °C for 5 h. After polymerization, the Au film–PDEAEMA–Br samples were removed, washed with water and methanol, and then immediately used for the polymerization of PAAm.
Secondly, PAAm brushes were linked at the end of the PDEAEMA brushes via the ATRP method (Scheme 1, step 3). Au film–PDEAEMA–Br samples were transferred to a reaction mixture of PMDETA (0.25 g), Milli-Q water (3 ml), methanol (7 ml), AAm (2.00 g) and CuIBr (0.064 g), and degassed by three freeze/vacuum/nitrogen cycles. The reaction was continued at 25 °C for 10 min, then the Au film–PDEAEMA–PAAm samples were washed sequentially with water and ethanol, and dried in a stream of nitrogen before use.
2.4 Au film–PDEAEMA–PAAm assembled with gold nanoparticles
Gold nanoparticles were assembled with amide bonds attached to the PAAm brushes (Scheme 1, part B, step 4). AuNPs with a diameter of 41 nm were synthesized successfully (see Fig. S2†) according to ref. 20. Au film–PDEAEMA–PAAm samples were separately immersed in the AuNP colloidal solution (10 ml) for different periods of time. The prepared Au film–PDEAEMA–PAAm-AuNPs samples were taken out and rinsed with water, then dried with a nitrogen gas stream.2.5 SERS properties of Au film–PDEAEMA–PAAm–AuNPs substrates
The SERS activities of the prepared nanocomposite substrates were tested using 10−5 M 4MPh as a reporter analyte. Samples were prepared by immersing Au–PDEAEMA–PAAm–AuNPs substrates into 4MPh (10−5 M, 10 ml) for two hours, then rinsing with ethanol several times to remove the free molecules. The Raman spectra were collected from the SERS samples after exposure to CO2 or upon N2 bubbling that removes CO2 in the water solution. The surface-enhanced Raman spectra were measured on an in Via-Reflex micro-Raman system (Renishaw, UK) equipped with a multi-channel charge-coupled device (CCD) detector and a confocal microscope (DM2500 M, Leica) using excitation by a 785 nm laser line.2.6 Characterization
Scanning electron microscopy (SEM) images were recorded by a JEOL JSM7500FA field emission microscope with an accelerating voltage of 5 kV. A JEOL JEM-2100F microscope with an accelerating voltage of 200 kV was selected to produce the transmission electron microscopy (TEM) images. Ultraviolet-visible absorption spectra (UV-vis) were measured on a Shimadzu UV-3150 spectrometer. Fourier transform infrared (FTIR) spectra were collected on a Nicolet iN10 infrared spectrophotometer. An optical contact angle meter (HARKE-CALS) was used to measure the water contact angles with 2 μl water droplets under ambient conditions. AFM studies were performed with a Nanoscope III digital instrument microscope (Bruker resolve) in tapping mode to map the film morphology in the water environment.3. Results and discussion
3.1 Characterization of the Au film–PDEAEMA–PAAm–AuNPs nanocomposites
The synthesis route of the Au film–PDEAEMA–PAAm–AuNPs nanocomposites is shown in Scheme 1. The successive synthesis of Au film–PDEAEMA and Au film–PDEAEMA–PAAm was confirmed by FTIR spectra. In the FTIR spectrum of the Au film–PDEAEMA surface (Fig. S3A†), characteristic peaks of PDEAEMA were observed at 2900–3000 cm−1 (C–H aliphatic peaks), 1733 cm−1 (C![[double bond, length as m-dash]](https://www.rsc.org/images/entities/char_e001.gif) O stretching vibration band), 1155–1181 cm−1 (C–N stretching) and 1067 cm−1 (N–CH2 peaks).21 Moreover, in the FTIR spectrum of the Au film–PDEAEMA–PAAm sample (Fig. S3B†), new peaks of 1650 cm−1 (CO stretching vibration band of amide group), 3345 cm−1 (N–H asymmetric stretching) and 3198 cm−1 (N–H symmetric stretching)22 confirmed that PAAm brushes were linked at the end of PDEAEMA successfully. The thickness of the PAAm brushes was lower than 5 nm, as reported.23 After each step in Scheme 1, the change in the contact angle of the prepared material surface also proved the successful preparation of the composite (see Fig. S4†).
O stretching vibration band), 1155–1181 cm−1 (C–N stretching) and 1067 cm−1 (N–CH2 peaks).21 Moreover, in the FTIR spectrum of the Au film–PDEAEMA–PAAm sample (Fig. S3B†), new peaks of 1650 cm−1 (CO stretching vibration band of amide group), 3345 cm−1 (N–H asymmetric stretching) and 3198 cm−1 (N–H symmetric stretching)22 confirmed that PAAm brushes were linked at the end of PDEAEMA successfully. The thickness of the PAAm brushes was lower than 5 nm, as reported.23 After each step in Scheme 1, the change in the contact angle of the prepared material surface also proved the successful preparation of the composite (see Fig. S4†).
Next, we discuss the results on the immobilization of AuNPs onto the Au film–PDEAEMA–PAAm surface. In order to confirm that the PAAm layers containing amine functionality can efficiently assemble with AuNPs, we compared the AFM images of Au film–PDEAEMA and Au film–PDEAEMA–PAAm after AuNP deposition for 10 h, as can be seen in Fig. 1. Comparing the two images of (B) and (C), it is evident that the AuNPs were immobilized onto the Au film–PDEAEMA–PAAm surface efficiently.
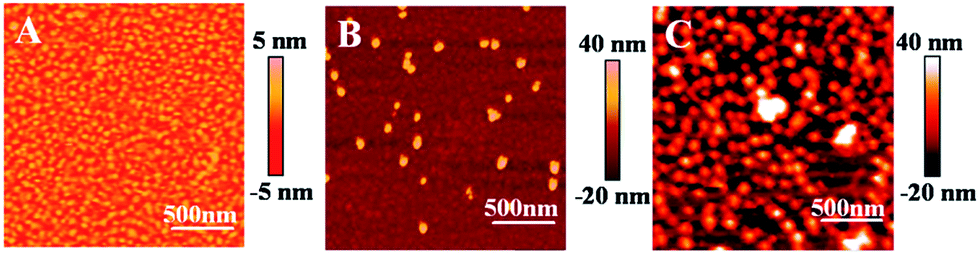 | ||
| Fig. 1 Tapping mode AFM scans (2 × 2 μm, phase) of the bare Au film (A), Au film–PDMAEMA (B) and Au film–PDEAEMA–PAAm (C) after AuNP deposition for 10 h. Detection in a N2 saturated water solution. | ||
The loading of AuNPs on the Au film–PDEAEMA–PAAm surface can be controlled by varying the deposition time. It is clearly observed from Fig. 2 that the amount of AuNPs loaded on the surface of the prepared samples increased obviously with an increase in deposition time, and the AuNPs are randomly dispersed on the surface of the samples at deposition times lower than 10 h. However, AuNPs were agglomerated together at a deposition time of 20 h.
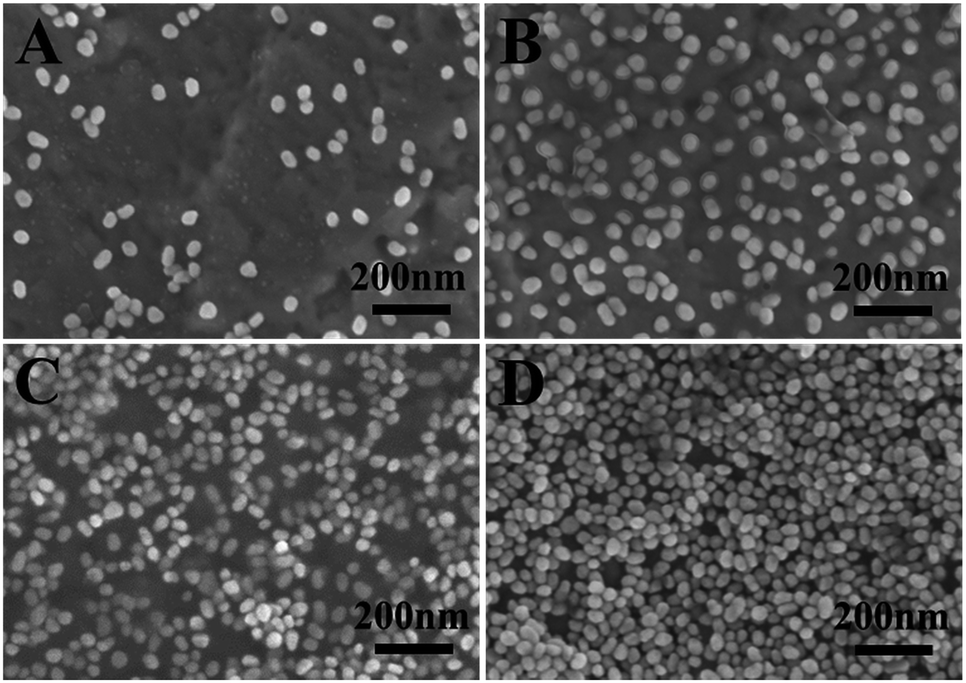 | ||
| Fig. 2 The SEM images of Au film–PDEAEMA–PAAm–AuNPs at different immersion times of 30 min (A), 5 h (B), 10 h (C) and 20 h (D). | ||
3.2 CO2-tunable SERS efficiency of the prepared samples
To demonstrate the potential CO2-response behaviors, samples made of Au-coated Au film–PDEAEMA–PAAm at deposition times of 10 h were evaluated as the optimal SERS active substrates, considering the maximum changes of SERS signal intensity as shown in Fig. 3. SERS signals were collected from the different Au-loading samples in a liquid environment, using 10−5 M 4MPh as a reporter analyte. A peak at 1080 cm−1 is assigned to its aromatic ring breathing vibration ν1, and the other peaks at 392, 638, 825, 1009, and 1173 correspond to the ring vibration (see Table S1†).24 In the N2 saturated water solution, for all samples, strong SERS signals can be collected, and the strongest SERS signal can be observed at a deposition time of 10 h, as the uniform dispersion of AuNPs provided plenty of plasmonic hotspots. At an immobilization time of 20 h, agglomeration of AuNPs caused the AuNPs to link together, and the quantum tunneling effect greatly reduced the electromagnetic enhancement capability and, as a result, the SERS signal decreased. After CO2 bubbling for 30 min, the SERS signal decreased obviously, indicating that the number of plasmonic hotspots reduced sharply in this process.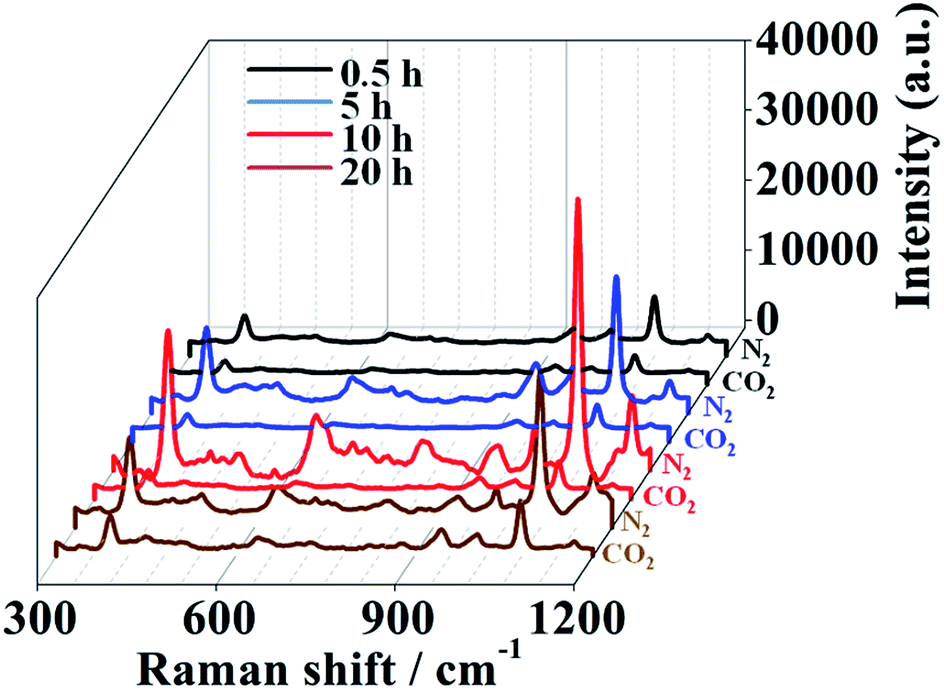 | ||
| Fig. 3 SERS spectrum of 10−5 M 4MPh adsorbed on different Au-loading samples, samples in the N2 saturated water solution for the first detection, then CO2 bubbling for 30 min for the second detection. The acquisition time was 2 s. | ||
As seen in Fig. 4, upon exposure to the CO2-purged aqueous solution for 30 min, the SERS signal showed a drastic decrease as, for the PDEAEMA polymer brushes combined with hydrogen ions, hydrophilic swelling of the PDEAEMA polymer brushes caused the AuNPs to move away from the gold surface, and the distance between the nearby AuNPs increased. After passing N2 gas for 20 min, the initial SERS signal with strength intensity was recovered as, for the PDEAEMA polymer brushes dissociated from hydrogen ions, the collapse of the deprotonated PDEAEMA brushes led to the distance between the AuNPs and the gold surface becoming smaller, inducing a huge electric field that became stronger. By regulating the pH from 4 to 7, the SERS signal intensity was significantly enhanced (see Fig. S5†), which confirmed the principle of the response process. The experiments were repeated several times, and the reversible switching of the SERS signal by alternating CO2 and N2 bubbling was complete (see Fig. S6†).
 | ||
| Fig. 4 SERS spectrum of 10−5 M 4MPh adsorbed on the optimal sample, samples in the N2 saturated water solution for the first detection, then CO2 bubbling for 30 min for the second detection, and N2 bubbling for 20 min for the third detection. The acquisition time was 2 s. | ||
AFM measurements were performed to determine the thickness of the copolymer layer under two different conditions in water and the results are summarized in Fig. 5. It was observed that the conformation of the copolymer layer was reversibly changed depending on the bubbling of CO2 and N2. It was revealed that the thickness of the copolymer layer was decreased from 26 to 15 nm after N2 bubbling, which removes CO2. The number of nanoparticles (N) per area (A) was counted by zooming in on a part of the AFM image, and the surface coverage (φ) was calculated from the following equation:
| φ = Nπd2/(4A) |
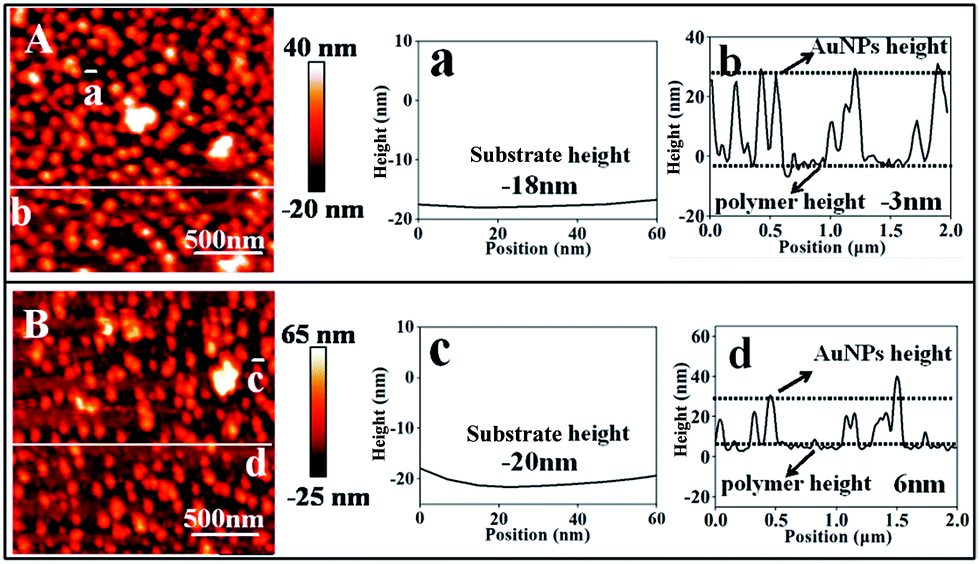 | ||
| Fig. 5 AFM images of the optimal sample surfaces: (A) in N2 saturated water; (B) in CO2 saturated water. Relative heights of the gold surface (a and c) and the polymer film (b and d). The actual height of the polymer film in (A) is calculated as 15 nm (−3 nm minus −18 nm), and in (B) it is calculated as 26 nm (6 nm minus −20 nm). | ||
The surface coverage (φ) was increased from 27% to 35% after N2 bubbling to remove CO2, and a red shift can be observed in the UV-vis spectra (as shown in Fig. S7†), indicating that the average distance among the nearby AuNPs decreased obviously. AuNPs moved near to the gold surface and the AuNPs became closer, and these two processes can create vast SERS hotspots for electromagnetic enhancement. The enhancement factor (EF) at 1080 cm−1 of 4MPh adsorbed on the optimal SERS substrates was estimated to be about 4 × 10⁷ (in N2 saturated water) and 6 × 10⁶ (in CO2 saturated water) (detailed calculation process is in ESI†).
3.3 Homogeneity of the optimal SERS substrates
The homogeneity of a spectral signal through an area is of great importance when considering the practical applications of SERS substrates.25,26 As shown in Fig. 6, we performed a mapping measurement via spot to spot Raman spectroscopy on a 20 μm × 20 μm area of the optimal samples with a step size of 1 μm to evaluate the homogeneity of the SERS signals, detected after exposure to CO2 or upon N2 bubbling that removes CO2 in the water solution. The relative standard deviation (RSD) of a Raman intensity of 1080 cm−1 was calculated to be 8.4% in the state of collapse (Fig. 6A). After exposure to CO2, the PDEAEMA brushes swell, causing the SERS intensity to decreased sharply with an RSD of 10.2% (Fig. 6B), indicating the stability and uniformity of SERS substrates in large areas under the CO2/N2 response process.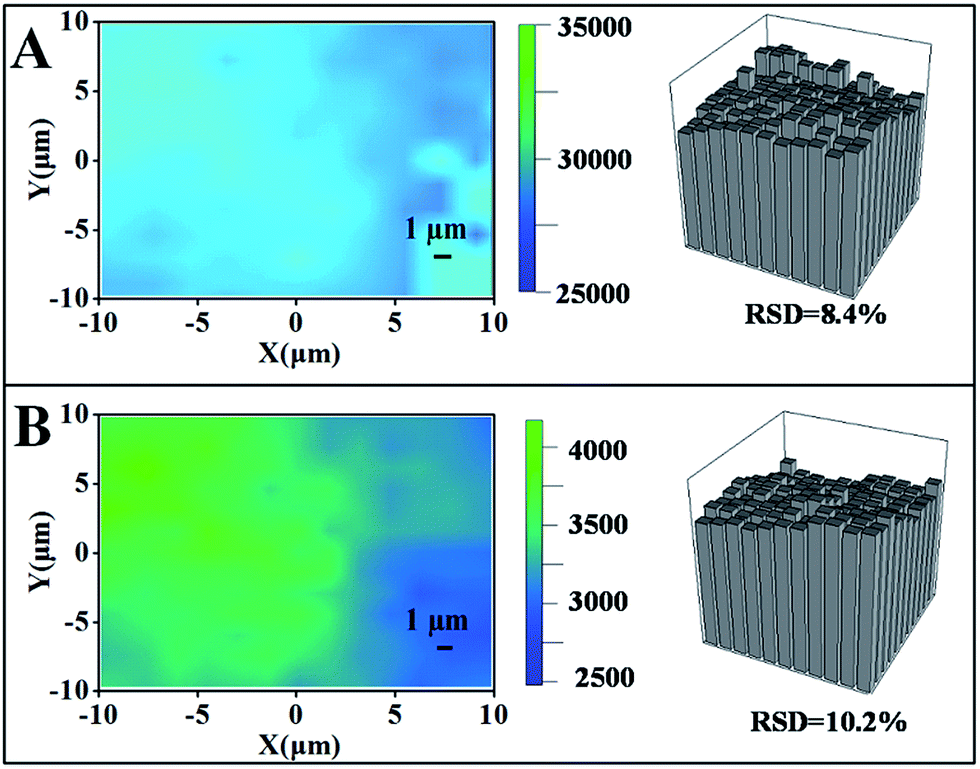 | ||
| Fig. 6 Raman intensity mapping spectra at 1080 cm−1 of 10−5 M 4MPh molecules on a 20 × 20 μm surface area of the optimal SERS substrate, detected in N2 saturated water (A) or in CO2 saturated water (B). The acquisition time was 2 s. | ||
4. Conclusions
In summary, a novel CO2-responsive plasmonic nanosensor was successfully fabricated by a general stepwise strategy: PDEAEMA brushes with CO2-response properties were synthesized via ATRP grafted from gold surfaces, after which PAAm brushes were linked at the end of the PDEAEMA brushes, and AuNPs were fixed to the PAAm brushes with high final efficiency. The prepared samples at deposition times of 10 h were selected as the optimal SERS substrates.After alternating CO2 and N2 bubbling in the water solution, the reversible switching of the SERS signals was complete, using 4MPh (10−5M) as the target. Changes in polymer layer thickness were observed by AFM: the thickness was 26 nm in CO2 saturated water, and decreased to 15 nm after N2 bubbling to remove CO2. Meanwhile, AuNPs were near to the gold surface, and the distance between the nearby AuNPs became closer, leading to vast hotspots which can give rise to electromagnetic enhancement obviously. The RSD of the optimal SERS substrates was calculated to be 10.2% in CO2 saturated water and 8.4% in N2 saturated water, indicating that the optimal SERS nanosensor was stable in a large area under the CO2/N2 response process.
Conflicts of interest
There are no conflicts of interest to declare.Acknowledgements
This work was supported by the National Natural Science Foundation of China (51572009) and the National Key R&D Program of China (2017YFC0805800).References
- M. Fleischmann, P. J. Hendra and A. J. Mcquillan, Chem. Phys. Lett., 1974, 26(2), 163–166 CrossRef.
- K. G. Li, Y. Wang, K. Jiang, Y. Ren, Y. Q. Dai, Y. H. Lu and P. Wang, Nanotechnology, 2016, 27(49), 495402 CrossRef PubMed.
- Y. W. Wang, B. Yan and L. X. Chen, Chem. Rev., 2013, 113(3), 1391–1428 CrossRef PubMed.
- A. Campion, J. E. I. Iii, C. M. Child and M. Foster, J. Am. Chem. Soc., 1995, 117(47), 11807–11808 CrossRef.
- J. Xie, Q. Zhang, J. Y. Lee and D. I. C. Wang, ACS Nano, 2008, 2(12), 2473–2480 CrossRef PubMed.
- X. Li, G. Chen, L. Yang, Z. Jin and J. Liu, Adv. Funct. Mater., 2010, 20(17), 2815–2824 CrossRef.
- S. E. Deprimo, J. Cao, M. N. Hersh and J. R. Stringer, J. Phys. Chem. C, 2011, 115(36), 17829–17835 CrossRef.
- S. Gupta, M. Agrawal, M. Conrad, N. A. Hutter, P. Olk, F. Simon, L. M. Eng, M. Stamm and R. Jordan, Adv. Funct. Mater., 2010, 20(11), 1756–1761 CrossRef.
- P. G. Yin, Y. Chen, L. Jiang, T. T. You, X. Y. Lu, L. Guo and S. H. Yang, Macromol. Rapid Commun., 2011, 32(13), 1000–1006 CrossRef PubMed.
- H. Gehan, L. Fillaud, M. M. Chehimi, J. Aubard, A. Hohenau, N. Felidj and C. Mangeney, ACS Nano, 2010, 4(11), 6491–6500 CrossRef PubMed.
- L. Jensen, C. M. Aikens and G. C. Schatz, Chem. Soc. Rev., 2008, 37(5), 1061–1073 RSC.
- K. Qian, L. Yang, Z. Li and J. Liu, J. Raman Spectrosc., 2013, 44(1), 21–28 CrossRef.
- M. Lin, Y. Wang, X. Sun, W. Wang and L. Chen, ACS Appl. Mater. Interfaces, 2015, 7(14), 7516–7525 CrossRef PubMed.
- Y. Zhang, H. Hong, D. V. Myklejord and W. Cai, Small, 2011, 7(23), 3261–3269 CrossRef PubMed.
- X. Y. Liu, X. Q. Wang, L. S. Zha, D. L. Lin, J. M. Yang, J. F. Zhou and L. Zhang, J. Mater. Chem. C, 2014, 2(35), 7326–7335 RSC.
- Y. L. Xu, X. Sui, S. Guan, J. Zhai and L. Gao, Adv. Mater., 2015, 27(11), 1851–1855 CrossRef PubMed.
- G. S. B. Suh, A. M. Wong, A. C. Hergarden, J. W. Wang, A. F. Simon, S. Benzer, R. Axel and D. J. Anderson, Nature, 2004, 431(7010), 854–859 CrossRef PubMed.
- J. T. Sun, C. Y. Hong and C. Y. Pan, J. Phys. Chem. C, 2010, 114(29), 12481–12486 CrossRef.
- S. Kumar, X. Tong, Y. L. Dory, M. Lepage and Y. Zhao, Chem. Commun., 2013, 49(1), 90–92 RSC.
- G. Frens, Nat. Phys. Sci., 1973, 241(105), 20–22 CrossRef.
- D. Q. Wang, J. J. Tan, H. L. Kang, L. Ma, X. Jin, R. G. Liu and Y. Huang, Carbohydr. Polym., 2011, 84(1), 195–202 CrossRef.
- X. X. Kong, T. Kawai, J. Abe and T. Iyoda, Macromolecules, 2001, 34(6), 1837–1844 CrossRef.
- Q. Liu, A. Singh, R. Lalani and L. Liu, Biomacromolecules, 2012, 13(4), 1086–1092 CrossRef PubMed.
- C. Y. Song, J. L. Abell, Y. P. He, S. H. Murph, Y. P. Cui and Y. P. Zhao, J. Mater. Chem. C, 2011, 22(3), 1150–1159 RSC.
- B. B. Ma, P. Li, L. B. Yang and J. H. Liu, Talanta, 2015, 141, 1–7 CrossRef PubMed.
- C. Farcau and S. Astilean, J. Phys. Chem. C, 2010, 114(27), 11717–11722 CrossRef.
Footnote |
| † Electronic supplementary information (ESI) available. See DOI: 10.1039/c8ra02934b |
| This journal is © The Royal Society of Chemistry 2018 |