 Open Access Article
Creative Commons Attribution 3.0 Unported Licence
Convenient chirality transfer from organics to titania: construction and optical properties†‡
Xin-Ling Liu,
Ken Murakami ,
Hiroyuki Matsukizono,
Seiji Tsunega and
Ren-Hua Jin
 *
*
Department of Material and Life Chemistry, Kanagawa University, 3-2-7 Rokkakubashi, Yokohama 221-8686, Japan. E-mail: rhjin@kanagwa-u.ac.jp
First published on 30th April 2018
Abstract
Polyethyleneimine (PEI) complexed with chiral D- (or L-) tartaric acid (tart) in water can self-organize into chiral and crystalline PEI/tart assemblies. It has been previously confirmed that the complexes of PEI/tart could work as catalytic/chiral templates to induce the deposition of SiO2 nanofibres with optical activity but without outwards shape chirality such as helices. In this work, we found that the templating functions of PEI/tart were still effective to prompt the deposition of TiO2 to form chiral PEI/tart@TiO2 hybrid nanofibres under aqueous and room temperature conditions within two hours. Furthermore, the co-deposition of TiO2 and SiO2 was also fulfilled to yield chiral PEI/tart@TiO2/SiO2 nanofibres. These TiO2-containing hybrid nanofibres showed non-helical shapes on the length scale; however, chiroptical signals with mirror relation around the UV-Vis absorption band of TiO2 remarkably appeared on their circular dichroism (CD) spectra. By means of the protocols of XRD, TEM, SEM, UV-Vis, CD and XPS, structural features and thermoproperties of the chiral TiO2 and SiO2/TiO2 were investigated.
Introduction
Recently, the synthesis of chiral inorganic nanomaterials has been a burgeoning topic in the research area of chirality.1–3 Chiral objects are non-superimposable with their mirror image, which can be caused by the asymmetric arrangement of their constituent units (atoms, molecules, nanoparticles, etc.) on different length scales. The combination between the chiral/asymmetric features and the diversely intrinsic properties of inorganics can result in novel catalytic, optical, electronic, and magnetic properties and applications such as in asymmetric catalysis, enantioselective separation, sensors, optical filters, enhanced surface-enhanced Raman scattering, and long-wavelength chiroptical activity.4–12 Therefore, it is interesting and challenging to synthesize chiral inorganic nanomaterials especially those crystalline materials with asymmetric space groups. To date, the synthesis and properties of chiral plasmonic metals (e.g., Au, Ag), semiconducting quantum dots (e.g., CdSe, ZnS) and metal oxides (e.g., SiO2) have been widely researched. The interest has been continuously extended to other inorganic nanomaterials such as Si, ZrO2, ZnO, CuO, Y2O3, Ta2O5, Ln(OH)CO3 and Lu2Si2O7.13–20 Undoubtedly, these research studies will contribute to the development of the scope of chirality beyond the traditional organic chemistry.Herein, we are especially interested in chiral titanium dioxide (TiO2). TiO2 is a kind of important semiconductor with a wide range of applications such as photocatalysts, pigments, cosmetics, solar cells and lithium ion batteries.21–23 Compared to chiral silica, there is not extensive attention for chiral properties of TiO2, only a few reports involved their preparation and potential applications. Generally, the synthetic chiral TiO2 could be divided into two types according to their synthesis procedures: the first one is the helix-shaped TiO2 with various helix pitches from tens nm to several μm; the other is the TiO2 with chiral cavities on the molecular scale prepared via molecular imprinting. For the helical TiO2, they are usually synthesized by the sol–gel process in the presence of helix-shaped templates, which included soft templates (e.g., cholesterol gelator, lipid amphiphilic N-acylamino acids, trans-(1R,2R)- and trans-(1S,2S)-1,2-diaminocyclohexane derivatives, valine-derived chiral cationic gelators)24–28 and hard templates (e.g., helical carbon nanotubes, SiO2 films with a long-range chiral nematic structures).29,30 Moreover, the glancing angle deposition (GLAD) (a kind of physical vapor deposition) has been also employed for the preparation of helical TiO2 films.31,32 For the molecularly imprinted TiO2, small chiral organic molecules (e.g., L-phenylalanine, R-2-(4-isobutylphenyl)-propionic acid, (S) or (R)-2-phenylbutanoic acid) were mixed with the TiO2 sources during the formation of TiO2 and finally removed to produce chiral cavities by memorizing the configurations of chiral molecules.33,34 In addition, some potential applications of these chiral TiO2 have been demonstrated. For example, the surface plasmon resonance (SPR) of plasmatic Ag and Ag/AgCl would be enhanced when deposited on helical TiO2 and thus improved the visible-light photocatalytic performance of plasmatic-metal/TiO2 composites.10 Some chiral TiO2 films were able to detect circularly polarized light or enantioselectively recognize specific chiral small organic molecules.32,33
TiO2 possesses amorphous and crystalline (anatase and rutile) phases, of which amorphous TiO2 is generally formed at a low temperature and then transformed into crystalline anatase TiO2 by heating (usually < 600 °C) and further into rutile TiO2 with increasing the temperature (≥600 °C). Most previously reported chiral TiO2 were amorphous or anatase TiO2 obtained at the temperature less than 600 °C. However, the formation of chiral rutile or anatase TiO2 at a high temperature over 700 °C is still a challenge, which may be due to the following two reasons: (1) the phase-transformation temperature for the appearance of rutile TiO2 is high, at which the helical shapes or chiral cavities found on many chiral TiO2 may be destructed and thus the chirality could not be maintained; (2) anatase TiO2 is metastable under lower temperature but transformed into rutile TiO2 at a higher temperature. To overcome the first issue, it is expected to develop novel chiral TiO2 which possesses chirality not depending on the helical outward or metastable chiral cavities. For the second issue, anatase TiO2 can be stabilized by some special strategies such as decreasing the sizes, as the nano-sized anatase TiO2 may show improved thermal stability than that of the larger-sized one.35–37
Although the definition of chirality is quite simple, the expression of chirality varies with sizes, phases and shapes. This offers various possibilities to develop new inorganics with different chiral features to satisfy different demands.15,38 Herein, to address the issues on chiral TiO2 mentioned above, we developed a new way to prepare chiral TiO2 and TiO2/SiO2 composite nanofibres without helical shapes by using chiral templates self-assembled from polyamine and chiral tartaric acid. In our earlier work, it was confirmed that polyethylenimine (PEI) could complex with chiral D- (or L-) tartaric acid (tart) to form crystalline PEI/tart complexes with optical activity, and could be used as catalytic chiral templates to prepare non-helical SiO2 nanofibres with high-temperature-resistant (up to 900 °C) chirality.39 In the present work, we found that mixing PEI/tart complexes with TiO2 sources (titanium bislactates) at room temperature for 2 hours could easily result in deposition of TiO2 on the PEI/tart to form hybrids PEI/tart@TiO2. Also, when TiO2 and SiO2 sources were simultaneously used, co-deposition of TiO2/SiO2 occurred on PEI/tart to form hybrids of PEI/Tart@TiO2/SiO2. Both the hybridized nanofibres showed non-helical shapes but exhibited chiroptical signals on their circular dichroism (CD) spectra corresponding to the absorption bands of TiO2. After calcinations of PEI/tart@TiO2 at 500–800 °C, the phase of TiO2 was transformed into anatase TiO2 (500 °C) and finally into rutile TiO2 (800 °C), accompanied with the morphological change from nanofibres to nanoparticles (NPs). However, CD optical activity was still found on these calcined samples including the rutile TiO2 NPs. In contrast, in the case of PEI/tart@TiO2/SiO2, the nanofibrous morphologies were much less influenced by the calcination temperature, and sub-10 nm anatase TiO2 NPs were homogeneously distributed on the nanofibres even calcined at 800 °C. To the best of our knowledge, it is first example that chiral TiO2/SiO2 composites were successfully prepared by a one-step way and chiral anatase TiO2 were well maintained at such a high temperature of 800 °C.
Results
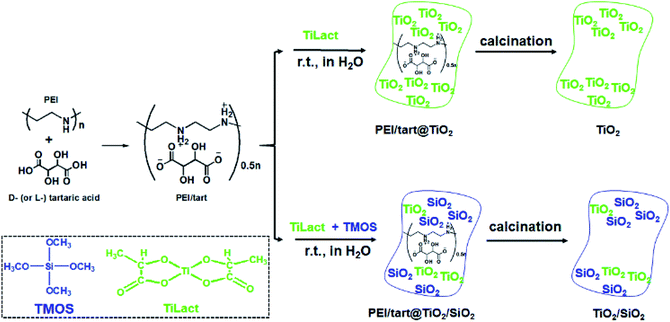
It has been found that linear polyethyleneimine (PEI, (–NHCH2CH2–)n) can crystallize in water and thus form a series of assemblies with controllable nano/micro-morphologies2,39 and the amine groups on PEI can effectively catalyse the hydrolysis and condensation of alkoxy silane to induce the site-selective deposition of SiO2 around the surface of the PEI assemblies. Furthermore, PEI could complex with chiral tartaric acid (tart) to form crystalline polymeric complexes of PEI/tart with chiroptical activity, which still functioned as catalytic template for SiO2 deposition to generate chirality in the resulting silica frame.40 Besides SiO2, one-dimensionally (1-D) nanostructured PEI@TiO2 powders and films could be prepared by the accelerated hydrolysis–condensation of titanium bislactates (TiLact) in the presence of crystalline PEI assemblies.41,42 Herein, we are interested to probe whether PEI/tart could be also applicable as chiral template in preparation of chiral TiO2 and TiO2/SiO2 nanomaterials. For this purpose, two synthetic procedures were designed and shown in Scheme 1. In the first one, only the TiO2 source of titanium bislactate (TiLact) was mixed with PEI/tart to produce PEI/tart@TiO2 hybrids; in the second one, both TiO2 source (TiLact) and SiO2 source (tetramethoxy silane, TMOS) were simultaneously used to co-deposit TiO2/SiO2 on the templates of PEI/tart. Finally, these hybrids were treated by calcination at different temperatures (500–800 °C) to produce TiO2 and TiO2/SiO2, respectively.Characterizations of PEI/tart@TiO2 and TiO2
As typical examples, the XRD patterns of D-form samples including template, as-prepared hybrid and calcined forms were shown in Fig. 1a. The complexes of D-PEI/tart exhibited several diffraction peaks in the 2θ range of 10–40 degree demonstrating the crystalline feature of PEI/tart complexes.40 Whereas, only a broad halo peak between 20–30 degree was found on D-PEI/tart@TiO2. After calcination at a high temperature, these hybrids turned into crystalline TiO2 products. Two kinds of phases for TiO2 were detected, including the anatase TiO2 (JCPDS card no. 21-1272) with the characteristic peak (marked with A) around 25.3 degree and the rutile TiO2 (JCPDS card no. 21-1276) with the peak (marked with R) around 27.5 degree. The phases changed with the temperature: only anatase TiO2 appearing at 500 °C, both anatase and rutile TiO2 at 600 and 700 °C, and only rutile TiO2 at 800 °C. Meanwhile, the peak A for anatase TiO2 decreased from 500 to 700 °C and finally disappeared at 800 °C while the peak R for rutile TiO2 appeared at 600 °C and further increased with temperature. These changes of peak A and R showed the phase transformation from anatase to rutile, which is a common phenomenon found on many crystalline TiO2 products during heating. That is the rutile is the thermodynamically stable phase while the anatase is a metastable one. According to the TG curves (Fig. 1b), the mass ratio of organic components in D-PEI/tart@TiO2 was about 41% based on the mass loss between 150 and 800 °C. The XRD patterns and TG curves for the L form products are close to those of the corresponding D-form products and thus were not shown here. The XRD and TG results preliminarily demonstrated that the PEI/tart complexes could induce the deposition of TiO2.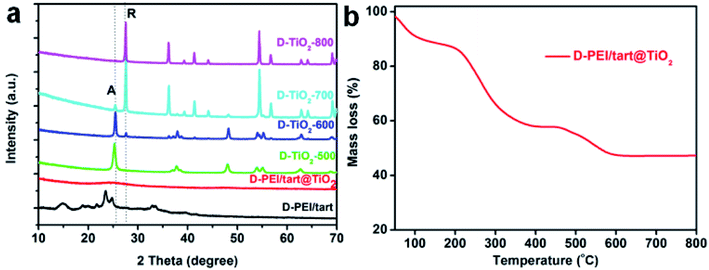 | ||
| Fig. 1 (a) XRD patterns for D-PEI/tart, D-PEI/tart@TiO2 (before calcination), and D-TiO2-X (after calcination, calcination temperature X = 500, 600, 700 and 800 °C); (b) TG curve for D-PEI/tart@TiO2. | ||
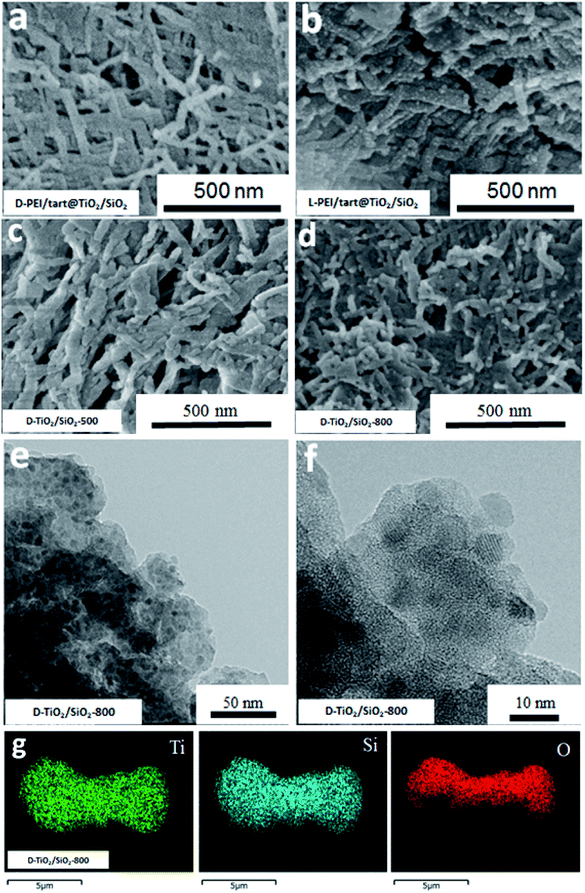
The sizes and nano/microscale morphologies of these TiO2-related samples were visualized by SEM and TEM (see Fig. 2). For D-PEI/tart@TiO2 (Fig. 2a) and L-PEI/tart@TiO2 (Fig. 2b), nanofibres bundles (average diameter ∼50 nm, length ca. 5 μm) were observed. Thus, the crystalline PEI/tart assemblies were still effective to produce 1-D TiO2 nanofibres under the aqueous and mild conditions. Similar to our early case in chiral silica deposition, there are also no shape chirality (i.e., helical shape) for the D- and L-PEI/tart@TiO2. After calcinations, the morphologies for D- and L-form samples were still similar to each other, and hence only the D-TiO2 sample's images in SEM and TEM were displayed in Fig. 2c–f. The nanofibres observed from as-prepared powders of D-PEI/tart@TiO2 (Fig. 2a) were destroyed when they were calcined at 500 °C (D-TiO2-500, Fig. 2c), and finally turned into irregular nanoparticles (NPs) with sizes of about 100–300 nm after treated at 800 °C (D-TiO2-800, Fig. 2d). This morphological change was also supported by the TEM images of D-TiO2-500 (Fig. 2e and f), where NPs with crystal lattice fringes and sizes about 10–25 nm were observed.
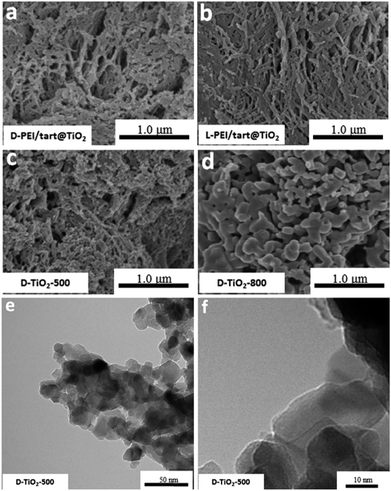 | ||
| Fig. 2 SEM image for (a) D-PEI/tart@TiO2, (b) L-PEI/tart@TiO2, (c) D-TiO2-500 and (d) D-TiO2-800; (e and f) the TEM images for D-TiO2-500. | ||
Characterizations of PEI/tart@TiO2/SiO2 and TiO2/SiO2
The samples obtained from the process of co-deposition of silica and titania were also characterized by the same methods. The XRD patterns for TiO2/SiO2-related samples were shown in Fig. 3a. Similar to D-PEI/tart@TiO2, the as-formed D-PEI/tart@TiO2/SiO2 hybrids were still amorphous. Compared with D-TiO2-500 (calcinated at 500 °C), the intensities of peaks for the anatase phase on D-TiO2/SiO2-500 were very weaker (Fig. 3a, inset). After heating at 800 °C, the intensities were obviously increased. However, different from the phase of rutile TiO2 found on D-TiO2-800, only anatase TiO2 was identified on D-TiO2/SiO2-800. The mass ratio of organic component in D-PEI/tart@TiO2/SiO2 estimated by the TG curve was about 51% (Fig. 1b).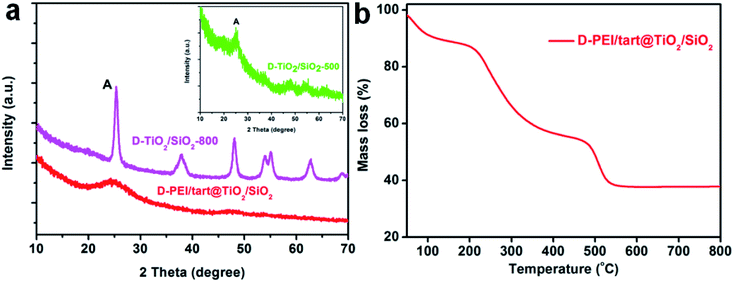 | ||
| Fig. 3 (a) XRD patterns for D-PEI/tart@TiO2/SiO2 (red line), D-TiO2/SiO2-500 (green line, inset) and D-TiO2/SiO2-800 (magenta line); (b) the TG curve for D-PEI/tart@ TiO2/SiO2. | ||
Furthermore, from the SEM images, the nanofibres were observed on the D- and L-PEI/tart@TiO2/SiO2 (Fig. 4a and b), similar to those for D- and L-PEI/tart@TiO2 hybrids (Fig. 2a and b). Different from the D-TiO2 samples, the nanofibres were effectively maintained on D-TiO2/SiO2-500 (Fig. 4c) and even D-TiO2/SiO2-800 (Fig. 4d) which were sintered at heating condition. From the TEM images of TiO2/SiO2-800 (Fig. 4e), many nanoparticles (NPs) less than 10 nm were observed; on the high-magnification TEM image (Fig. 4f), lattice fringes were clearly observed on these sub-10 nm NPs. It is clear that these TiO2 NPs were surrounded by the amorphous SiO2. Moreover, the elemental mapping (Fig. 4g) showed that Ti, Si and O were homogeneously mixed. These results implied that the co-deposition of TiO2 and SiO2 proceeds effectively on PEI/tart and the resulting structures of the encapsulated TiO2 in silica frames prevent the phase transformation of the component of TiO2 from anatase to rutile with maintaining the 1-D nanofibrous morphology even at 800 °C calcination.
CD optical activity of TiO2 and TiO2/SiO2-related products
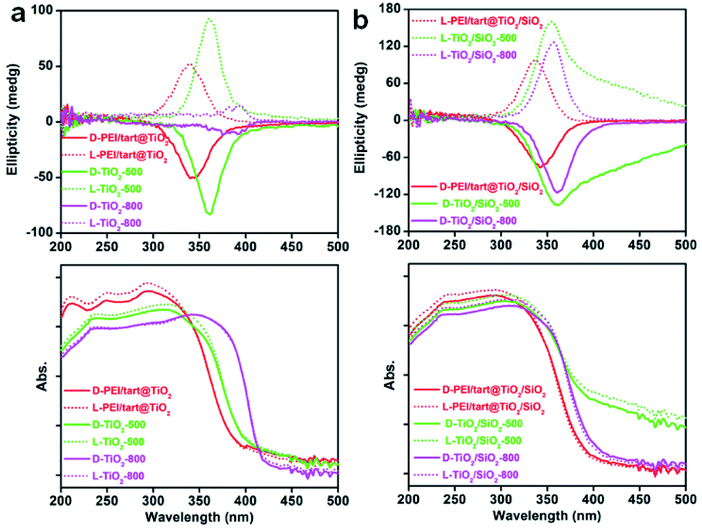
The powders of TiO2 and TiO2/SIO2 were conducted to CD spectroscopy. Fig. 5 showed the solid-state diffuse reflectance circular dichroism (DRCD) and corresponding UV-Vis absorption spectra of PEI/tart@TiO2. Although no any helical shape images were observed on the nanofibres-like morphologies (SEM images, Fig. 2a and b) for the D- and L-PEI/tart@TiO2, a pair of mirror relationship lines appeared clearly on the CD spectra with the antipodal signals across 280–420 nm and centred around 340 nm: the CD signal is negative for D-PEI/tart@TiO2 while positive for L-PEI/tart@TiO2 (Fig. 5a). The D- and L-PEI/tart@TiO2 showed similar UV-Vis absorption spectra with strong absorption from 200 nm to 400 nm, which is attributed to the electronic transition from the valence band to the conduction band of TiO2. With increasing the calcination temperature, the peaks for the CD signals showed a red-shift to 360 nm (at 500 °C) and then to 392 nm (at 800 °C), accompanied with the red-shift of the UV-Vis absorption extending to 420 nm. Generally, the band gap of TiO2 decreases from amorphous to anatase to rutile TiO2, and correspondingly the UV-Vis absorption band shifted to the long wavelength (red shift).21 According to the phase-changes seen in the XRD patterns (Fig. 1a), the red shift on the CD signals and UV-Vis absorption would be attributed to the phase transformation from amorphous to rutile. Such phase transformation also influenced the intensities of CD signals of the chiral products as order of TiO2-800 (rutile) < PEI/tart@TiO2 (amorphous) < TiO2-500 (anatase).For the case of co-deposited system, DRCD spectra (with signals centering at 340 nm) and UV-Vis absorption spectra (200–400 nm) of PEI/tart@TiO2/SiO2 still resemble those of PEI/tart@TiO2 (Fig. 5b). Since silica itself has no characteristic absorption band between 200 and 800 nm, the as-observed CD signals were dominated by the TiO2 components. After calcination the hybrid form at 500 °C, red-shift was observed both on the CD signals (to 360 nm) and UV-Vis absorption (to 420 nm) of TiO2/SiO2-500, which is similar to those of TiO2-500. The tailing lines towards longer wavelength over 400 nm would be due to the presence of organic byproducts stuck in the silica frame which formed during 500 °C calcination. Because no phase transformation (from anatase to rutile) occurred after calcination at 800 °C, the CD and UV-Vis spectra of TiO2/SiO2-800 are similar to those of TiO2/SiO2-500 with disappearance of the tailing lines. In addition, the CD intensity increased in the order of PEI/tart@TiO2/SiO2 < TiO2/SiO2-800 < TiO2/SiO2-500.
Discussion
Our previous research has proved that PEI/tart complexes could give nanofibrous PEI/tart@SiO2 hybrids and their derived SiO2 nanofibres after calcinations at 500 °C or above. The present results confirmed that the PEI/tart complexes are still effective to produce PEI/tart@TiO2 hybrids nanofibres. However, after calcinations at 500–800 °C, the nanofibrous morphologies of PEI/tart@TiO2 were destroyed. Former silica is amorphous even after calcination but the later titania becomes to crystalline structure from the amorphous state of the as-prepared form when heated. Therefore, there would arise strong strain which induces re-structuring the morphology of the hybrids. Moreover, after titania deposition, the crystalline template PEI/Tart lost its initial crystallinity although fibrous morphology was directed (Fig. 1a). This is different to the case of silica deposition in which the template component PEI/Tart is encapsulated in the produced fibrous hybrid of PEI/Tart@SiO2 and remains its crystalline structure some degree.40 This difference relates to the different feature of carboxylate on silica and titania. Usually, the carboxylate can interact with metal ions of oxide with coordination interactions while such interaction does not occur with silica.46 Probably, the metastable nanofibrous hybrid PEI/tart@TiO2 is a loose accumulation of the components of PEI, Tart and amorphous TiO2 so that at high temperature the fibrous morphology was destroyed with accompanying the growth of crystallites of TiO2.Although various chiral templates have been developed for the synthesis of chiral SiO2, the use of these templates in the synthesis of chiral TiO2 and TiO2/SiO2 composites are still limited. There was an example of a two-step method to prepare chiral TiO2/SiO2 films: SiO2 film with a long-range chiral nematic structure was firstly synthesized, then immersed into TiCl4 solution and finally calcinated at 600 °C to form chiral SiO2/anatase TiO2 film.29 In the present work, since both SiO2 and TiO2 could be deposited on the fibrous template of PEI/tart, it offered the feasibility for the co-deposition of TiO2 and SiO2 by an alternative one-step way. As confirmed by the elemental mapping in Fig. 4g, this method afforded homogeneous distribution between the as-formed TiO2 and SiO2 during the formation process, which resulted in better morphological stability of TiO2/SiO2 than that of the sole TiO2 system since the SiO2 nanofibres were thermally stable. As shown in the TEM images in Fig. 4e and f, it is clear that on the TiO2/SiO2 nanofibres, sub-10 nm TiO2 NPs were distributed on silica matrices. Consequently, the diffusion, aggregation and rearrangement of Ti and O atoms during calcinations would be restricted by the surrounding linkage of Si–O–Si–O, which are strong barriers to growth and phase transformation of TiO2 NPs. Indeed, even after heating at 500 °C, the crystallinity of TiO2 was still weak as judged by the XRD pattern (Fig. 3a), and a higher temperature (800 °C) was needed to facilitate the diffusion and rearrangement of Ti and O atoms to form anatase TiO2 with improved crystallinity. Although rutile TiO2 is a thermodynamically stable phase in the bulk state, some theoretical and experimental evidences have confirmed that anatase TiO2 is in fact stable when the sizes are small (less than 14 nm).35–37 Hence, both the anatase phase and the CD optical activity of TiO2 NPs were maintained even at 800 °C on TiO2/SiO2.
CD optical activity was found on all these TiO2-related products in spite of the morphological and phase change, from which it could be inferred that the chirality of TiO2-based products was much less dependent upon the morphologies on the length scale. Liu et al. reported helical TiO2 nanofibres (with helix pitches over tens nm) which were constructed by the helical stacking of TiO2 NPs (∼20 nm) along the organic soft templates, thus creating a dissymmetric field to induce CD optical activity.27 Their DRCD and UV-Vis spectra for those helical TiO2/organic hybrids and anatase TiO2 products (obtained at 550 °C) were similar to our samples of PEI/tart@TiO2 and TiO2-500, respectively. Therefore, it can be said that the optical activity on TiO2 should be attributed to other reasons except the general helical morphologies. Indeed, chirality can be found in a broad size-scale from atomic/molecular-, to nano-/micro- and to macro-scale. It was even found that several kinds of chiral features (e.g., lattice-chirality, shape-chirality) at different length-scales could simultaneously appear on the same chiral inorganic nanomaterial (e.g., ZnO, HgS).15,36 In another example,28 twisted TiO2 nanoribbons were prepared by using organic assemblies as the templates. Both the as-obtained TiO2/organics hybrids and anatase TiO2 after calcinations showed the twisted morphologies on the nano-scale. When the twisted nanoribbons of anatase TiO2 were transformed into nanoparticles by grinding, CD optical activity remained still in the same signature. After heating at 700 °C, anatase TiO2 turned into rutile TiO2, accompanied with the transformation of twisted nanoribbons into nanofibres and nanoparticles. However, the rutile TiO2 was still optically active with accompanying the red shift both on the CD and UV-Vis absorption spectra from anatase to rutile (this is similar to our case shown in Fig. 5a). According to these results, they argued that chiral defects at the Angstrom level drive the optical activity of the anatase and rutile TiO2. In other chiral inorganic nanomaterials (e.g., Ta2O5, CdSe/ZnS),18,43 some defects (e.g., point defects, screw dislocations) were also considered to induce the chirality.
In our very recent research on the chirality of chiral SiO2 nanofibres, it has been found that the sub-10 nm SiO2 NPs obtained by downsizing the long chiral SiO2 nanofibres via hydrothermal or chemical treatments were still chiral, as confirmed by antipodal signals corresponding to the Si–O–Si bond on the vibration circular dichroism spectra (VCD).13,44 Based on these results, we consider that the longer chiral SiO2 nanofibres would be constructed by linkage of a lot of small chiral (–O–Si–)n clusters (<10 nm) which resemble molecular scale asymmetry with special conformation. Therefore, even without chiral outward shapes on the larger length-scale, the non-helical SiO2 nanofibres are chiral because they carried the chiral information on the clusters-like scale (<10 nm). It is of conclusive that similar to silica system, PEI/tart assemblies also effectively prompted the deposition of TiO2 to give chiral PEI/tart@TiO2 nanofibres. Even these nanofibres were broken into nanoparticles of rutile TiO2, CD optical activity was still preserved. Hence, it is suggested that the chiral transfer mechanism via hydrolytic condensation and the concept of chiral domains for PEI/tart@SiO2 could be similarly applied to PEI/tart@TiO2 because in the as-prepared state, both SiO2 and TiO2 is similarly amorphous. For the chirality origin of TiO2 and TiO2/SiO2-related samples, we think that the asymmetric arrangement of Ti and O atoms in small chiral domains (<10 nm) would be important. That is, the structural properties (e.g., the lengths and angles of Ti–O bonds, coordination numbers and geometry of Ti–O units) of the initially formed Ti–O clusters around the surface of PEI/tart would be influenced by the chiral conformation of PEI/tart, which results in the formation of chiral domains (<10 nm) with asymmetric arrangement of Ti and O atoms in TiO2. To some extent, this speculation was supported by comparison of the Ti 2p XPS spectra of the samples of chiral D-TiO2, D-TiO2/SiO2 and achiral aTiO2 (prepared without tart, details see ESI‡) calcined at 500 °C (Fig. 6). Interestingly, the binding energy of the peak for Ti 2p3/2 (or Ti 2p1/2) for the chiral D-TiO2-500 is close to that of D-TiO2/SiO2-500 but was shifted toward higher region compared to the binding energy of the achiral aTiO2-500. Since the binding energy is sensitive to the local structural information (e.g., the numbers and positions of oxygen atoms surrounding Ti atom, the length and angles of Ti–O bonds, the electron density around Ti cation), the shift on the binding energy between chiral TiO2 and achiral TiO2 implied that the structural difference of the coordination bonding of Ti–O between chiral TiO2 and achiral TiO2. The phase transformation was in fact a process of rearrangement of atoms, thus the local adjustment of Ti and O atoms in these chiral domains was unavoidable. Based on that the chiral TiO2 (or TiO2/SiO2) calcined at 500 °C showed the highest intensities of CD signals, it seems that these chiral structures of Ti–O clusters were thermodynamically metastable in a relatively low temperature range (about 500 °C). Therefore, even if there was a heating-driven structural self-adjustment of the initial chiral Ti–O clusters in the amorphous TiO2, the chiral feature of the as-formed Ti–O clusters in the anatase TiO2 were still maintained or even strengthened, as seen in the intensities of CD signals which increased from the samples before calcination to the ones calcined at 500 °C for both chiral TiO2 and TiO2/SiO2.
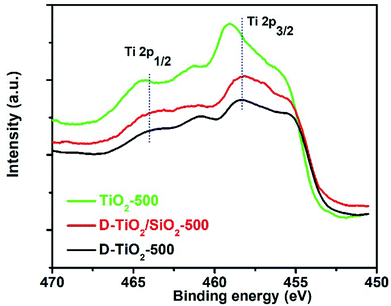 | ||
| Fig. 6 XPS spectra of the samples of D-TiO2 (black line), D-TiO2/SiO2 (red line), and achiral aTiO2 (green line) calcined at 500 °C. | ||
In principle, chiral Ti–O clusters should be different from the normal structures of Ti–O units in amorphous, anatase and rutile TiO2. In the 230 kinds of space groups of crystals, 65 kinds of Sohncke space groups can lead to chiral crystals.45 However, both the space groups of anatase (I41/amd) and rutile (P42/mnm) TiO2 contain some symmetric operations (e.g., mirror, glide) and do not belong to the Sohncke space groups. Nevertheless, the small chiral Ti–O clusters initially formed in the amorphous TiO2 could work as chiral sources to produce new chiral Ti–O clusters (i.e., chiral defects) in the crystalline anatase and rutile TiO2. In this way, the chiral information of Ti–O clusters was self-transferred via the structural maintenance or self-adjustment during the phase transformation of TiO2. Since these chiral domains were small, it was less influenced by the morphological change on the larger length-scale and thus optically active rutile and anatase TiO2 could be acquired at 800 °C. Nevertheless, it should be noted that more future work is necessary to reveal the detailed information of these chiral structures and the chirality origin.
Conclusions
In summary, chiral TiO2 and TiO2/SiO2 could be easily prepared via hydrolytic condensation of water soluble titanium bislactate on chiral PEI/tart complexes which played as catalytic chiral templates. It was considered that the chirality of these chiral products is based on the asymmetric arrangement of Ti and O atoms in a small size scale less than 10 nm. Consequently, the chirality could be maintained even on rutile TiO2 calcined at 800 °C even the morphologies on the nano-/micro-scale were destructed. Because PEI/tart was also able to induce the deposition of chiral SiO2 on their surface, the as-formed SiO2 could disperse TiO2 NPs and then restrict the growth and phase transformation (from anatase to rutile) of TiO2 NPs when TiO2 and SiO2 were co-deposited on the PEI/tart. Thus chiral sub-10 nm anatase TiO2 NPs were well maintained and dispersed on the nanofibres at a high temperature up to 800 °C. In our preliminary test (unpublished), we have found that chiral TiO2 possesses better photocatalytic performance over achiral TiO2. Probably, the chirality on the atomic/molecular-scale may influence the properties of TiO2 and bring about new applications.Experimental
Synthesis of PEI
The synthesis of PEI was performed in our previous work.39Synthesis of PEI/tart complex40
0.30 g of D-tartaric acid (D-tart) was added into 80 mL of H2O and heated around 80 °C. Meanwhile, 0.32 g of PEI powders were dissolved in 80 mL of H2O by heating around 80 °C with stirring. Then these two solutions were mixed with stirring for several minutes around 80 °C. After that, the mixed solution was placed into water bath and then cooled down to room temperature, and the pH of the solution was modulated to be ∼4.00 by diluted ammonia. The solution was placed in a refrigerator (∼4 °C) overnight to form a suspension, from which white precipitate was collected by centrifugation and further washed by H2O three times. The as-collected white products were the crystalline D-form PEI/tart complex (D-PEI/tart). For the L-form PEI/tart, the synthesis was the same to that of D-PEI/tart except replacing D-tart with L-tart.Synthesis of PEI/tart@TiO2 hybrids
The as-collected D-PEI/tart complex above was dispersed in 15 mL of H2O. The TiO2 source solution was prepared as follows: 6 mL of titanium bislactates (44 wt% aqueous solution, abbreviated as TiLact2, the commercial name is TC310 from Matsumoto Chemical Co. Japan), 6 mL of ammonia (1 mol L−1), and 8 mL of H2O was mixed with stirring for 30 minutes. Then the TiO2 source solution was added into the suspension of D-PEI/tart complex. After stirring for 2 hours at room temperature, white precipitates were collected by centrifugation, washed by H2O and acetone, and dried under vacuum. Finally, the white powders of D-PEI/tart@SiO2 were obtained. L-PEI/tart@TiO2 powders were similarly obtained by using L-PEI/tart complex.Synthesis of PEI/tart@TiO2/SiO2 hybrids
The D-PEI/tart complex above was dispersed in 15 mL H2O. The TiO2 source solution (6 mL of TiLact2 [44 wt% aqueous solution], 6 mL of 1 mol L−1 ammonia, 8 mL of distilled water) was prepared by the same way as shown above. The TiO2/SiO2 source solution was prepared by mixing the TiO2 source solution and 3 mL of tetramethoxysilane (TMOS) via stirring for 3 minutes and then added into the suspension of D-PEI/tart. After stirring of 2 hours, white precipitate was separated by centrifugation, washed by H2O and acetone, and finally dried under vacuum. The as-formed white powders were called as D-PEI/tart@TiO2/SiO2.L-PEI/tart@ TiO2/SiO2 was similarly prepared by using L-PEI/tart complex.
Synthesis of TiO2 and TiO2/SiO2 by calcination
PEI/tart@TiO2 and PEI/tart@TiO2/SiO2 were calcinated at a given temperature (500, 600, 700, 800 °C) for 1 h under air by which TiO2 and TiO2/SiO2 were formed, respectively. The products obtained at different temperatures was denoted as TiO2-X or TiO2/SiO2-X (X means the calcination temperature, X = 500, 600, 700, 800).Characterizations
XRD patterns were collected on a Rigaku RINT Ultima-III X-ray diffractometer with Cu Kα radiation (λ = 0.1540 nm). The SEM images were taken on a HITACHI SU8010 scanning electron microscope (SEM) equipped with energy dispersive spectrometer (EDS). The TEM analysis was finished on a HT7700 (Hitachi) instrument with acceleration voltage of 200 kV. The spectra of solid-state diffuse reflectance circular dichroism (DRCD) and UV-Vis absorption of the solid products (40 wt%) dispersed in KCl were simultaneously recorded on a JASCO J-820 spectropolarimeter equipped with a DRCD-466L unit. The TG analysis is conducted on a Exstar 6000 instrument (Seiko Instruments Inc.).Conflicts of interest
There is no conflicts to declare.Acknowledgements
This work was supported in part by MEXT-Supported Program for the Strategic Research Foundation at Private Universities: ‘‘Creation of new fusion materials by integration of highly-ordered nano inorganic materials and ultra-precisely controlled organic polymers’’ (2013–2017) and by JSPS KAKENHI Grant Number JP16H06515 (Coordination Asymmetry).References
- J. Govan and Y. K. Gun'ko, in Nanoscience, The Royal Society of Chemistry, vol. 3, 2016, pp. 1–30 Search PubMed.
- R.-H. Jin, D.-D. Yao and R. Levi, Chem.–Eur. J., 2014, 20, 7196–7214 CrossRef CAS PubMed.
- J. Kumar, K. G. Thomas and L. M. Liz-Marzan, Chem. Commun., 2016, 52, 12555–12569 RSC.
- K. Soai, T. Kawasaki and A. Matsumoto, Acc. Chem. Res., 2014, 47, 3643–3654 CrossRef CAS PubMed.
- C. Chen, H. Shi and G. Zhao, J. Phys. Chem. C, 2014, 118, 12041–12049 CAS.
- E. Hendry, T. Carpy, J. Johnston, M. Popland, R. V. Mikhaylovskiy, A. J. Lapthorn, S. M. Kelly, L. D. Barron, N. Gadegaard and M. Kadodwala, Nat. Nanotechnol., 2010, 5, 783–787 CrossRef CAS PubMed.
- M. Giese, J. C. De Witt, K. E. Shopsowitz, A. P. Manning, R. Y. Dong, C. A. Michal, W. Y. Hamad and M. J. MacLachlan, ACS Appl. Mater. Interfaces, 2013, 5, 6854–6859 CAS.
- B. Qiu, M. Xing, Q. Yi and J. Zhang, Angew. Chem., Int. Ed., 2015, 54, 10643–10647 CrossRef CAS PubMed.
- V. K. Valev, J. J. Baumberg, C. Sibilia and T. Verbiest, Adv. Mater., 2013, 25, 2517–2534 CrossRef CAS PubMed.
- D. Wang, Y. Li, G. Li Puma, C. Wang, P. Wang, W. Zhang and Q. Wang, Chem. Commun., 2013, 49, 10367–10369 RSC.
- S. Eslami, J. G. Gibbs, Y. Rechkemmer, J. van Slageren, M. Alarcón-Correa, T.-C. Lee, A. G. Mark, G. L. J. A. Rikken and P. Fischer, ACS Photonics, 2014, 1, 1231–1236 CrossRef CAS.
- Y. Wang, J. Xu, Y. Wang and H. Chen, Chem. Soc. Rev., 2013, 42, 2930–2962 RSC.
- X.-L. Liu, S. Tsunega and R.-H. Jin, Nanoscale Horiz., 2017, 2, 147–155 RSC.
- H. Huo, S. Wang, S. Lin, Y. Li, B. Li and Y. Yang, J. Mater. Chem. A, 2014, 2, 333–338 CAS.
- Y. Duan, L. Han, J. Zhang, S. Asahina, Z. Huang, L. Shi, B. Wang, Y. Cao, Y. Yao, L. Ma, C. Wang, R. K. Dukor, L. Sun, C. Jiang, Z. Tang, L. A. Nafie and S. Che, Angew. Chem., Int. Ed., 2015, 54, 15170–15175 CrossRef CAS PubMed.
- Y. Duan, X. Liu, L. Han, S. Asahina, D. Xu, Y. Cao, Y. Yao and S. Che, J. Am. Chem. Soc., 2014, 136, 7193–7196 CrossRef CAS PubMed.
- G. Chu, W. Xu, D. Qu, Y. Wang, H. Song and Y. Xu, J. Mater. Chem. C, 2014, 2, 9189–9195 RSC.
- C. Zhang, Y. Wang, J. Qin, B. Li, Y. Li and Y. Yang, RSC Adv., 2015, 5, 59384–59389 RSC.
- J. Chen, S. Li, J. Du, B. Wang, S. Meng, J. Liu and M. Yu, Phys. Chem. Chem. Phys., 2016, 18, 20261–20265 RSC.
- C. Wang, X. Liu, M. E. Fleet, J. Li, S. Feng, R. Xu and Z. Jin, CrystEngComm, 2010, 12, 1617–1620 RSC.
- X. Chen and S. S. Mao, Chem. Rev., 2007, 107, 2891–2959 CrossRef CAS PubMed.
- T. Song and U. Paik, J. Mater. Chem. A, 2016, 4, 14–31 CAS.
- Y. Zhang, Z. Jiang, J. Huang, L. Y. Lim, W. Li, J. Deng, D. Gong, Y. Tang, Y. Lai and Z. Chen, RSC Adv., 2015, 5, 79479–79510 RSC.
- J. H. Jung, H. Kobayashi, K. J. C. van Bommel, S. Shinkai and T. Shimizu, Chem. Mater., 2002, 14, 1445–1447 CrossRef CAS.
- S. Kobayashi, N. Hamasaki, M. Suzuki, M. Kimura, H. Shirai and K. Hanabusa, J. Am. Chem. Soc., 2002, 124, 6550–6551 CrossRef CAS PubMed.
- C. Zhang, S. Wang, H. Huo, Y. Li, B. Li and Y. Yang, Mater. Lett., 2012, 88, 23–26 CrossRef CAS.
- S. H. Liu, L. Han, Y. Y. Duan, S. Asahina, O. Terasaki, Y. Y. Cao, B. Liu, L. G. Ma, J. L. Zhang and S. A. Che, Nat. Commun., 2012, 3, 1215 CrossRef PubMed.
- S. B. Wang, C. Y. Zhang, Y. Li, B. Z. Li and Y. G. Yang, Chirality, 2015, 27, 543–550 CrossRef CAS PubMed.
- K. E. Shopsowitz, A. Stahl, W. Y. Hamad and M. J. MacLachlan, Angew. Chem., Int. Ed., 2012, 51, 6886–6890 CrossRef CAS PubMed.
- C. Wang, S. H. Liu, Y. Y. Duan, Z. H. Huang and S. N. Che, Sci. Technol. Adv. Mater., 2015, 16, 054206 CrossRef PubMed.
- K. M. Krause and M. J. Brett, Adv. Funct. Mater., 2008, 18, 3111–3118 CrossRef CAS.
- S. H. Lee, D. P. Singh, J. H. Sung, M. H. Jo, K. C. Kwon, S. Y. Kim, H. W. Jang and J. K. Kim, Sci. Rep., 2016, 6, 19580 CrossRef CAS PubMed.
- N. Mizutani, D. H. Yang, R. Selyanchyn, S. Korposh, S. W. Lee and T. Kunitake, Anal. Chim. Acta, 2011, 694, 142–150 CrossRef CAS PubMed.
- H. Shi, C. Chen, B. Tang and G. Zhao, Electrochim. Acta, 2014, 146, 359–364 CrossRef CAS.
- A. A. Gribb and J. F. Banfield, Am. Mineral., 1997, 82, 717–728 CAS.
- H. Z. Zhang and J. F. Banfield, J. Mater. Chem., 1998, 8, 2073–2076 RSC.
- H. Z. Zhang and J. F. Banfield, J. Mater. Chem. B, 2000, 104, 3481–3487 CAS.
- P. P. Wang, S. J. Yu, A. O. Govorov and M. Ouyang, Nat. Commun., 2017, 8, 14312 CrossRef CAS PubMed.
- J.-J. Yuan and R.-H. Jin, Langmuir, 2005, 21, 3136–3145 CrossRef CAS PubMed.
- H. Matsukizono and R.-H. Jin, Angew. Chem., Int. Ed., 2012, 51, 5862–5865 CrossRef CAS PubMed.
- P.-X. Zhu and R.-H. Jin, Eur. J. Inorg. Chem., 2010, 476–482 CrossRef CAS.
- J.-J. Yuan and R.-H. Jin, Langmuir, 2010, 26, 4212–4218 CrossRef CAS PubMed.
- M. V. Mukhina, V. G. Maslov, A. V. Baranov, A. V. Fedorov, A. O. Orlova, F. Purcell-Milton, J. Govan and Y. K. Gun’ko, Nano Lett., 2015, 15, 2844–2851 CrossRef CAS PubMed.
- X.-L. Liu, S. Tsunega and R.-H. Jin, ACS Omega, 2017, 2, 1431–1440 CrossRef CAS.
- C. Dryzun and D. Avnir, Chem. Commun., 2012, 48, 5874–5876 RSC.
- K. D. Dobson and A. J. McQuillan, Spectrochim. Acta, Part A, 2000, 56, 557–565 CrossRef CAS.
Footnotes |
| † A part of this work was previously filed as patent priority application of PCT/JP2012/077829 on October 29, 2012 and was assessed as a Patent US 9,701,545B2. |
| ‡ Electronic supplementary information (ESI) available. See DOI: 10.1039/c8ra02926a |
| This journal is © The Royal Society of Chemistry 2018 |

