DOI:
10.1039/C8RA02924E
(Paper)
RSC Adv., 2018,
8, 26488-26496
Enhanced bioconversion of hydrogen and carbon dioxide to methane using a micro-nano sparger system: mass balance and energy consumption†
Received
5th April 2018
, Accepted 30th May 2018
First published on 25th July 2018
Abstract
Simultaneous CO2 removal with renewable biofuel production can be achieved by methanogens through conversion of CO2 and H2 into CH4. However, the low gas–liquid mass transfer (kLa) of H2 limits the commercial application of this bioconversion. This study tested and compared the gas–liquid mass transfer of H2 by using two stirred tank reactors (STRs) equipped with a micro-nano sparger (MNS) and common micro sparger (CMS), respectively. MNS was found to display superiority to CMS in methane production with the maximum methane evolution rate (MER) of 171.40 mmol/LR/d and 136.10 mmol/LR/d, along with a specific biomass growth rate of 0.15 d−1 and 0.09 d−1, respectively. Energy analysis indicated that the energy-productivity ratio for MNS was higher than that for CMS. This work suggests that MNS can be used as an applicable resolution to the limited kLa of H2 and thus enhance the bioconversion of H2 and CO2 to CH4.
Introduction
Carbon dioxide (CO2) has been regarded as the largest contributor to global warming, accounting for about 60% of the greenhouse gas effects.1 According to a recent survey,2 following the energy industry, the industry and product sector (7%) is the second emission source in Japan, especially the iron and steel industry. CO2 is usually discharged as a waste product due to its inert, non-reactive, and low Gibbs free energy properties. Various CO2 removal technologies including absorption,3 adsorption,4 cryogenic distillation,5 and membranes6 have been proposed and investigated to mitigate its emission. Taking into consideration that CO2 is another important carbon source, the conversion of CO2 to chemicals and energy products that are currently produced from fossil fuels is promising due to the high potential market and promising benefits.7,8 In comparison to chemical-based CO2 capture, biological conversion of CO2 together with hydrogen (H2) to methane (CH4) attracts particular interest, because the profits generated from CO2 utilization can offset a portion of the capture cost under mild operational conditions.9,10 Bioconversion of CO2 to CH4 by hydrogenotrophic methanogens is of considerable interest because this process realizes energy storage and conversion, as well as using the biological-based CO2 capture and sequestration technique.11,12 The calorific value can be improved by converting nonflammable CO2 to CH4 (with a calorific value of 55 kJ kg−1). Moreover, methanogens can produce not only methane but also valuable materials such as enzymes, amino acids, vitamins and so on.13
However, there are two key points in the bioconversion procedure. The first one is the source of the energy donor H2. In the previous study, H2 can be rapidly produced via water electrolysis,14 or obtained from biological process (bio-hydrogen).15,16 While considering H2 is also a co-product in the steel sector, it is a promising alternative to utilize the waste H2 to realize the bioconversion. Meanwhile, CH4 as the product of the bioconversion is also regarded as an energy carrier for electricity storage, which is more easily transported or stored than H2.17
The second point, also the big obstacle to the successful development of the technology for scaling up is the poor gas–liquid mass transfer rate (kLa) of low soluble H2 gas.18–20 When gas is sparged into the liquid, the kLa principally depends on the size and number of bubbles present,21 which are affected by many factors such as agitation speed,22 gas or liquid flow rate,23 reactor geometry11,23 and the nature of the liquid.24 Various methods were employed to improve the kLa value of H2. Kougias et al.25 demonstrated successful ex situ biogas upgrading in different systems by the action of hydrogenotrophic methanogens. Compared with the continuous stirred tank reactor (CSTR) and bubble column reactor, the two connected up-flow reactor gained the highest efficiency of biogas upgrading with the CH4 content of 98%. Bassani et al.19 constructed a granular UASB coupled with a separate chamber for H2 injection. The kLa value of H2 was improved by different packing materials (rashing rings and alumina ceramic sponge), which lead to a maximum increase of 24% in CH4 content. While the kLa value of hydrogen was not mentioned. Diaz et al.20 evaluated the potential of a pilot hollow-fiber membrane bioreactor for the conversion of H2 and CO2 to CH4. The system transformed 95% of H2 and CO2 fed at a maximum loading rate of 40.2 mH23/mR3d and produced 0.22 m3 of CH4 per m3 of H2 fed at thermophilic conditions. kLa-H2 of 430 h−1 were reached in the bioreactor by sparging gas through the membrane module. Luo and Angelidaki23 used the CSTR equipped with a column diffuser (pore diameters 0.5–1.0 mm) or ceramic diffuser (14–40 μm) to realize in situ biogas upgrading by co-digestion of manure and whey with the addition of H2. The decrease in pore size of diffusers lead to an increase in kLa value from 6.60 h−1 to 16.05 h−1. While much higher kLa values of H2 (105–776 h−1) were reached by up-flow reactors in the research of Bassani et al.26 Converse to the result of Luo and Angelidaki,23 the smaller pore size lead to the lower kLa value, which was illustrated that the more efficient gas bubble break was caused by the larger pore size devices. Although various enhancement measures have improved the kLa of H2 and CH4 production significantly, the energy consumption and practical viability of them should be carefully evaluated for their applications in large scale fermentation systems. What's more, not only the CH4 yield and kLa-H2, but also the intermediates variation and biomass growth should be taken into deep consideration, to understand the evolution of carbon and hydrogen.
Recently, a special attention has been paid to the application of micro-nano bubbles (MNBs) technology in many fields, including medicine science,27 food science,28 aquaculture,29 and water remediation.30 Several special characteristics of MNBs, such as high specific area (surface area per volume) and high stagnation in liquid phase, increase the gas dissolution. Moreover, it has been reported that the collapse of micro-bubbles, due to the high density of ions in gas–liquid interface just before the collapse, will lead to free radical generation, which might be favorable for microbial metabolism and further stimulate the bioactivity.31 Up to now, however, little information can be found on the combination of MNBs with methanogenesis. Except the methane production performance and mass transfer of H2, it is worthy to explore the interaction of bubbles and microbes.
In this study, MNBs were applied for the bioconversion of H2 and CO2 to CH4, aiming at supplying a sufficient interaction of gaseous substrates and methanogens. The effect of MNBs on methanogens was achieved by operating two bioreactors equipped with micro-nano sparger (MNS) and common micro sparger (CMS), respectively. The gas–liquid mass transfer of hydrogen was also determined in this study. Bubble size distribution of the two spargers were analyzed to calculate the specific surface area. By analyzing the variations of reactants and products in the two bioreactors and conducting the mass balance analysis, deeply understand the evolution procedure of carbon and hydrogen. Also, the energy consumption analysis was conducted to figure out the commercialization potential of MNS.
Materials and methods
Experimental apparatus and operation conditions
This study was carried out in two identical stirred tank reactors (STRs) equipped with a micro-nano sparger (MNS) (Foamest Column 16-60, Nac sales corporation, Japan) and a common micro sparger (CMS) (HA003, Haohai, China), respectively. The two reactors have a same total volume of 1.1 L (headspace![[thin space (1/6-em)]](https://www.rsc.org/images/entities/char_2009.gif) :liquid = 6:5, v/v). The H2 and CO2 gas mixture (80/20, v/v) was transferred from the head space of the reactor to the liquid phase by a diaphragm pump (GS-6EA, E.M.P.-Japan Ltd, Japan), with a continuous recirculation rate of 40 mL min−1. A gas holder connected to the head space of the reactor was used to allow fermentation to proceed without creating vacuum and maintain a positive and constant pressure inside the reactor during the fermentation. A magnetic stirrer was employed for both reactors to maintain mixing (500 rpm) and temperature maintenance (37 ± 2 °C). All the tube connections, stoppers, and seals were made of butyl rubber and glass. The diagram of the experimental setup in this study is illustrated in Fig. 1.
:liquid = 6:5, v/v). The H2 and CO2 gas mixture (80/20, v/v) was transferred from the head space of the reactor to the liquid phase by a diaphragm pump (GS-6EA, E.M.P.-Japan Ltd, Japan), with a continuous recirculation rate of 40 mL min−1. A gas holder connected to the head space of the reactor was used to allow fermentation to proceed without creating vacuum and maintain a positive and constant pressure inside the reactor during the fermentation. A magnetic stirrer was employed for both reactors to maintain mixing (500 rpm) and temperature maintenance (37 ± 2 °C). All the tube connections, stoppers, and seals were made of butyl rubber and glass. The diagram of the experimental setup in this study is illustrated in Fig. 1.
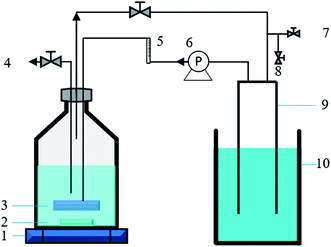 |
| | Fig. 1 Schematic diagram of the batch fermentation system. (1) Magnetic stirrer, (2) rotor, (3) micro-nano sparger (or common micro sparger), (4) liquid sample port, (5) flow meter, (6) gas recirculation pump, (7) gas input port, (8) gas sample port, (9) gas holder, (10) saturated sodium bicarbonate solution. | |
Inoculum and medium
The acclimated inocula, collected from the pond sediment (Matsumi Ike, Tsukuba campus) which has been well adapted to the H2/CO2 gas mixture (80/20, v/v) for 4 months' methane production, were introduced at a ratio of 1:4 (v/v) into the medium. The compositions of medium were the same as a previous study.32
Analytical methods
The contents of H2, CO2, and CH4 in the gas phase were analyzed by gas chromatograph (Shimadzu GC-8A, Japan) equipped with a thermal conductivity detector connected to a chromatopac data analyzer (Shimadzu C-R4A, Japan). A stainless steel column packed with Porapak-Q was used for the analysis, with the temperatures of both detector and injector at 60 °C and of the column at 80 °C, respectively. N2 was used as the carrier gas at an inlet pressure of 199 kPa and an outlet pressure of 150 kPa, respectively. The gas samples were taken at an interval of 24 h.
Total solid (TS), volatile solid (VS), and biomass concentration were analyzed according to the standard methods.33 Volatile fatty acids (VFAs) were analyzed by gas chromatography (GC-FID, Shimadzu C-R8A, Japan). Soluble carbon was analyzed by a TOC analyzer (Shimadzu TOC-VCSN, Japan). The liquid samples were collected every three days, which were used for VFAs analysis after filtration through 0.22 μm filters. 3% phosphoric acid solution was added to the filtrate to acidify samples at a volume ratio of 1:9 for the analysis of volatile fatty acids (VFAs). Gas chromatograph (GC-8A, Shimadzu) equipped with Unisole F-200 30/60 column and flame ionization detector (FID) was used for quantification of VFAs, including acetic acid (HAc), propionic acid (HPr), iso-butyric acid (iso-HBu), n-butyric acid (n-HBu), iso-valeric acid (iso-HVa) and n-valeric acid (n-HVa).34
The bubble size distribution from the two sparger systems was analyzed by Nano Sight (nano scale bubbles) and a high-speed camera (micro scale bubbles) with distilled water as the media. The mean bubble size was utilized for the calculation of specific surface area.
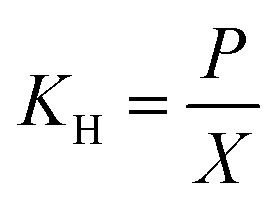
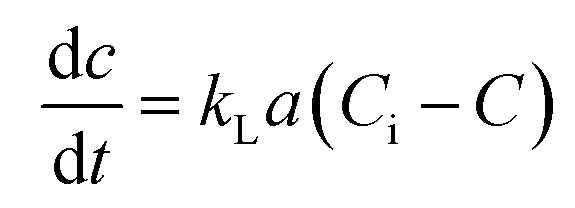
The mass transfer coefficient (kLa) of H2 was determined before inoculation. H2 was supplied to the reactors continuously. H2 gas samples were collected from a three-way gas sampling port at an interval of 5 min. The first gas sample was collected at 2 min after the introduction of H2 gas into the reactor. Once being collected, the gas sample was injected into a 20 mL sealed vial which contained some water at a same gas phase to liquid phase ratio as the reactor. Then the gas and the liquid was well mixed using a vortex mixer for 1 min and allowed 1 h to equilibrate the gas and the liquid phases. A gas sample from the head space was then taken and analyzed for gas composition in the gaseous phase using GC-TCD (Shimadzu GC-8A, Japan). The gas content in the head space was then converted to the aqueous phase concentration according to Henry's law (eqn (1)).
| |
 | (1) |
where,
KH is the Henry's law constant (atm),
P is the partial pressure of gas above the aqueous phase (atm) and
X is the mole fraction of gas in the solution (unitless). The Henry's law constant used for H
2 in this analysis was 7.52 × 10
4 atm (at 35 °C and 1 atm).
SEM images were taken by Field Emission Scanning Electron Microscope (FE-SEM, S-4800; Hitachi Hitec Corp, Japan) using the samples during the stable operation of the two reactors (on day 38). The samples were diluted by ten times and dried for one night in the oven (40 ± 1 °C) before being used for analysis.
Calculation
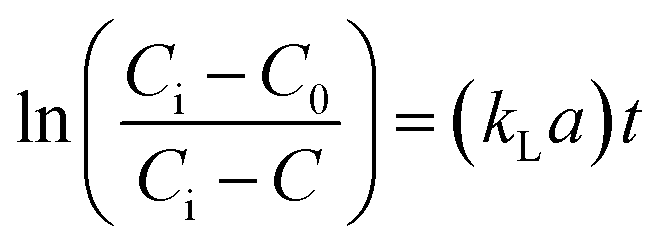
Determination of kLa of hydrogen. Assuming that the concentration in the liquid phase at the gas–liquid interface is in equilibrium with the gas concentration in the gaseous phase, the volumetric mass transfer coefficient (kLa) in the absence of microorganisms was determined using the following equation (eqn (2)).| |
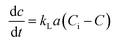 | (2) |
where, C is the gas concentration in the liquid phase (mg L−1) at any given time t (min), and Ci is the saturated gas concentration (mg L−1). eqn (2) can be further simplified to eqn (3),| |
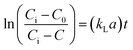 | (3) |
where, C0 is the initial gas concentration in the liquid phase (mg L−1).
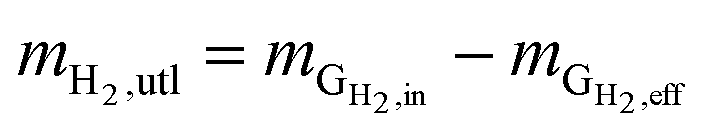
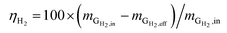
Hydrogen conversion efficiency. Hydrogen was provided as the sole electron donor for the batch experiments. As the total mass of H2 supplied into the systems  is the sum of the mass utilized by the microbes and the mass left (effluent) in the system, the H2 conversion efficiency (%) was calculated according to eqn (4),
| |
 | (4) |
where  is the mass flow rate of H2 fed into the reactor per day and
  is the mass flow rate of H2 in the effluent gas. The utilized H2
  was the difference between
  and
and  , as shown in eqn (5):
| |
 | (5) |
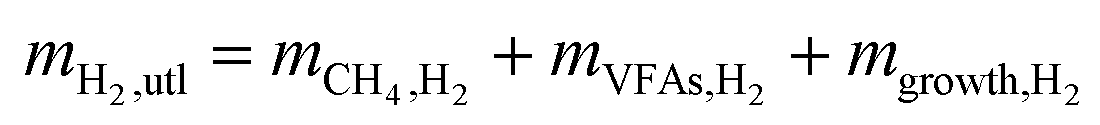
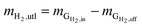
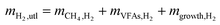
mH2,utl can be classified into two parts, H2 employed for microorganisms growth (anabolism) and consumed to produce energy (catabolism). Since the H2 as an energy source can be transferred to VFAs as the intermediates and CH4 as the final product, the utilized H2 can be quantified according to eqn (6).| |
 | (6) |
where mCH4,H2 is the mass of CH4 as equivalent H2, mVFAs,H2 is that of H2 transferred into VFAs, and mgrowth,H2 is that of H2 employed for microbial growth.
Carbon balance analysis. The carbon was supplied in three phases in this study: CO2 (gas phase), Na2CO3 (liquid phase), and inoculum or biomass (solid phase), which can be expressed as follows:| |
 | (7) |
After the reaction, CO2 can be transferred into CH4, VFAs, and utilized for microbial growth, and other metabolites. Finally, the unreacted CO2 was left in the system.
| |
 | (8) |
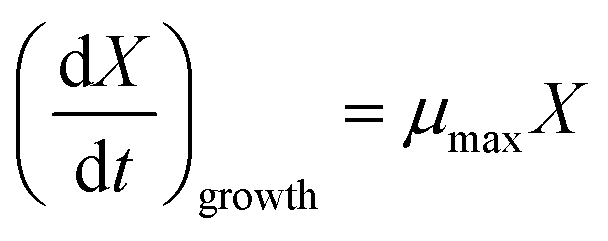
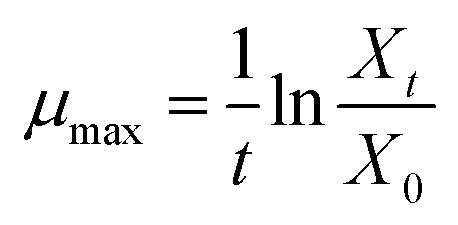
Estimation of Monod kinetic parameters for the batch experiments. In order to estimate the maximum specific growth rate (μmax), the nutrients were supplied sufficiently to create the condition of nutrients concentration (C) ≫ Ks (i.e. C/(Ks + C) ≈ 1). During the exponential growth phase, the Monod equation can be simplified to eqn (9).| |
 | (9) |
where μmax is the maximum specific growth rate (d−1). Then, μmax can be obtained by eqn (10):| |
 | (10) |
where X0 is the initial biomass concentration (g-biomass per L) and Xt is the biomass concentration at time t during exponential growth with no limitation of nutrients (g-biomass per L).
Energy consumption analysis. The electricity consumed by the systems was estimated by monitoring the energy consumption of the related devices. The energy input was the sum of electricity consumed by pumps and stirrers, as shown in eqn (11):| | |
Econsumed = Epump + Estirrer
| (11) |
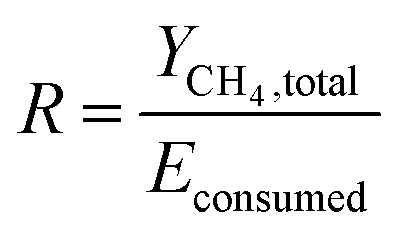
where Econsumed, Epump and Estirrer are the total energy consumed by the system, the energy consumed by pump and stirrer, respectively.The energy-product ratio (R) was calculated by eqn (12).
| |
 | (12) |
where
R is the energy-product ratio (L kW
−1),
YCH4,total is the accumulated methane production during the whole experimental period (L). The energy consumption is mainly attributable to the heat loss during the operation with a small amount utilized by the growth of microbes.
Statistic analysis. All the data were expressed as mean value ± standard deviation in this study. The significance of difference in the quantitative variables (e.g. CH4 content in the output gas) between the two reactor systems was analyzed by one-way analysis of variance (ANOVA) using Origin 9.0 (Originlab, USA), and significance was assumed at p < 0.05. Moreover, regarding the microbial community, statistical analysis was carried out as previously described by Tsapekos et al.35 to identify the significant abundance difference in microorganisms among the samples.
Results and discussion
Bioconversion performance
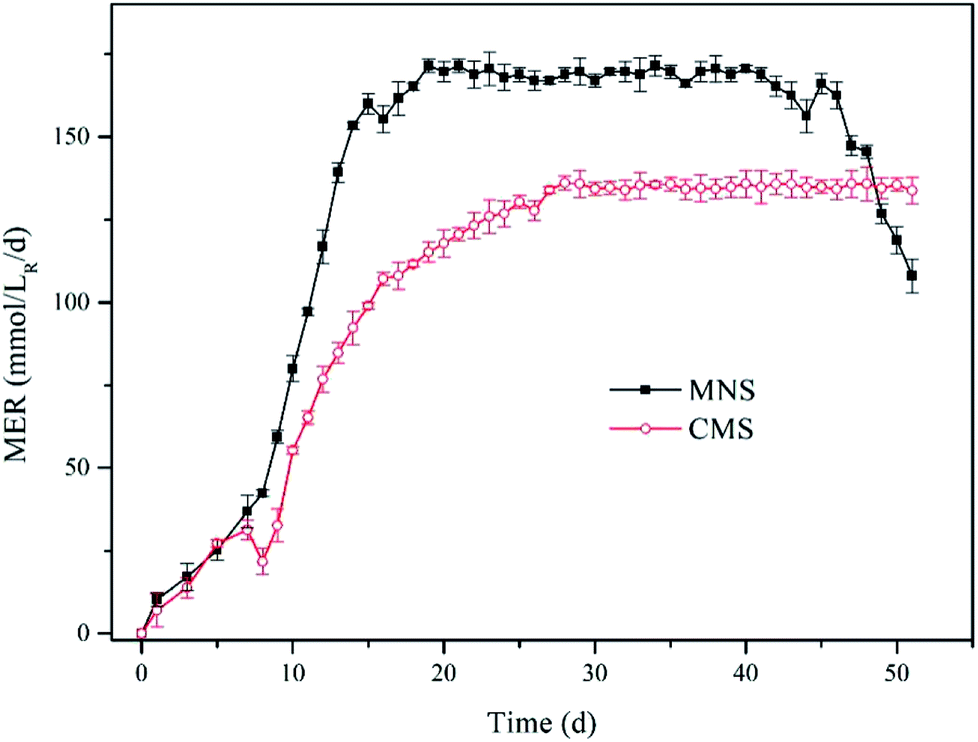
Methane production. To compare the effect of MNS and CMS on CH4 production, the MNS reactor (MNSR) and CMS reactor (CMSR) systems were established to produce CH4 from H2 and CO2. A start-up period was noticed in both reactors with a gradually increased methane production rate (Fig. 2), due to the adaption of methanogens to the new conditions. While the methane production trended to be stable from day 14 to day 45 with the maximum methane evaluation rate (MER) of 171.40 mmol/LR/d in the MNSR. Similarly, the stable phase in the CMSR was detected from day 27 to day 50, achieving the maximum MER of 136.10 mmol/LR/d. The enhancement of methane yield in the MNSR is significant with the p value lower than 0.05. The delayed achievement on the maximum MER in the CMSR was most probably attributed to its lower biomass growth rate. At the very beginning, both the aqueous substrates and the gaseous substrates were sufficient for the microbes, so that the microbial growth exhibited a rapid increase which agrees with the increase in methane production, the major product in this kind of systems. However, when the biomass increased to some extent, the dissolved hydrogen concentration (DHC) became the limiting factor for the microbes, leading to the maximum methane production maintained at a stable period. From day 46 to day 51, the MER of MNSR began to decrease gradually, as a result of the exhaustion of some nutrients in the medium. The results from this study indicate that MNSR can produce more CH4 than CMSR.
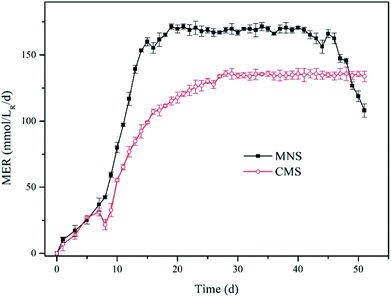 |
| | Fig. 2 Methane evolution rate (MER) for the two reactors. Solid squares denote MNSR and open circles denote CMSR. | |
The finding of this work is to some extent similar to that of Weimer & Zeikus36 who used Methanosarcina barkeri MS as the inoculum, achieving the MER of 5.539 mmol L−1 h in a 2 L reactor under fed-batch mode conditions. Their result is comparable to the MER of CMSR, while lower than that of MNSR. The current work is also comparable to Roennow & Gunnarsson37 who carried out the fed-batch experiments in a 1 L reactor. For recent studies, the methane production has been improved greatly by various methods. Lee et al.38 converted H2 and CO2 to methane by a fixed bed reactor with the mixed culture, and got the conclusion that the maximum methane production of 143.97 mol L−1 d−1, which is much higher than this study. The low methane yield in this study was closely related to the low feeding rate of gaseous substrates.
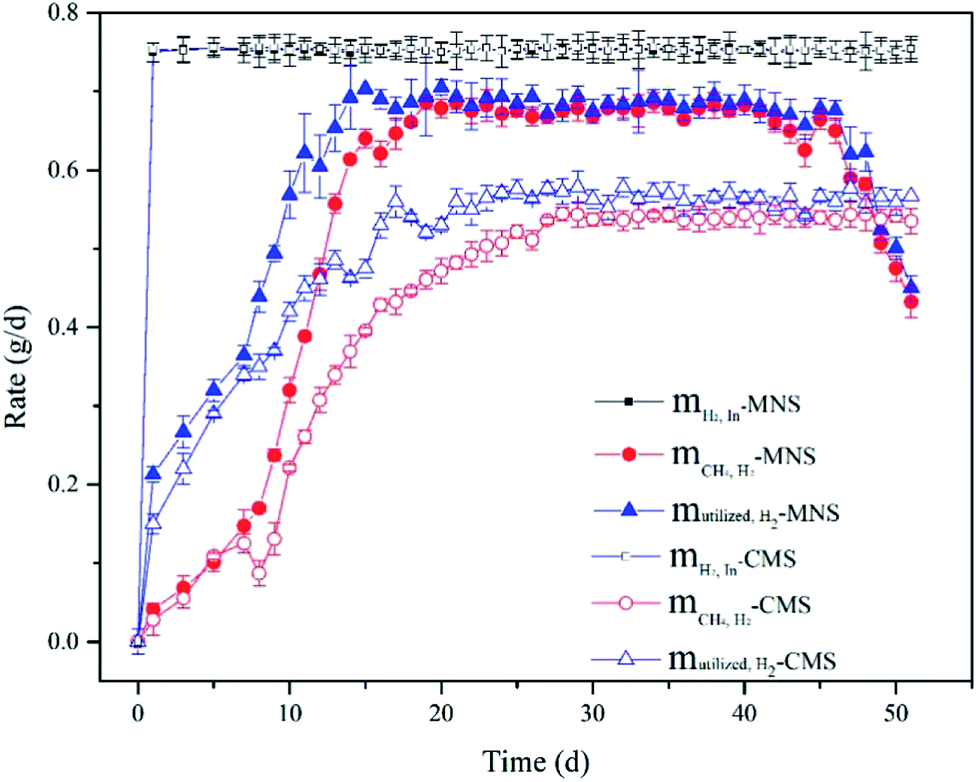
H2 utilization efficiency. In order to confirm that the enhancement on CH4 production by MNSR was brought about by improvement of kLa using MNBs, H2 balance analysis was used to investigate whether the bioconversion efficiency of H2 was stimulated by the MNBs or not. The utilized H2 concentration was calculated by eqn (5). As shown in Fig. 3, H2 was not exhausted in both MNSR and CMSR, due to the decreased dissolved H2 concentration along with operation time, resulting in weakened driving force for gas–liquid mass transfer. As the same trend with CH4 production, H2 consumption increased gradually, and then became stable for some period. The maximum H2 utilization in the MNSR was detected on day 20 with the maximum ηH2 of 95%. In comparison to MNSR, mH2,utl in the CSR was lower, correspondingly yielding to a lower maximum ηH2 of 80% (day 25). Albeit the methane yield in this study was low, the H2 utilization efficiency of MNS is high and comparable with other studies,20,38 indicating the smaller bubbles can be utilized effectively by the methanogens. This observation implies that MNS can transfer more H2 from gas phase into liquid phase during the same operation duration compared with CMS. An ideal condition for the bioconversion is that H2 could be transferred at a high rate without any accumulation. The maximum dissolved hydrogen concentration in the water is about 1.6 mg L−1 at normal pressure.39 While the utilized hydrogen concentration in the two reactors is much higher than 1.6 mg L−1, illustrating that H2 was consumed by the microbes. The H2 converted to CH4 (mCH4,H2) was lower than the utilized H2 concentration (mH2,utl), indicating that there could be a prior in biomass growth than CH4 production. From day 20 on, the mCH4,H2 in the MNSR contributed over 95% to the total utilization of H2, and maintained at this high proportion for about 20 days. The CH4 production in both reactors did not show a continuous increase, demonstrating the lack of dissolved hydrogen for methanogens. Specifically, the contribution of mCH4,H2 in the CMSR to mH2,utl was slightly lower (about 90%), indicating H2 was also engaged in VFAs production and biomass growth.
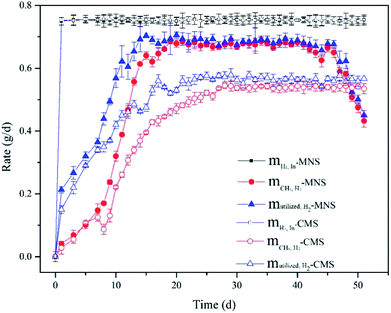 |
| | Fig. 3 H2 balance analysis for the two reactor systems. | |
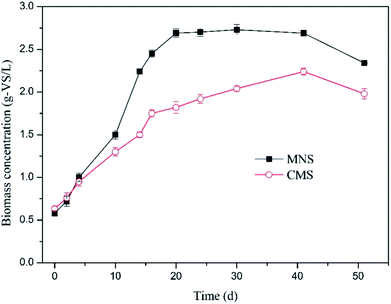
Biomass enrichment
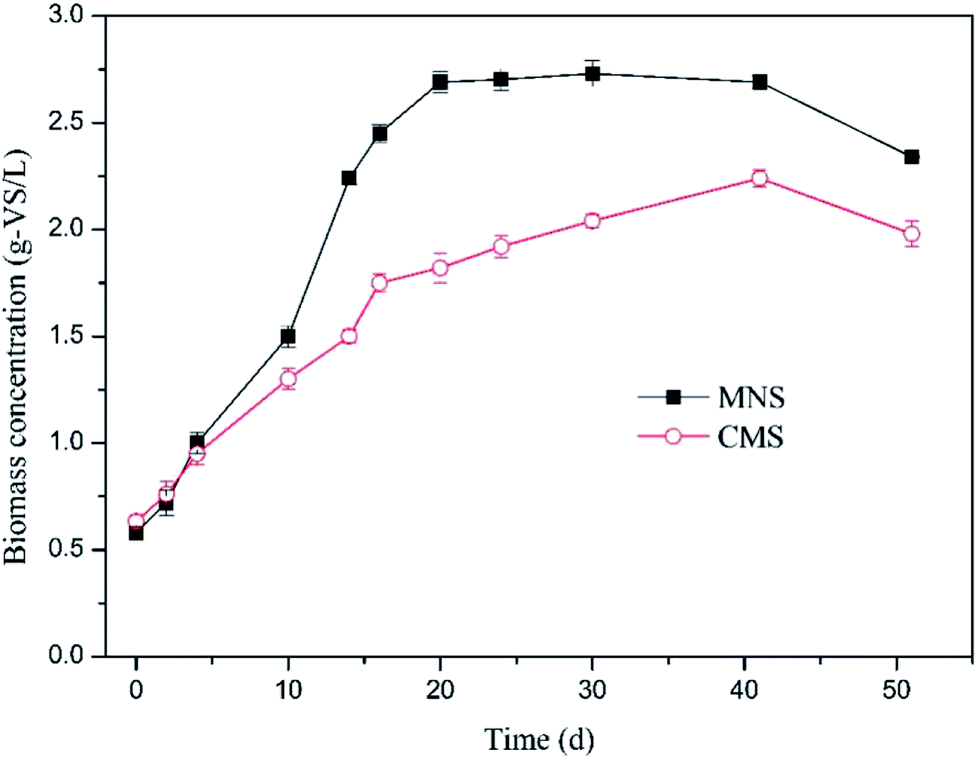
To determine the effect of MNBs on biomass growth, biomass concentration was quantified in time course (Fig. 4). The superiority of the MNSR was not obvious till day 5. After day 5 the MNSR experienced a rapid increase in biomass and earned a higher maximum specific growth rate of 0.15 d−1 in comparison to 0.09 d−1 in the CMSR. The methanogens in the two reactors were shown in Fig. S1.† Results suggest that methanogens use more dissolved H2 in MNSR due to its higher kLa. However, the biomass concentration showed a stable trend following the rapid growth period, demonstrating that the dissolved H2 concentration was still the limiting factor which dominates H2 utilization for catabolism reactions (CH4 production). The inocula used in this study was the acclimated anaerobic sludge, a mixed culture. Compared to the pure culture, generally the mixed culture is more advantageous regarding availability and cost, if not thinking about the relatively lower conversion rate due to the competitive communities. Moreover, the MNSR can be applied in large-scale tests according to the results from the acclimated anaerobic sludge.
 |
| | Fig. 4 Variation in biomass concentration in the two reactors. Solid squares denote MNSR and open circles denote CMSR. | |
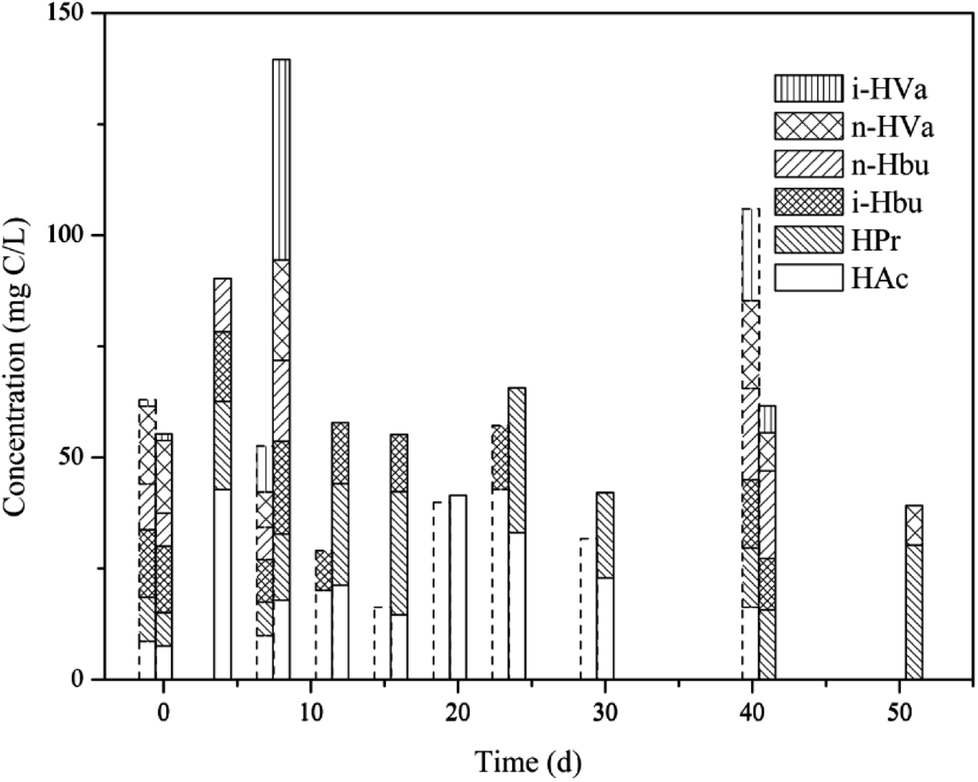
Variation in volatile fatty acids (VFAs)
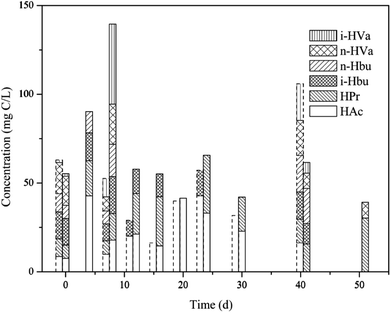
Anaerobic conversion of CO2 can support a variety of microorganisms from different trophic groups within a microbial community. Therefore, the pathways involved in CH4 production from CO2 become more complex when taking the mixed anaerobic consortium into consideration. For a mixed methanogenic culture, i.e. the acclimated anaerobic sludge used in this study, it is essential to consider all possible reactions that are involved in the conversion of CO2 to CH4. The possible pathways indicate that hydrogenotrophic methanogens can directly convert H2 and CO2 to CH4 through the pathway (a) (Fig. S2†). On the other hand, homoacetogenic bacteria can participate in the conversion of the H2 and CO2 to acetate, a thermodynamically favorable reaction (pathway (b)). Then the acetoclastic methanogenesis will occur according to the pathway (c). Conversely, syntrophic acetate-oxidizing (SAO) bacteria can convert acetate to H2 and CO2 (pathway (d)) when acetoclastic methanogenesis is deficient.40 The SAO reaction becomes thermodynamically favorable at low H2 partial pressure (<10−4 atm at 35 °C).41,42
As shown in Fig. 5, VFAs accumulation was not detectable in the MNSR during the first week. Then VFAs concentration increased with the increase in CH4 production. However, at the end of the experiments VFAs was not detectable in the MNSR, indicating that VFAs in this reactor experienced a production followed by consumption progress. It has been pointed out that a high dissolved H2 concentration inhibits propionate and butyrate conversion to acetate or H2 and CO2 during anaerobic digestion, yielding lower conversion rate or the whole process breakdown.20 Thus, a higher acetic acid concentration in the MNSR can be used for more CH4 production when compared to the CMSR, possibly contributed by the higher dissolved H2 concentration in the reactor.
 |
| | Fig. 5 VFAs variations in the two reactors (dashed line: MNSR; solid line: CMSR). | |
From the whole process, the concentration of total VFAs in the MNSR was lower than that in the CMSR, indicating more substrates were converted into CH4. Meanwhile in the CMSR, VFAs accumulation was detected at the beginning of experiment. From day 12, the total VFAs concentration decreased while maintained at a relatively stable level, reflecting that VFAs consumption in the CMSR was not so efficient.
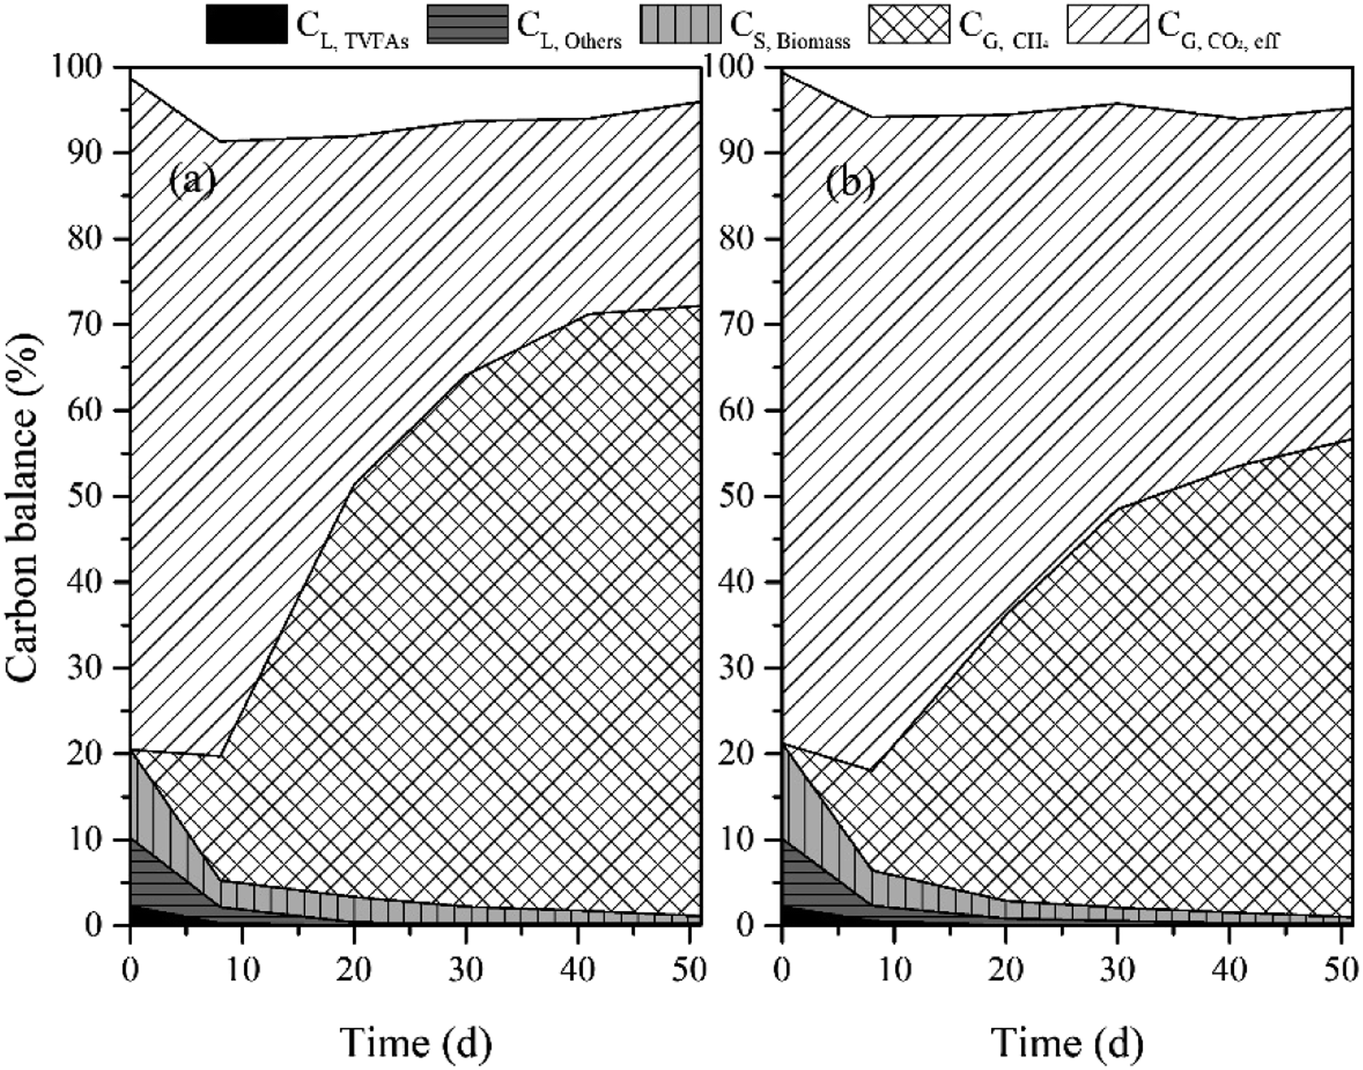
Carbon mass balance analysis
To evaluate carbon conversion efficiency in the reactors, carbon elements in the liquid, solid and gaseous phases were quantified as illustrated in Fig. 6. The C content in biomass was estimated according to a theoretical formula (C60H87N12O23P) for microbes. In addition, the calculation of CL,TVFAs was based on the individual VFA. During the whole experiments, except for the initial carbon in the biomass and medium, the carbon input is only from CO2 in the gas phase. The carbon balance was analyzed according to eqn (8). Being consistent with the results from above two sections, a relatively more carbon conversion into the solid phase (CS,Biomass) was achieved in the MNSR in comparison to the CMSR. And the final biomass yield in the MNSR was 2.34 g-biomass per L, which was 1.98 g-biomass per L in the CMSR. Anyhow, the liquid phase carbon percentage gradually was found to decrease to a low level in both reactors, which might be utilized as a source for biomass growth. Considering the gaseous phase carbon fractions, CG,CH4 in the two reactors showed a remarkable difference. Still, a considerable part of CO2 (CG,CO2,Rest) was remained in both systems. Seen from the whole conversion process, the input CO2 tended to be employed for microbial growth first, and then the CG,CH4 increased with the increase in biomass growth.
 |
| | Fig. 6 Carbon balance analysis for MNSR (a) and CMSR (b). | |
Energy consumption
The economic and practical feasibility of this enhancement approach should be evaluated for its applications in large scale fermentation systems. MNS clearly has a significant stimulation potential for hydrogenotrophic methanogenesis. Enrichment of methanogens in the MNSR provides a greater H2-bioconversion potential than in the CMSR, suggesting that the gas–liquid mass transfer limitation is minimized. However, the advantage could be mitigated by high energy consumption. In this context, energy consumption analysis is essential for both the MNSR and CMSR. Table 1 summarizes the results relating to the energy consumptions by the MNSR and CMSR according to eqn (11) and (12).
Table 1 Energy consumption for the two reactor systems
| Reactor |
Epump (W) |
Estirrer (W) |
Econsumed (W) |
R (L kW−1) |
| MNSR |
2.80 × 10⁴ |
1.59 × 10⁴ |
4.39 × 10⁴ |
1.80 |
| CMSR |
2.69 × 10⁴ |
1.39 × 10⁴ |
4.08 × 10⁴ |
1.45 |
As shown in Table 1, both the work of pump (Epump) and stirrer (Estirrer) in the MNSR were higher than those in the CMSR, leading to the higher energy consumption in the MNSR system. However, when evaluating the technology, the product value (CH4 in this work) also should be taken into account. In this work, the energy-product ratio (R) was employed to represent the potential for practical application. As for the MNSR, although a higher CH4 yield is corresponding to a higher energy consumption, its R value is still higher than the that for the CMSR, demonstrating its great potential for scaling-up application. In fact, continuous-type reactors dominate the industrial scale fermentation systems, and the methane yield can also be improved by increasing the gas recirculation rate. As proposed by Szuhaj et al.,13 the energy for H2 production could be supplied by the renewable resources such as the wind or solar energy. In this case, the application of MNSR for bioconversion of H2 and CO2 is more meaningful.
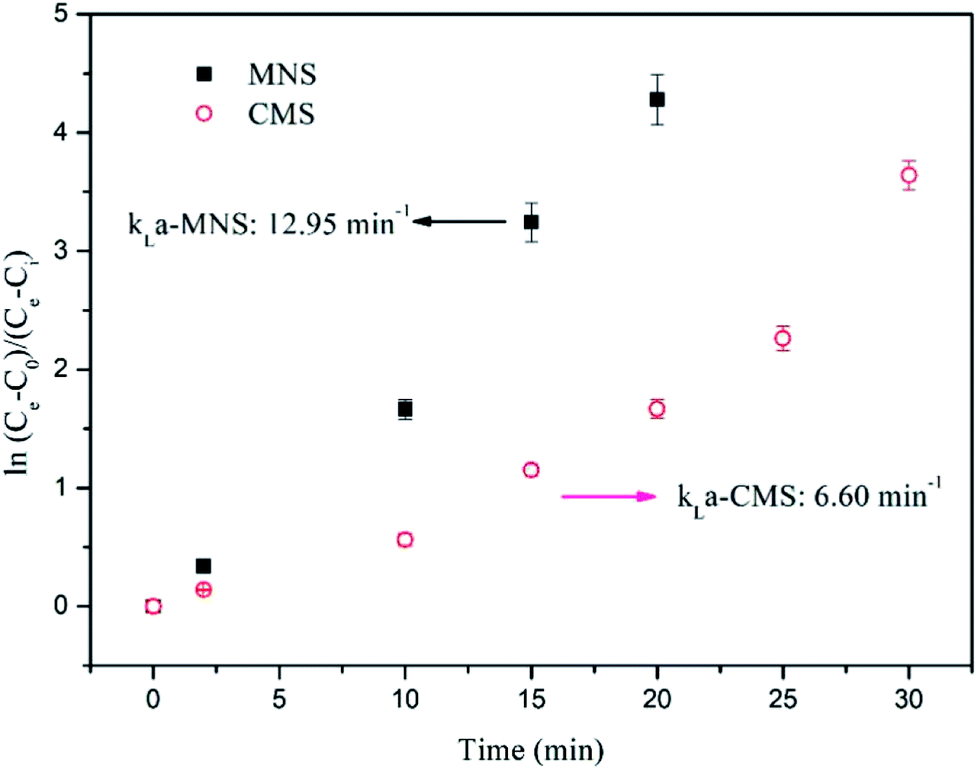
Gas–liquid mass transfer evaluation
In order to find out the reason for the enhancement effect by MNS, the H2 gas–liquid mass transfer was evaluated based on the dissolved H2 concentration. Gas mass transfer in the two reactors occurs in two zones. Gas transfer in the headspace happens through a very thin liquid boundary layer between the bulk gas and the culture cells. The mass transfer in the liquid phase is characterized through quantification of the volumetric coefficient (kLa). Vega et al.43 have described the multiple steps when mass transfer occurs from gas to liquid phases, which involve (1) the absorption of a gaseous substrate across the gas–liquid interface, (2) the transfer of the dissolved gas to the fermentation media, and (3) diffusion through the culture media to the cell surface. And the most sparingly soluble gases utilized in the biochemical reactions trigger the major resistance in the liquid film around the gas–liquid interface.44,45
Because during the batch bioconversion experiments, the kLa value was continuously varying, the kLa in this study was evaluated before incubation by analyzing the dissolved H2 concentration in the liquid. As shown in Fig. 7, the kLa value in the MNSR (12.95 h−1) is almost twice that in the CMSR (6.6 h−1), most probably due to the increase in specific surface area because of much smaller bubble size.
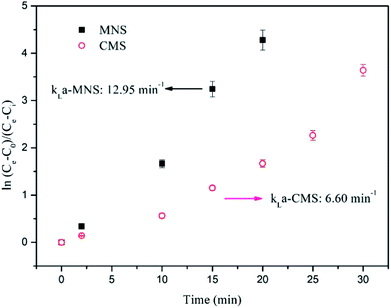 |
| | Fig. 7 Determination of kLa-H2 from dissolved H2 concentration data. Solid squares denote MNSR and open circles denote CMSR. | |
The specific surface area to liquid volume ratio was calculated by according to both the micro-scale and nano-scale bubble size distribution in the two reactors (Fig. S3†). The average bubble size in the CMSR and MNSR was determined as about 845 μm and 220 μm, respectively, corresponding to the total surface area to liquid volume of 5640 cm2/LR, and 48042 cm2/LR. This specific surface area has been increased by one order of magnitude, implying more sufficient contact chance between methanogens and the gaseous substrates.
Results show the significant difference in the kLa value of MNSR and CMSR. There are several parameters, which have an influence on the kLa in a reactor. Rittman et al.16 (2015) demonstrated that at a given reactor configuration, agitation, stirrer types, gas flow rate, gas-limitation fundamentals and the sparger type are the most relevant. The kLa-H2 in different studies were summarized in Table 2. Nielsen et al.46 proposed that CSTR was the most used reactor configuration for bioconversion of H2 and CO2 to CH4 by 2011, due to the effective gas–liquid mass transfer in the CSTR. In the study of Bassani et al.,26 the effect of sparger type on kLa value was not very significant, but gas recirculation rate affected the bioconversion significantly. While, in this study, the sparger type is still an important factor. The smaller pore size lead to the higher kLa value with the assistance by magnetic stirrers to provide sufficient mixing. However, the kLa obtained from this study is much lower than that from Bassani et al.,26 possibly resulted from the lower recirculation rate applied in this study (40 mL min−1). Therefore, the subsequent experiments will be carried out to optimize the kLa value taking higher recirculation rate and higher temperature into consideration. In a summary, these results demonstrate that kLa is a key factor for the enhanced CH4 production from the MNSR.
Table 2 Comparison in kLa value among different biogas methanation systems
| Bioreactor features |
Sparger pore size |
Working volume (L) |
Cultivation modes |
Inoculum |
Temp. (°C) |
kLa (h−1) |
Reference |
| CSTR |
0.5–1.0 mm/14–40 μm |
0.6 |
Chemostat |
Digested manure |
55 |
6.6–16.05 |
Luo and Angelidaki, 2013 |
| UBF |
5 μm |
19.3 |
Chemostat |
Anaerobic granules |
36 ± 2 |
0.72–20.86 |
Frigon and Guiot, 1995 |
| CSTR |
— |
3.07–13.4 |
Fed-batch |
Anaerobic sludge |
32–35 |
0.06–0.16 |
Pauss et al., 1990 |
| UASB |
0.5 μm/2 μm |
0.85 |
Chemostat |
Hydrogenotrophic methanogens |
55 |
240–776 |
Bassani et al., 2017 |
| CSTR |
0.2 μm-MNS/845 μm-CMS |
0.5 |
Fed-batch |
Anaerobic sludge |
37 |
12.95-MNS/6.60-CMS |
This study |
Conclusions
The enhanced bioconversion of H2 and CO2 to CH4 was realized by using the MNS. The maximum MER of 171.4 mmol/LR/d in the MNSR is much higher than that in the CMSR (136.1 mmol/LR/d). The MNSR also displayed superior biomass growth with specific growth rate of 0.15 d−1 than that of CMSR. The VFAs accumulation was not detectable in MNSR. Higher gas–liquid mass transfer was achieved in the MNSR than that in the CMSR. A higher energy-product ratio and economic analysis indicates that MNS has applicable potential for improvement of CO2 and H2 conversion into CH4 in large-scale plants.
Conflicts of interest
There are no conflicts to declare.
Acknowledgements
This work was financially supported by JFE steel cooperation. The first author acknowledges the support of the China Scholarship Council (No. 201506400049).
References
- G. J. Francisco, A. Chakama and X. Feng, Sep. Purif. Technol., 2010, 75, 205–213 CrossRef.
- Greenhouse Gas Inventory Office of Japan (GIO), 2017, ch. 2, pp. 3–6.
- U. E. Aronu, H. F. Svendsen and K. A. Hoff, Int. J. Greenhouse Gas Control, 2010, 4, 771–775 CrossRef.
- A. Sayari, Y. Belmabkhout and R. Serna-Guerrero, Chem. Eng. J., 2010, 171, 760–774 CrossRef.
- G. Xu, F. Liang, Y. Yang, Y. Hu, K. Zhang and W. Liu, Energies, 2014, 7, 3484–3502 CrossRef.
- Y. Zee, L. C. Thiam, W. Z. Peng, R. M. Abdul and S. Chai, J. Porous Mater., 2013, 20, 1457–1475 CrossRef.
- B. Pau, P. Sebastia, G. Rafael, D. Maria and C. Jesus, J. Chem. Technol. Biotechnol., 2016, 91, 921–927 CrossRef.
- M. C. A. A. van Eerten-Jansen, N. C. Jansen, C. M. Plugge, V. Wilde, C. J. N. Buisman and A. T. Heijne, J. Chem. Technol. Biotechnol., 2015, 90, 963–970 CrossRef.
- M. Burkhardt and G. Busch, Appl. Energy, 2013, 111, 74–79 CrossRef.
- M. K. Lam, K. T. Lee and A. R. Mohamed, Int. J. Greenhouse Gas Control, 2012, 10, 456–469 CrossRef.
- H. S. Jee, N. Nishio and S. Nagai, J. Ferment. Technol., 1988, 66, 235–238 CrossRef.
- D. Ju, J. Shin, H. Lee and S. Kong, Desalination, 2008, 234, 409–415 CrossRef.
- M. Szuhaj, N. Acs, R. Tengolics, A. Bodor, G. Rakhely and K. L. Kovacs, Biotechnol. Biofuels, 2016, 9, 102 CrossRef PubMed.
- S. K. Hoekman, A. Broch, C. Robbins and R. Purcell, Int. J. Greenhouse Gas Control, 2010, 4, 44–50 CrossRef.
- M. D. Redwood, R. L. Orozco, A. J. Majewski and L. E. Macaskie, Bioresour. Technol., 2012, 107, 166–174 CrossRef PubMed.
- S. Rittmann, A. Seifert and C. Herwig, Crit. Rev. Biotechnol., 2015, 35, 141–151 CrossRef PubMed.
- N. Nishimura, S. Kitaura, A. Mimura and Y. Takahara, J. Ferment. Bioeng., 1991, 72, 280–284 CrossRef.
- I. Bassani, P. G. Kougias, L. Treu and I. Angelidaki, Environ. Sci. Technol., 2015, 49, 12585–12593 CrossRef PubMed.
- I. Bassani, P. G. Kougias and I. Angelidaki, Bioresour. Technol., 2016, 221, 485–491 CrossRef PubMed.
- I. Diaz, C. Perez, N. Alfaro and F. Fdz-Polanco, Bioresour. Technol., 2015, 185, 246–253 CrossRef PubMed.
- D. Cheng, J. Cheng, X. Li, X. Wang, C. Yang and Z. Mao, Chem. Eng. Sci., 2012, 75, 256–266 CrossRef.
- S. R. Guiot, R. Cimpoia and G. Carayon, Environ. Sci. Technol., 2011, 45, 2006–2012 CrossRef PubMed.
- G. Luo and I. Angelidaki, Appl. Microbiol. Biotechnol., 2013, 97, 1373–1381 CrossRef PubMed.
- S. Zhang, D. Wang, F. Bu, X. Zhang and P. Fan, Surf. Interface Anal., 2013, 45, 1152–1157 CrossRef.
- P. G. Kougias, L. Treu, D. P. Benavente, K. Boe, S. Campanaro and I. Angelidaki, Bioresour. Technol., 2017, 225, 429–437 CrossRef PubMed.
- I. Bassani, P. G. Kougias, L. Treu, H. Porte, S. Campanaro and I. Angelidaki, Bioresour. Technol., 2017, 234, 310–319 CrossRef PubMed.
- A. J. Dixon, A. H. Dhanaliwala, J. L. Chen and J. A. Hossack, Ultrasound Med. Biol., 2013, 39, 1267–1276 CrossRef PubMed.
- F. Kobayashi, H. Ikeura, M. Tamaki and Y. Hayata, Southeast Asia Symposium on Quality and Safety of Fresh and Fresh-cut Produce, 2010, 875, pp. 417–424 Search PubMed.
- K. Kugino, S. Tamaru, Y. Hisatomi and T. Sakaguchi, PLoS One, 2016, 11, 1–9 CrossRef PubMed.
- A. Agarwal, W. J. Ng and Y. Liu, Chemosphere, 2011, 84, 1175–1180 CrossRef PubMed.
- F. Ushikubo, T. Furukawa, R. Nakagawa, M. Enari, Y. Makino, Y. Kawagoe, T. Shiina and S. Oshita, Colloids Surf., A, 2010, 361, 31–37 CrossRef.
- Z. Zhang and T. Maekawa, Biomass Bioenergy, 1993, 4, 439–446 CrossRef.
- APHA, American Public Health Association/American Water Work Association/Water Environment Federation, Washington, DC, 21st edn, 2005 Search PubMed.
- W. Huang, W. Huang, T. Yuan, Z. Zhao, W. Cai, Z. Zhang, Z. Lei and C. Feng, Water Res., 2016, 90, 344–353 CrossRef PubMed.
- P. Tsapekos, P. G. Kougias, L. Treu, S. Campanaro and I. Angelidaki, Appl. Energy, 2016, 185, 126–135 CrossRef.
- P. J. Weimer and J. G. Zeikus, Arch. Microbiol., 1978, 119, 49–57 CrossRef PubMed.
- P. H. Roennow and L. A. H. Gunnarsson, FEMS Microbiol. Lett., 1982, 14, 311–315 CrossRef.
- J. Lee, J. Kim, W. Chang and D. Pak, J. Chem. Technol. Biotechnol., 2012, 87, 844–847 CrossRef.
- P. C. Munasinghe and S. K. Khanal, RSC Adv., 2014, 4, 37575–37581 RSC.
- D. Karakashev, D. J. Batstone, E. Trably and I. Angelidaki, Appl. Environ. Microbiol., 2006, 72, 5138–5141 CrossRef PubMed.
- M. J. Lee and S. H. Zinder, Appl. Environ. Microbiol., 1988, 54, 1457–1461 Search PubMed.
- R. Cord-Ruwisch, D. R. Lovley and B. Schink, Appl. Environ. Microbiol., 1998, 64, 2232–2236 Search PubMed.
- J. L. Vega, E. C. Clausen and J. L. Gaddy, Biotechnol. Bioeng., 1989, 34, 774–784 CrossRef PubMed.
- K. T. Klasson, C. M. D. Ackerson, E. C. Clausen and J. L. Gaddy, Int. J. Hydrogen Energy, 1992, 17, 281–288 CrossRef.
- P. C. Munasinghe and S. K. Khanal, Biotechnol. Prog., 2010, 26, 1616–1621 CrossRef PubMed.
- J. Nielsen, J. Villadsen, and G. Liden, Bioreaction engineering principles, Springer, New York, 2011, ch. 9, pp. 383–458 Search PubMed.
Footnote |
| † Electronic supplementary information (ESI) available. See DOI: 10.1039/c8ra02924e |
|
| This journal is © The Royal Society of Chemistry 2018 |
Click here to see how this site uses Cookies. View our privacy policy here. 
 Open Access Article
 This Open Access Article is licensed under a Creative Commons Attribution-Non Commercial 3.0 Unported Licence
 *a,
Ikuhiro Sumib,
Yasuko Yaob and
Yasuhiro Mogib
*a,
Ikuhiro Sumib,
Yasuko Yaob and
Yasuhiro Mogib

 is the sum of the mass utilized by the microbes and the mass left (effluent) in the system, the H2 conversion efficiency (%) was calculated according to eqn (4),
 is the mass flow rate of H2 fed into the reactor per day and
 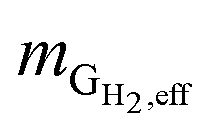 is the mass flow rate of H2 in the effluent gas. The utilized H2
 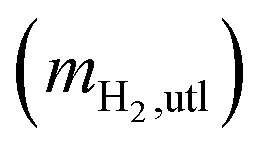 was the difference between
 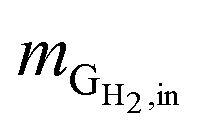 and
and  , as shown in eqn (5):