
 Open Access Article
 This Open Access Article is licensed under a Creative Commons Attribution-Non Commercial 3.0 Unported Licence
Highly sensitive sensing of hydroquinone and catechol based on β-cyclodextrin-modified carbon dots†
Zhong-Yi Lina,
Yuan-Chieh Kuoa,
Chih-Jui Changc,
Yu-Syuan Lina,
Tai-Chia Chiu ab and
Cho-Chun Hu*ab
ab and
Cho-Chun Hu*ab
aDepartment of Applied Science, National Taitung University, Taitung, 95002, Taiwan. E-mail: cchu@nttu.edu.tw
bAgriculture Products Inspection Center, National Taitung University, Taitung, 95002, Taiwan
cDepartment of Molecular Biology and Human Genetics, Tzu Chi University, Hualien 97004, Taiwan
First published on 25th May 2018
Abstract
In the proposed study, an efficient method for a carbon dot@β-cyclodextrin (C-dot@β-CD)-based fluorescent probe was developed for the analyses of catechol (CC) and hydroquinone (HQ) at trace levels in water samples. The properties of C-dot@β-CD nanocomposites were characterized by Fourier transform infrared spectroscopy (FTIR), transmission electron microscopy (TEM) and X-ray photoelectron spectroscopy (XPS). The sensing behaviors of C-dot@β-CD toward CC and HQ were investigated by fluorescence spectroscopy. Based on the host–guest chemistry between C-dot@β-CD and phenolic compounds, which can quench C-dot@β-CD fluorescence, the prepared C-dot@β-CD nanocomposites could be used for the sensitive and selective detection of CC or HQ across a wide linear range (0.1 to 10 μM) with detection limits of 47.9 and 20.2 nM, respectively. These results showed that the synthesized C-dot@β-CD nanocomposite exhibited strong fluorescence and high degree of water solubility and thus, it is suitable for use as a nanoprobe for detecting CC or HQ in real water samples.
Introduction
Catechol (1,2-dihydroxybenzene, CC) and hydroquinone (1,4-dihydroxybenzene, HQ) are two positional isomers of phenolic compounds. They are usually found in aquatic environments owing to their widespread use in photography chemicals, secondary coloring materials, medicines, pesticides, flavoring compounds, and cosmetics.1,2 However, they are highly toxic to the environment and humans even at very low concentrations.3 The United States Environmental Protection Agency and the European Union have found them to be harmful to the environment owing to their biohazard status and low degradability in ecological environments.4,5 Various analytical methods including electrochemical methods6,7, spectrophotometry,8 chemiluminescence,9 capillary electrochromatography,10 flow-injection analysis,11 high-performance liquid chromatography,12 and gas chromatography/mass spectrometry13 have been established for their determination. However, these methods are cost- and time-intensive options for detecting CC and HQ.Recently, numerous nanosensors or nanoprobes have been developed for the determination of organic molecules or metal ions. For example, both TiO2 NPs14 and 4-carboxyphenylboronic acid-functionalized C-dots (CPBA-C-dots)15 were used to detect catechol using the fluorescence quenching method. Graphene quantum dots (GQDs) based on a peroxidase-mimicking catalyst were used for the detection of hydroquinone.16 Clearly, nanoprobes are more preferable for the detection of CC or HQ, as they have the advantages of low cost, high sensitivity, excellent selectivity simplicity, rapid response and cost-effective equipment.
Cyclodextrin is commonly used as a good selector due to its unique molecular structure, nontoxicity, low cost, bioavailability,17–21 and versatile chemical and physical properties.22 A previous study reported that β-cyclodextrin-glutathione-capped CdSe/ZnS QDs could be used to detect phenylalanine and tyrosine enantiomers through fluorescence resonance energy transfer (FRET).23 Additionally, Fe3O4@SiO2(FITC)-FA/CMCD NPs with highly uniform and monodispersed multifunctional magnetic properties have been used to study bioimaging, cell-targeting and drug delivery.24 Gold nanoparticle-doped Pb(II)-β-cyclodextrin (Pb-β-CD) metal–organic based on electrochemiluminescence (ECL) resonance energy transfer (RET) system was developed for the determination of insulin.25
As nanomaterials, C-dots have become popular green material due to their photostability, high degrees of water solubility and plasticity, low toxicity, and good biocompatibility.26,27 Because of these attractive merits, C-dots have been widely used in bioimaging,28,29 optoelectronic devices, drug release, and fluorescence sensors.30–32 The carbon dots synthesized with terbium(III) nitrate pentahydrate and citric acid have been used to detect trinitrotoluene,33 and a new fluorescent probe for Cu2+ detection based on the quenching of the fluorescence of C-dot-BSA-lysozyme has been designed.34 Moreover, applications of C-dots in the fluorescent sensing of cations, anions, and organic compounds have also been widely reported. Therefore, C-dots can be considered as good candidates for developing rapid and sensitive sensors.
Herein, we describe the development of C-dot@β-cyclodextrin (β-CD) for the detection of CC and HQ through the host–guest recognition of β-CD and fluorescence quenching of the C-dots. Based on the host–guest chemistry, the analytes can enter β-CD cavities to form stable host–guest complexes, thus resulting in C-dot@β-CD fluorescence quenching. Our results show that the fluorescent response of this nanoprobe toward CC and HQ is highly sensitive and selective. To the best of our knowledge, few reports have focused on the use of hydrothermal C-dots through the fluorescence method for the detection of CC and HQ.
Experimental
Materials
Hydroquinone (1,4-dihydroxybenzene), catechol (1,2-dihydroxybenzene), sodium hydroxide (NaOH), hydrogen peroxide solution (H2O2), methanol (MeOH) and metal ions were obtained from Sigma-Aldrich (St. Louis, MO, USA). β-Cyclodextrin (β-CD) and Rhodamine B were purchased from TCI (Tokyo Chemical Industry). p-Toluenesulfonyl chloride (TsCl) was obtained from ACROS Organics. Acetonitrile (ACN) was purchased from Merck (Darmstadt, Germany). All chemicals were of analytical grade and used without further purification. Ultrapure water was obtained from the Milli-Q ultrapure system. The lake water sample was obtained from a lake on the campus of National Taitung University.Instrumentation
UV-vis absorption spectra were obtained using a Lambda EZ210 UV-vis spectrophotometer (Perkin Elmer, USA). Fluorescence spectra were obtained using an F-7000 Fluorescence Spectrophotometer (Hitachi, Japan). The excitation and emission slits were both maintained at 5.0 nm and 5.0 nm. Versatile disc fluorescence/absorption spectra were recorded on Infinite 200 PRO (Tecan, USA). The morphology and mean diameter of C-dot@β-CD were obtained using a transmission electron microscope (TEM, JEM-2100, Hitachi, Japan). X-ray photoelectron spectroscopy (XPS) was conducted using an X-ray photoelectron spectroscope (K-Alpha, Thermo, USA). Cyclic voltammetry was carried out on the CHI624A electrochemical system (Chenhua Instrument, USA). Cyclic voltammograms were measured using an electrochemical workstation (Chenhua Instrument CHI624A, USA) with a conventional three-electrode system including a glassy carbon electrode as the working electrode. Ag/AgCl and platinum wire were used as the reference electrode and counter electrode, respectively.35Synthesis of C-dot@β-CD
We developed a strategy according to the previously reported method with minor modifications to obtain the amine group on the carbon dot surface.36 Carbon dots were obtained via the hydrothermal method. In detail, 0.72 g of citric acid was dissolved in a mixed solution containing 1.2 mL of ethylenediamine and 15 mL ultra-pure water to form a clear solution. The solution was heated for 8 h at 240 °C in a polytetrafluoroethylene autoclave and cooled to room temperature. Then, the solution was transferred to a dialysis bag (3500 Da) and kept for over 24 h to obtain the C-dot solution.According to the previously reported procedure,37 a solution of TsCl (2.9 g, 0.015 mol L−1) in acetonitrile (11 mL) was added dropwise to a solution of β-CD (17.22 g, 0.015 mol) in 1% NaOH aqueous solution (200 mL), and the mixture was gently stirred; a large quantity of precipitates was obtained. Then, the solution was continuously stirred for 2 h at room temperature and filtered to obtain a white precipitate. The filtrate was acidified to pH 2–3 with 1.0 mol L−1 HCl, and it was kept overnight at 4 °C. Finally, a white solid of mono-6-OTs-β-CD was precipitated.
Aqueous solutions of C-dots (7 mg mL−1) and mono-6-OTs-β-CD (in different volume ratios) were added, and the final volume of the mixture was 10 mL. The pH of the solution was adjusted to 12 with 1.0 mol L−1 NaOH. The mixture was aged for 2 h to form C-dot@β-CD. Then, the solution was transferred to a dialysis bag (3500 Da). The dialysis of the solution lasted over 24 h and finally, C-dot@β-CD solution was obtained (2.4 mg mL−1).
Determination of hydroquinone and catechol
To investigate the sensitivity towards hydroquinone and catechol, 200 μL hydroquinone or catechol, 200 μL C-dot@β-CD, and 1400 μL H2O were placed in cuvettes. Afterwards, the mixtures were incubated for 30 min at room temperature. The solution was then thoroughly mixed, and the fluorescence intensity was quantified.The water sample was centrifuged at 12![[thin space (1/6-em)]](https://www.rsc.org/images/entities/char_2009.gif) 000 rpm for 30 min and filtered through 0.22 μm membranes. Typically, 200 μL hydroquinone or catechol, 200 μL water sample, 200 μL C-dot@β-CD, and 1200 μL H2O were placed in cuvettes. Afterwards, the mixtures were incubated for 30 min at room temperature. Their fluorescence spectra were recorded in the 200–900 nm emission wavelength range and at the excitation wavelength of 350 nm.
000 rpm for 30 min and filtered through 0.22 μm membranes. Typically, 200 μL hydroquinone or catechol, 200 μL water sample, 200 μL C-dot@β-CD, and 1200 μL H2O were placed in cuvettes. Afterwards, the mixtures were incubated for 30 min at room temperature. Their fluorescence spectra were recorded in the 200–900 nm emission wavelength range and at the excitation wavelength of 350 nm.
Cell viability assay
Cell viability was determined by an MTT cell proliferation/viability assay. Human cervical cancer cells (HeLa) were cultured in a 96-well plate in the DMEM medium supplemented with 10% fetal bovine serum (Hyclone; Logan, UT, USA) at 37 °C for 16 hours. After 16 hour incubation to allow cell attachment, the cells were treated with various concentrations of C-dot@β-CD (1.4, 0.7, 0.47, and 0.35 mg mL−1) and incubated at 37 °C and then, they were harvested at different time points. The test solutions were removed and replaced with culture medium containing 5 mg mL−1 of MTT (thiazolyl blue formazan, Sigma, Taiwan) for an additional 4 hours. The supernatant was aspirated, and 200 μL of DMSO was added to a well to dissolve the precipitate; optical density (OD) values were then measured using an ELISA reader (Sunrise, Tecan, Switzerland) at a wavelength of 570 nm. Absorbance values were used to calculate the % viability of the cells relative to that of the control.Results and discussion
Synthesis and characterization of the C-dot@β-CD nanocomposites
As shown in Scheme 1, C-dots were synthesized using citric acid and ethylenediamine. β-CD was first derivatized with TsCl to form mono-6-OTs-β-CD. Then, it was used to react with the C-dots to synthesize C-dot@β-CDs. C-dot@β-CDs were synthesized with mono-6-OTs-β-CD (15 mM) and C-dots (7 mg mL−1) at various volumetric ratios: 3:1, 4:1, 6:1, 9:1 and 12:1. Fig. S1† shows the fluorescence spectra of these C-dot@β-CDs. The highest fluorescence intensity was observed at 4:1 volumetric ratio of mono-6-OTs-β-CD to C-dot. Fig. S2† depicts the fluorescence spectra of C-dot@β-CDs based on different incubation times (2, 4, 6 and 8 h) under the same experimental conditions. Our results indicated that after 2 hour incubation, the sample showed the strongest fluorescence intensity at 448 nm; this was likely due to the reaction between mesylate ester groups of β-CD and amine groups of C-dots under these optimized experimental conditions and consequently, the synthesized C-dot@β-CD had the highest fluorescence intensity.
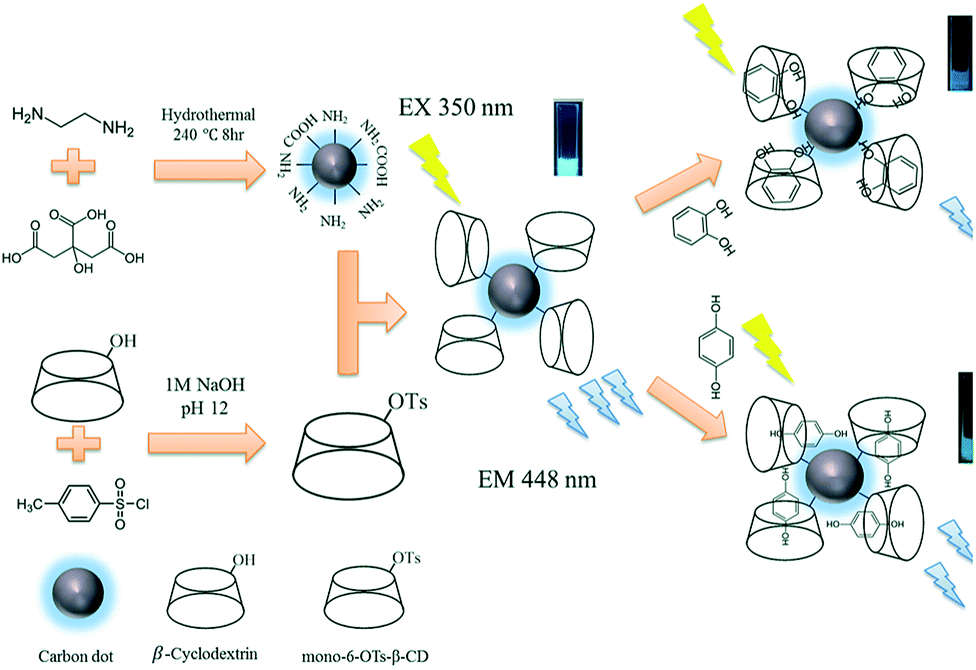 | ||
| Scheme 1 Schematic representation of the fabrication of C-dot@β-CD and illustration of the proposed nanosensor. | ||
The size of the synthesized C-dot@β-CD was characterized with transmission electron microscopy (TEM), as shown in Fig. 1A. The prepared C-dot@β-CDs were nearly uniform in size (∼1.97 nm), with narrow size distribution (≥10 nm) and spherical morphology. The properties of C-dot@β-CD were further characterized using fluorescence spectroscopy. Fig. 1B exhibits the presence of similar excitation-dependent photoluminescence behaviors. This excitation-dependent photoluminescence behavior has been extensively reported for fluorescent carbon-based nanomaterials, which possibly results from the optical selection of C-dots having different sizes and surface defects of C-dots.38 As shown in Fig. 1C, the obtained C-dots exhibited a characteristic transmittance band for O–H stretching vibrations at 3480 cm−1, and the peak near 1551 cm−1 was attributed to the bending of N–H bonds.39,40 Additionally, the peaks at 2925 cm−1 and 2852 cm−1 were assigned to the stretching of C–H bonds, and the peak at 1648 cm−1 represented the vibrational transmittance band of C–O bonds.41,42 The Fourier transform infrared (FTIR) spectra of C-dot@β-CD also showed transmittance bands at 3430 cm−1 and 1648 cm−1. The nucleophilic substitution reaction proceeded easily because mesylate ester is a good leaving group, and this resulted in a weak amine-group peak in the C-dot@β-CD FTIR spectra. These results confirmed that the C-dots were successfully functionalized by β-CD.
 | ||
| Fig. 1 (A) TEM image of C-dot@β-CD. (B) The excitation-dependent behaviors of C-dot@β-CD. (C) FTIR spectra of C-dot (black) and C-dot@β-CD (red). (D) Cyclic voltammograms of (black) C-dot, (red) C-dot@β-CD and (blue) 1 M KNO3, potential range of −0.8–0.8 V versus Ag/AgCl (potential scan rate, 50 mV s−1). | ||
To investigate the electrochemical behaviors of C-dots and C-dot@β-CDs, we compared their cyclic voltammograms (Fig. 1D), and we found no clear redox peaks in the potential range of −0.8 V to 0.8 V. The results suggested that both of these C-dots were chemically stable. The FTIR assignments were further verified by XPS analysis. Fig. 2 reveals that C-dot@β-CD mainly consisted of carbon and oxygen with a peak at about 285 eV for C 1s and a peak at about 532 eV for O 1s.43 The C 1s spectra (Fig. 2B) showed three peaks at 284.6 eV, 285.9 eV and 287.9 eV, which were ascribed to C–C, C–O and C![[double bond, length as m-dash]](https://www.rsc.org/images/entities/char_e001.gif) O bands, respectively,44 whereas the two fitted peaks at 531.7 eV and 532.7 eV in the O 1s spectrum (Fig. 2C) were assigned to CO and C–OH/C–O–C groups, respectively.45
O bands, respectively,44 whereas the two fitted peaks at 531.7 eV and 532.7 eV in the O 1s spectrum (Fig. 2C) were assigned to CO and C–OH/C–O–C groups, respectively.45
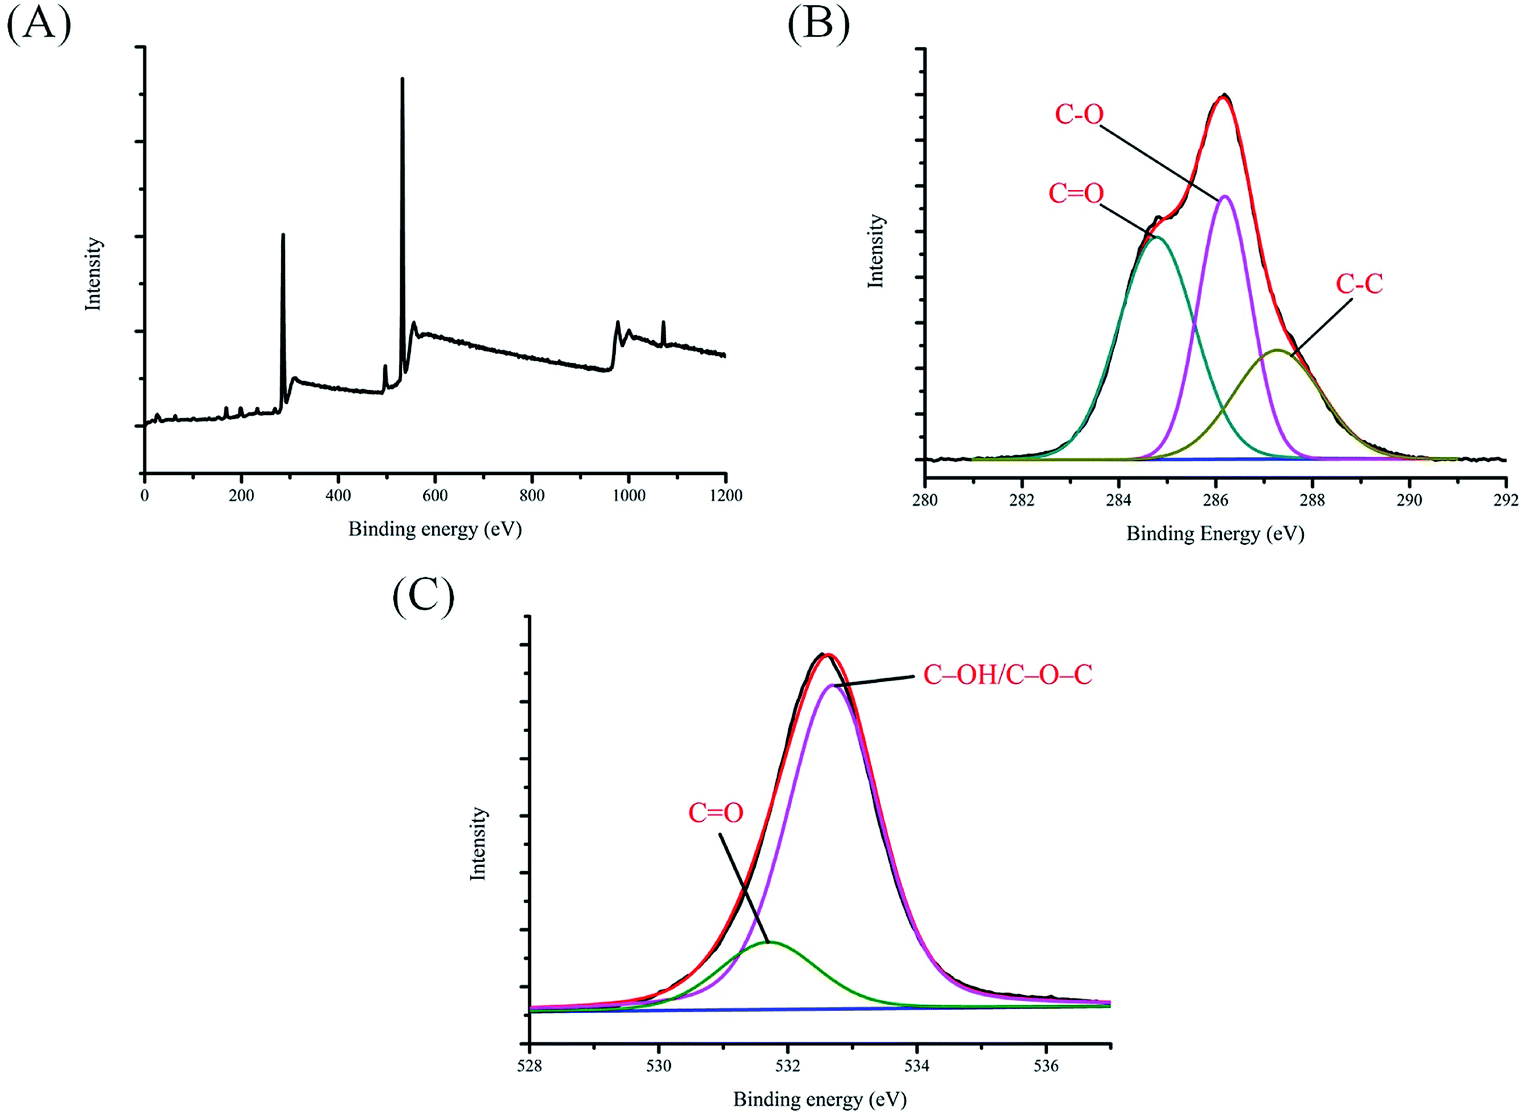 | ||
| Fig. 2 (A) XPS analysis of C-dot@β-CD; high resolution plots of (B) C 1s, (C) O 1s. | ||
The remarkable optical properties of the fabricated C-dot@β-CD were confirmed by UV-vis absorption and fluorescence spectra (Fig. 3). We observed a broad UV-vis absorption band (220 nm), which was ascribed to the n–π* transition of C-dot@β-CD. However, the nanocomposites showed fluorescence responses, indicating maximum excitation and emission spectra at 350 nm and 448 nm, respectively.26 We investigated the effects of pH on the fluorescence intensity of C-dot@β-CDs because pH is often an important factor affecting the fluorescence intensity of fluorescent probes. As shown in Fig. S3A,† the fluorescence intensity decreased slightly at pH 12, whereas no significant change was observed in the pH range from 5 to 11. This result might be explained by the protonation and deprotonation of C-dot@β-CD. Besides, stability is also an important factor for a nanoprobe. We further investigated the salt tolerance and light stability of C-dot@β-CD through fluorescence intensity. Fig. S3B† shows that the fluorescence intensity of C-dot@β-CD remained almost constant at different sodium chloride concentrations up to 1 M. As shown in Fig. S3C,† the fluorescence intensity was also unaffected after irradiation (EX 350 nm) for 1 h. We also investigated C-dot@β-CD fluorescence intensity (Fig. S3D†) in the presence of various organic solvents such as acetone, acetonitrile (ACN), isopropanol (IPA), ethanol (EtOH) and ethylene glycol (EG). It was found that the fluorescence intensity changed with polarity and solubility of these solvents. However, C-dot@β-CD was well-dispersed, and no precipitation was observed in any of the organic solvents. These results showed that C-dot@β-CD had excellent salt tolerance, light stability, and good solubility in organic solvents.
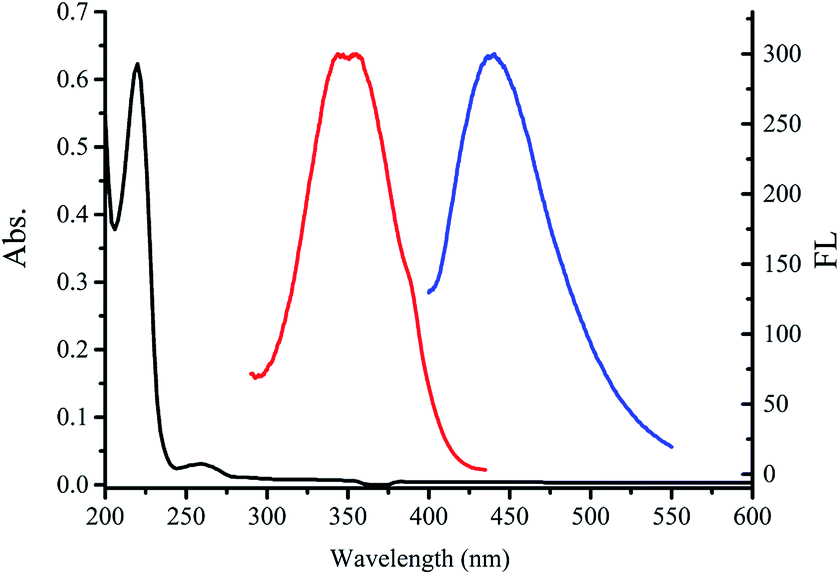 | ||
| Fig. 3 UV-vis absorption (black line), fluorescence excitation (red line) and emission (blue line) spectra of C-dot@β-CD in aqueous solution (inset: photographs of C-dot@β-CD solution under visible light and under UV light). | ||
Photoinduced electron transfer between C-dot@β-CD and Rhodamine B (RB)
To ensure that β-cyclodextrin was modified on C-dots, we studied the fluorescence intensity of C-dot@β-CD in different concentrations of RB. As shown in Fig. 4, there were clear discrepancies between the emissions at 448 nm (from C-dot@β-CD) and 575 nm (from RB). Upon addition of 0.1 ppm RB to the C-dot@β-CD solution, the original fluorescence emission (575 nm) of RB disappeared. This phenomenon may have been due to the ability of RB to enter the cavity of the β-CD moiety in the nanoprobe, which was attributed to their specific host–guest recognition.46 When 1 ppm RB was mixed with the C-dot@β-CD solution, it was observed that RB fluorescence intensity (green line) was about 58.3% lower than the original fluorescence intensity (red line) of 1 ppm RB. We conjectured that few molecules of RB entered the cavity of β-CD, which caused the difference in fluorescence intensities at the same concentration. This phenomenon implied that RB may have interacted with the C-dot@β-CD probe, which affected its optical property. We believe that our C-dot@β-CD can be developed as a nanoprobe for sensing organic compounds through host–guest recognition.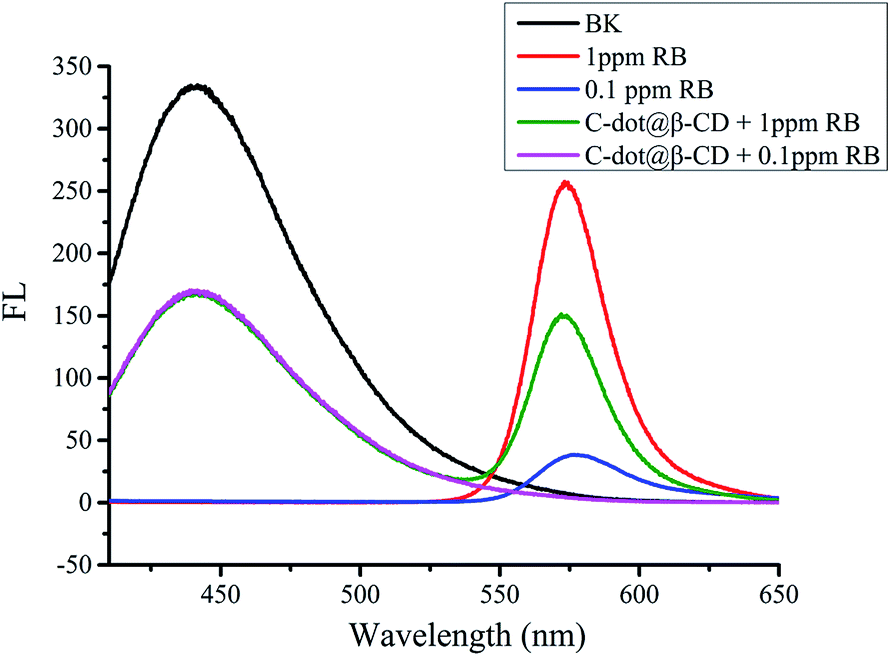 | ||
| Fig. 4 Fluorescence spectra responses of C-dot@β-CD (black), 1 ppm RB (red), 0.1 ppm RB (blue), C-dot@β-CD + 1 ppm RB (green), C-dot@β-CD + 0.1 ppm RB (pink). | ||
Fluorescence detection of CC and HQ using C-dot@β-CD
In our previous study, β-CD functionalization with C-dots created a hydrophobic environment on the C-dot surface. Because of the unique molecular structures of CC and HQ, these phenolic compounds can enter the cavity of C-dot@β-CD. This process reduces the distance between these phenolic compounds and the surface of the C-dots. Here, we observed almost no overlap between the fluorescence spectra of C-dot@β-CD and the spectra of CC and HQ, which ruled out inner-filter effects related to fluorescence quenching (Fig. S4†). High quenching efficiency of C-dot@β-CD was observed in the presence of micromolar concentrations of CC or HQ, which suggested that there could be photoinduced electron transfer (PET) between C-dot@β-CD and these two analytes.46 Time-resolved fluorescence decay curves for C-dot@β-CD in the absence and presence of CC and HQ were further analyzed, as shown in Fig. S5.† As illustrated in Table S1,† a change in the fluorescence decay time was observed from 9.96 ns (C-dot@β-CD alone) to 4.30 ns or 3.85 ns for C-dot@β-CD in the presence of CC or HQ, respectively. We believe that PET probably caused the fluorescence quenching, where C-dot@β-CD and the phenolic compounds served as electron donor and electron acceptors, respectively.47As the concentrations of CC and HQ increased, the fluorescence intensity of C-dot@β-CDs gradually decreased. For CC- and HQ-detection studies, we used different concentrations of CC and HQ in the range of ∼10−4 M to 10−8 M; Fig. 5 shows the fluorescence spectra corresponding to C-dot@β-CDs at different CC and HQ concentrations. A linear relationship was observed between the fluorescence intensity and CC concentration [0.1–10 μM (R2 = 0.997) with a limit of detection (LOD, S/N > 3) of 20.2 nM] as well as HQ concentration [0.1–10 μM (R2 = 0.996), with LOD of 47.9 nM]. These results improved upon those previously reported using a common spectrophotometric method (HQ: 1.45 mM).48
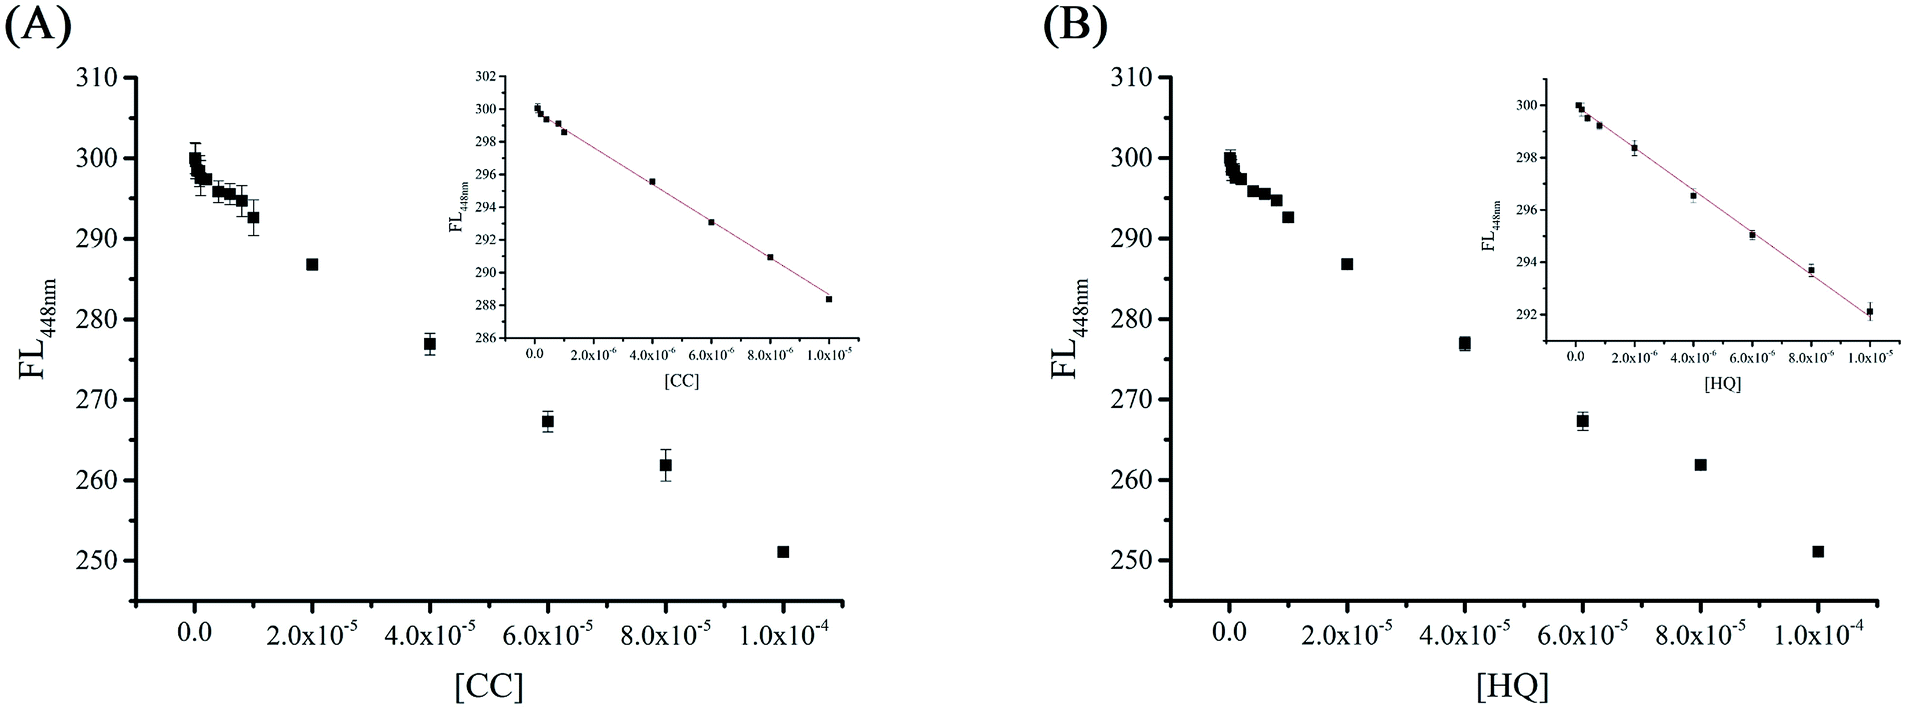 | ||
| Fig. 5 Fluorescence spectra of C-dot@β-CD upon the addition of different concentrations of (A) catechol in the range of 10−4 to 10−7 M and (B) hydroquinone in the range of 10−4 to 10−8 M. Inset: the plots of fluorescence intensity at 448 nm at different concentrations of catechol and hydroquinone. | ||
An interference study of the novel analytical method was carried out with the addition of different, potentially interfering substances, which could be present in actual samples. Therefore, we added other common ions such as Au3+, Li+, Co3+, Ca2+, Hg2+, Pd2+, Ag+, Fe2+, Zn2+, Mg2+, Cu2+, Ni2+, K+, Al3+, Fe3+ and Ba2+ in the C-dot@β-CD system (Fig. 6A). On the other hand, with the addition of common oxidants and reductants such as H2O2, H2C2O4, NaNO2, NaBH4, AA, Na2SO3 and Na3C6H5O7, there was almost no change in the fluorescence intensity of the C-dot@β-CD system (Fig. 6B). The results suggested that there were only small changes in the fluorescence of the C-dot@β-CD system in the presence of metal ions and oxidizing/reducing agents. A comparison of the limit of detection and linear range of this method with those of other methods for detecting phenolic compounds is shown in Table 1. It should be noted that our C-dot@β-CD sensor for CC and HQ detection had lower LOD and better linear range than those previously reported with other methods.49–57
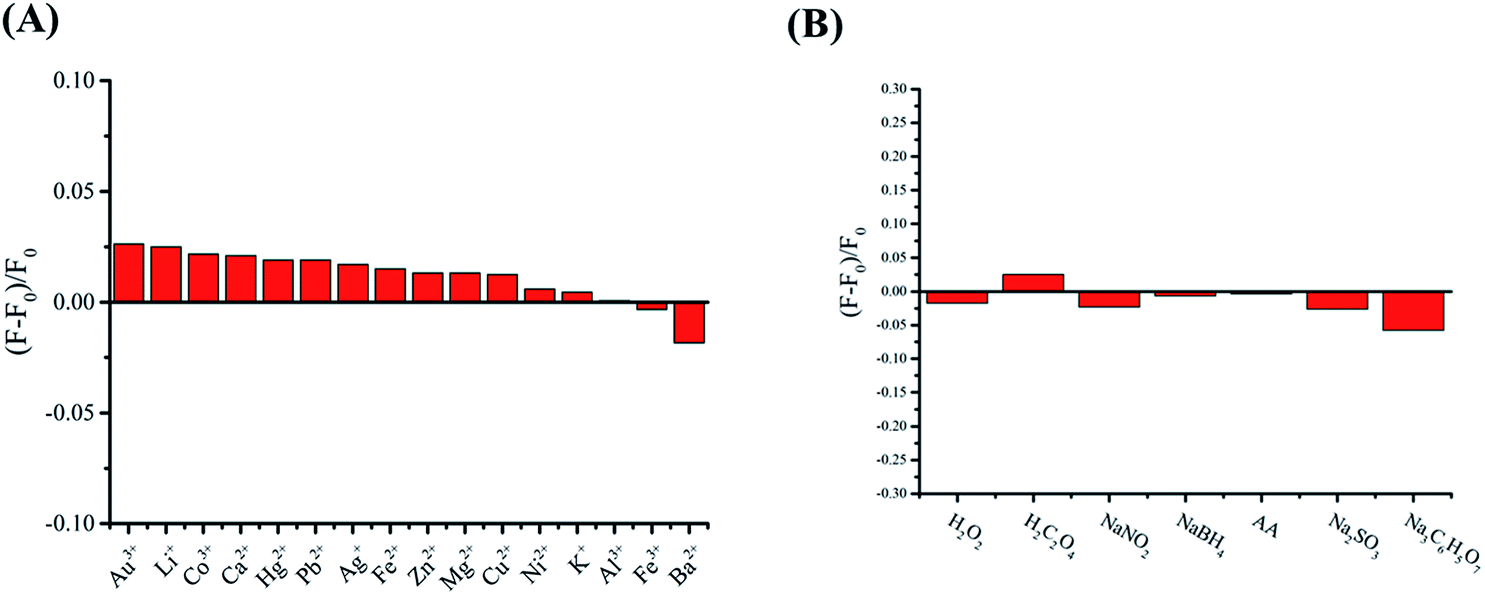 | ||
| Fig. 6 (A) Comparison of the fluorescence intensities of C-dot@β-CD after the addition of different metal ions (the concentration of metal ions was 10 μM). (B) Fluorescence response of C-dot@β-CD in the presence of different oxidizing/reducing agents (the concentration of each type of oxidizing/reducing agent was 0.1 mM). | ||
| Sensors | Method | Linear range (μM) | Detection limit (μM) | Reference | ||
|---|---|---|---|---|---|---|
| HQ | CC | HQ | CC | |||
| a RGO: reduced graphene oxide, CNF: carbon nano-fragment, PASA: poly-amidosulfonic acid, PIL: polymeric ionic liquid, PDA: polydopamine, MWCNT: multi-walled carbon nanotube, PMG: poly-malachite green, PMT: poly(3-methylthiophene). | ||||||
| Mesoporous Pt | UV-vis | 3.37–360 | — | 1.36 | — | 48 |
| Pt–MnO2/GCE | Electrochemical | 3–481 | 15–447 | — | — | 49 |
| PASA/MWNTs/GCE | Electrochemical | 8–391 | 5.5–540 | 2.60 | 1.80 | 50 |
| CNF/GCE | Electrochemical | 6–200 | 2–200 | 0.25 | 0.1 | 51 |
| PIL–MWCNTs | Electrochemical | 1–500 | 1–400 | 0.40 | 0.17 | 52 |
| PDA-RGO | Electrochemical | 1–230 | 1–250 | 0.72 | 0.82 | 53 |
| MWCNT–PMG/GCE | Electrochemical | 10–480 | 30–1190 | 1.60 | 5.80 | 54 |
| MWCNT/PMT | Electrochemical | 0.5–200 | 0.5–150 | 0.05 | 0.05 | 55 |
| CNF–AuNPs | Electrochemical | 9–500 | 5–350 | 0.86 | 0.36 | 56 |
| Au@Pd/rGO | Electrochemical | 0.01–400 | 0.1–400 | 0.01 | 0.1 | 57 |
| C-dot@β-CD | Fluorescence | 0.1–10 | 0.1–100 | 0.020 | 0.048 | This work |
Cell viability assays
To understand the viability of our nanoprobe, we studied the effects of various doses of nanoparticles in cells. The HaCaT cells were exposed to four different concentrations of C-dot@β-CD solutions from 1.4 to 3.5 mg mL−1, and ddH2O was used as control. At each time point, the cells were harvested for MTT assay. At a concentration of 0.7 mg mL−1, it was found that the cell viability was not affected. The cell viability was still more than 80% at a high concentration of 1.4 mg mL−1. Our results showed that the nanoparticles affected the HeLa cells only to a slight extent.Application of C-dot@β-CD determination of catechol and hydroquinone in real water samples
To investigate the efficacy of this method, it was applied for the detection of phenolic compounds in tap water and lake water samples. All real samples were spiked with CC or HQ at concentrations of 10 μM, 20 μM, and 50 μM, and they were centrifuged at 12000 rpm for 30 min, as described in the Experimental methods section. Our results showed recovery of 97.4% to 106.7%, with a relative standard deviation of <4.04% (Table 2). These results showed that this probe system which used fluorescence as a signal was suitable for the rapid determination (30 min) of phenolic compounds in environmental water samples.
| Analyte | Sample | Added (μM) | Found (μM) | Recovery (%) | RSD (%) |
|---|---|---|---|---|---|
| Catechol | Lake water | 10 | 10.30 | 103.0 | 2.64 |
| 20 | 20.42 | 102.1 | 3.05 | ||
| 50 | 48.85 | 97.7 | 2.51 | ||
| Tap water | 10 | 10.05 | 100.5 | 2.08 | |
| 20 | 20.04 | 100.4 | 3.00 | ||
| 50 | 50.04 | 100.4 | 1.52 | ||
| Hydroquinone | Lake water | 10 | 10.05 | 100.5 | 2.51 |
| 20 | 19.4 | 97.4 | 2.00 | ||
| 50 | 52.8 | 105.6 | 2.64 | ||
| Tap water | 10 | 10.6 | 106.7 | 4.04 | |
| 20 | 20.0 | 100.0 | 1.73 | ||
| 50 | 50.5 | 101.0 | 0.57 |
Conclusion
In summary, a highly sensitive and selective method for the detection of catechol and hydroquinone was developed with β-CD-modified C-dots. The water-soluble C-dot@β-CD nanocomposites were stable, uniform in size, and well-dispersed in solutions, and they showed excellent optical properties. Due to the synergistic effect of the hydrothermal C-dots (high degree of water solubility and excellent optical properties) and β-CD (enables host–guest recognition), the C-dot@β-CD nanocomposites displayed excellent analytical performances for the selective and sensitive determination of CC and HQ. Importantly, organic dyes and other environmentally problematic compounds were not required in our system. Additionally, this novel method is environmentally friendly, and it exhibits good biocompatibility. Furthermore, our results suggested that C-dot@β-CDs can also be potentially useful for cell imaging applications and recognition of chiral molecules.Conflicts of interest
There are no conflicts to declare.Acknowledgements
This work was supported by the NTTU and Ministry of Science and Technology, Taiwan (MOST106-2113-M-143-003).Notes and references
- M. Blaut, A. Braune, S. Wunderlich, P. Sauer, H. Schneider and H. Glatt, Food Chem. Toxicol., 2006, 44, 1940–1947 CrossRef PubMed.
- H. Du, J. Ye, J. Zhang, X. Huang and C. Yu, J. Electroanal. Chem., 2011, 650, 209–213 CrossRef.
- H. Yin, Q. Zhang, Y. Zhou, Q. Ma, T. liu, L. Zhu and S. Ai, Electrochim. Acta, 2011, 56, 2748–2753 CrossRef.
- Y. Wang, Y. Xiong, J. Qu, J. Qu and S. Li, Sens. Actuators, B, 2016, 223, 501–508 CrossRef.
- W. Si, W. Lei, Z. Han, Q. Hao, Y. Zhang and M. Xia, Sens. Actuators, B, 2014, 199, 154–160 CrossRef.
- L. Tang, Y. Zhou, G. Zeng, Z. Li, Y. Liu, Y. Zhang, G. Chen, G. Yang, X. Lei and M. Wu, Analyst, 2013, 138, 3552–3560 RSC.
- Y. Zhang, S. Xiao, J. Xie, Z. Yang, P. Pang and Y. Gao, Sens. Actuators, B, 2014, 204, 102–108 CrossRef.
- P. Nagaraja, R. A. Vasantha and K. R. Sunitha, Talanta, 2001, 55, 1039–1046 CrossRef PubMed.
- H. Cui, C. He and G. Zhao, J. Chromatogr. A, 1999, 855, 171–179 CrossRef PubMed.
- N. Guan, Z. Zeng, Y. Wang, E. Fu and J. Cheng, Anal. Chim. Acta, 2000, 418, 145–151 CrossRef.
- J. A. Garcia-Mesa and R. Mateos, J. Agric. Food Chem., 2007, 55, 3863–3868 CrossRef PubMed.
- G. Marrubini, E. Calleri, T. Coccini, A. F. Castoldi and L. Manzo, Chromatographia, 2005, 62, 25–31 Search PubMed.
- S. C. Moldoveanu and M. Kiser, J. Chromatogr. A, 2007, 1141, 90–97 CrossRef PubMed.
- H.-P. Wu, T.-L. Cheng and W.-L. Tseng, Langmuir, 2007, 23, 7880–7885 CrossRef PubMed.
- Q. Ye, F. Yan, D. Kong, J. Zhang, X. Zhou, J. Xu and L. Chen, Sens. Actuators, B, 2017, 250, 712–720 CrossRef.
- Y. He, J. Sun, D. Feng, H. Chen, F. Gao and L. Wang, Biosens. Bioelectron., 2015, 74, 418–422 CrossRef PubMed.
- H. Zhang, P. Dai, L. Huang, Y. Huang, Q. Huang, W. Zhang, C. Wei and S. Hu, Anal. Methods, 2014, 6, 2687–2691 RSC.
- C. Tang, Z. Qian, Y. Qian, Y. Huang, M. Zhao, H. Ao and H. Feng, Sens. Actuators, B, 2017, 245, 282–289 CrossRef.
- C. Tang, J. Zhou, Z. Qian, Y. Ma, Y. Huang and H. Feng, J. Mater. Chem. B, 2017, 5, 1971–1979 RSC.
- X. Meng, Q. Chang, C. Xue, J. Yang and S. Hu, Chem. Commun., 2017, 53, 3074–3077 RSC.
- Q. Sun, S. Fang, Y. Fang, Z. Qian and H. Feng, Talanta, 2017, 167, 513–519 CrossRef PubMed.
- C. Yang, C. Ke, W. Liang, G. Fukuhara, T. Mori, Y. Liu and Y. Inoue, J. Am. Chem. Soc., 2011, 133, 13786–13789 CrossRef PubMed.
- R. Freeman, T. Finder, L. Bahshi and I. Willner, Nano Lett., 2009, 9, 2073–2076 CrossRef PubMed.
- A. Z. M. Badruddoza, M. T. Rahman, S. Ghosh, M. Z. Hossain, J. Shi, K. Hidajat and M. S. Uddin, Carbohydr. Polym., 2013, 95, 449–457 CrossRef PubMed.
- H. Ma, X. Li, T. Yan, Y. Li, H. Liu, Y. Zhang, D. Wu, B. Du and Q. Wei, ACS Appl. Mater. Interfaces, 2016, 8, 10121–10127 Search PubMed.
- M. Zheng, Z. Xie, D. Qu, D. Li, P. Du, X. Jing and Z. Sun, ACS Appl. Mater. Interfaces, 2013, 5, 13242–13247 Search PubMed.
- J. Zong, X. Yang, A. Trinchi, S. Hardin, I. Cole, Y. Zhu, C. Li, T. Muster and G. Wei, Biosens. Bioelectron., 2014, 51, 330–335 CrossRef PubMed.
- S. Sun, L. Zhang, K. Jiang, A. Wu and H. Lin, Chem. Mater., 2016, 28, 8659–8668 CrossRef.
- Y. Zhang, W. Liu, S. Ge, M. Yan, S. Wang, J. Yu, N. Li and X. Song, Biosens. Bioelectron., 2013, 41, 684–690 CrossRef PubMed.
- Y. Li, Y. Zhao, H. Cheng, Y. Hu, G. Shi, L. Dai and L. Qu, J. Am. Chem. Soc., 2012, 134, 15–18 CrossRef PubMed.
- L. Zheng, Y. Chi, Y. Dong, J. Lin and B. Wang, J. Am. Chem. Soc., 2009, 131, 4564–4565 CrossRef PubMed.
- T.-R. Kuo, S.-Y. Sung, C.-W. Hsu, C.-J. Chang, T.-C. Chiu and C.-C. Hu, Anal. Bioanal. Chem., 2016, 408, 77–82 CrossRef PubMed.
- B. B. Chen, Z. X. Liu, H. Y. Zou and C. Z. Huang, Analyst, 2016, 141, 2676–2681 RSC.
- J.-M. Liu, L.-p. Lin, X.-X. Wang, S.-Q. Lin, W.-L. Cai, L.-H. Zhang and Z.-Y. Zheng, Analyst, 2012, 137, 2637–2642 RSC.
- H. Peng, Y. Li, C. Jiang, C. Luo, R. Qi, R. Huang, C.-G. Duan and J. Travas-Sejdic, Carbon, 2016, 100, 386–394 CrossRef.
- S. Zhu, Q. Meng, L. Wang, J. Zhang, Y. Song, H. Jin, K. Zhang, H. Sun, H. Wang and B. Yang, Angew. Chem., 2013, 125, 4045–4049 CrossRef.
- Y. Wei, H. Li, H. Hao, Y. Chen, C. Dong and G. Wang, Polym. Chem., 2015, 6, 591–598 RSC.
- S. N. Baker and G. A. Baker, Angew. Chem., Int. Ed., 2010, 49, 6726–6744 CrossRef PubMed.
- Q. Chang, K. K. Li, S. L. Hu, Y. G. Dong and J. L. Yang, Mater. Lett., 2016, 175, 44–47 CrossRef.
- A. Gupta, N. C. Verma, S. Khan and C. K. Nandi, Biosens. Bioelectron., 2016, 81, 465–472 CrossRef PubMed.
- A. Gupta, N. C. Verma, S. Khan, S. Tiwari, A. Chaudhary and C. K. Nandi, Sens. Actuators, B, 2016, 232, 107–114 CrossRef.
- T. N. J. I. Edison, R. Atchudan, M. G. Sethuraman, J.-J. Shim and Y. R. Lee, J. Photochem. Photobiol., B, 2016, 161, 154–161 CrossRef PubMed.
- K. Li, F.-Y. Su and W.-D. Zhang, Appl. Surf. Sci., 2016, 375, 110–117 CrossRef.
- S. Hu, Z. Wei, Q. Chang, A. Trinchi and J. Yang, Appl. Surf. Sci., 2016, 378, 402–407 CrossRef.
- W. Lu, X. Qin, S. Liu, G. Chang, Y. Zhang, Y. Luo, A. M. Asiri, A. O. Al-Youbi and X. Sun, Anal. Chem., 2012, 84, 5351–5357 CrossRef PubMed.
- C. Tang, Z. Qian, Y. Huang, J. Xu, H. Ao, M. Zhao, J. Zhou, J. Chen and H. Feng, Biosens. Bioelectron., 2016, 83, 274–280 CrossRef PubMed.
- M. Luo, Y. Hua, Y. Liang, J. Han, D. Liu, W. Zhao and P. Wang, Biosens. Bioelectron., 2017, 98, 195–201 CrossRef PubMed.
- Y. Ni, Z. Xia and S. Kokot, J. Hazard. Mater., 2011, 192, 722–729 CrossRef PubMed.
- B. Unnikrishnan, P.-L. Ru and S.-M. Chen, Sens. Actuators, B, 2012, 169, 235–242 CrossRef.
- F. Hu, S. Chen, C. Wang, R. Yuan, D. Yuan and C. Wang, Anal. Chim. Acta, 2012, 724, 40–46 CrossRef PubMed.
- C. Zhang, L. Zeng, X. Zhu, C. Yu, X. Zuo, X. Xiao and J. Nan, Anal. Methods, 2013, 5, 2203–2208 RSC.
- X. Feng, W. Gao, S. Zhou, H. Shi, H. Huang and W. Song, Anal. Chim. Acta, 2013, 805, 36–44 CrossRef PubMed.
- L. Zheng, L. Xiong, Y. Li, J. Xu, X. Kang, Z. Zou, S. Yang and J. Xia, Sens. Actuators, B, 2013, 177, 344–349 CrossRef.
- Y. Umasankar, A. P. Periasamy and S.-M. Chen, Anal. Biochem., 2011, 411, 71–79 CrossRef PubMed.
- H. Zhang, J. Zhao, H. Liu, R. Liu, H. Wang and J. Liu, Microchim. Acta, 2010, 169, 277–282 CrossRef.
- Z. Huo, Y. Zhou, Q. Liu, X. He, Y. Liang and M. Xu, Microchim. Acta, 2011, 173, 119–125 CrossRef.
- H. Wang, S. Zhang, S. Li and J. Qu, Anal. Methods, 2018, 10, 1331–1338 RSC.
Footnote |
| † Electronic supplementary information (ESI) available. See DOI: 10.1039/c8ra02813c |
| This journal is © The Royal Society of Chemistry 2018 |