 Open Access Article
A long-persistent phosphorescent chemosensor for the detection of TNP based on CaTiO3:Pr3+@SiO2 photoluminescence materials†
Fangfang Lia,
Fengyi Wanga,
Xuan Hua,
Baozhan Zhenga,
Juan Du *ab and
Dan Xiao
 *ab
*ab
aCollege of Chemistry, Sichuan University, 29 Wangjiang Road, Chengdu 610064, China. E-mail: dujuanchem@scu.edu.cn; xiaodan@scu.edu.cn
bKey Laboratory of Green Chemistry and Technology, Ministry of Education, College of Chemistry, Sichuan University, Chengdu, Sichuan 610064, China
First published on 4th May 2018
Abstract
The detection of nitroaromatic explosives is important due to their strong explosive force and harmfulness in the environment, and for homeland security and public safety. Herein, a phosphorescence CaTiO3:Pr3+@SiO2 nanosensor was successfully developed for the sensitive and selective detection of 2,4,6-trinitrophenol (TNP). The red-emitting phosphorescent chemosensor CaTiO3:Pr3+@SiO2 possessed a long enough phosphorescence lifetime of 0.016 s. The TNP induced phosphorescence quenching process of CaTiO3:Pr3+@SiO2 presented a wide linearity with TNP concentrations ranging from 0.5 to 100 μM, and the detection limit was found to be 20.6 nM. Furthermore, this sensor displayed a high selectivity toward TNP over other structurally similar compounds like 2,4,6-trinitrotoluene (TNT), 2,4-dinitrotoluene (DNT), 4-nitrotoluene (NT), 2,4-dinitrophenol (DNP), 4-nitrophenol (NP) and phenol. This sensing system was successfully used in the test of TNP concentrations in water samples, and showed great potential for practical application.
Introduction
2,4,6-Trinitrophenol (TNP), known as picric acid, is a common reagent widely used in the in the preparation of matches, fireworks, explosives, fungicides, glasses, rocket fuels, chemical fibers and dyes.1–4 Compared to other nitroaromatic compounds such as 2,4,6-trinitromethylbenzene (TNT) and 2,4-dinitrotoluene (DNT), TNP has stronger explosive power and higher thermal-expansion.5,6 It needs to be noted that due to the high solubility of TNP in water, it can easily contaminate soil and groundwater and accumulate in natural waters over the long-term during its testing, usage, storage, and dumping.7–12 Once TNP enters the human body, it will cause harm such as neurological disorders, convulsions, abdominal pain, headache, dizziness, and even cancer.13,14 Therefore, selective and sensitive detection of TNP has attracted increasing attention in view of homeland security and personal safety.Currently, different techniques have been developed for the determination of TNP, including infrared and Raman spectroscopy,15 high-pressure liquid chromatography,16 mass spectrometry,17,18 surface-enhanced Raman spectroscopy,19 colorimetric1 and electrochemical.20 Unfortunately, most of these methods are complicated or time-consuming, and involve complex operation of expensive instruments, all of which will impede their widespread application. Photoluminescence (PL)-based chemosensors have gained more attention because of their low instrumentation cost, short response time, high sensitivity and selectivity.21,22 On the other hand, when using an optical sensing technology, a large background fluorescence signal will cause a negative impact during detection process,23,24 Compared with fluorescent materials, phosphorescent materials can eliminate the interference from short-lived fluorescent background by using time-resolved technology, with added advantages of high luminescence efficiency, and good photo and thermal stabilities.25–27 Nevertheless, so far there are few reports about detecting nitroaromatic explosives by means of phosphorescence method.
In recent years, the photoluminescence materials of alkaline earth titanates doped with rare earth ions have attracted research interests due to their high chemical stability.28 Most titanates photoluminescence materials were widely used in the fields of emergency lighting, interior decoration, road signs and AC-LEDs.29–31 Among which, CaTiO3:Pr3+ photoluminescence materials became very popular due to its persistent afterglow phenomenon. CaTiO3:Pr3+ material has perovskite structure, when Pr3+ incorporates in CaTiO3 perovskite, it yields a single red emission, from the 1D2–3H4 transition, due to the overlying inter-valence charge transfer that completely depopulates the 3P0 state.32,33 Recently, CaTiO3:Pr3+ material has received more attention because of its good persistent characteristics with chromaticity coordinate close to the “ideal red”, excellent chemical/physical stability, and eco-friendliness.34,35 In order to gain a better performance, great efforts have been made to prepare the nano-sized CaTiO3:Pr3+ photoluminescence material, such as solid-state reaction,36 precipitation technique,37 sol–gel process38 and hydrothermal synthesis.39 As a persistent phosphorescent material, CaTiO3:Pr3+ has attracted considerable attention for various displays and signing applications in dark environments. However, until now, there were no attention to the determination of nitroaromatic explosives using CaTiO3:Pr3+.
In the present work, we prepared long-persistent red-emitting CaTiO3:Pr3+ photoluminescence material under solid-state synthesis method. Because of its poor solubility in many solvents, the CaTiO3:Pr3+ nanoparticles should be functionalized to make it solvent-stable before utilization as a photoluminescence probe. Herein, the CaTiO3:Pr3+ nanoparticles can be uniformly dispersed in water via a facile strategy of coating a silica shell on the CaTiO3:Pr3+ surface to form a photoluminescence composite material, and presented an example of application of CaTiO3:Pr3+@SiO2 nanoparticles for TNP detection. In this work, CaTiO3:Pr3+@SiO2 nanoparticles displayed a high sensitivity toward TNP over other structurally similar compounds like 2,4,6-trinitrotoluene (TNT), 2,4-dinitrotoluene (DNT), 4-nitrotoluene (NT), 2,4-dinitrophenol (DNP), 4-nitrophenol (NP) and phenol. This assay can effectively detect TNP range from 0.5 μM to 100 μM with a detection limit of 20.6 nM. This method was also successfully used to analyze TNP in natural water samples.
Experimental section
Chemicals
Praseodymium oxide (Pr6O11), 2,4,6-trinitrophenol (TNP), 2,4,6-trinitrotoluene (TNT), 2,4-dinitrotoluene (DNT), 4-nitrotoluene (NT), 2,4-dinitrophenol (DNP), 4-nitrophenol (NP) and phenol were purchased from Aladdin (Shanghai, China); orthoboric acid (H3BO3), titanium oxide (TiO2), calcium nitrate tetrahydrate (Ca(NO3)2·4H2O) were purchased from Chengdu Chemical Reagent Company (Chengdu, China); tetraethyl orthosilicate (TEOS), cyclohexane, n-hexanol, and Triton X-100 (TX-100) were purchased from Tianjin Reagent Plant (Tianjin, China). All the other chemicals were of analytical-reagent grade and used without further purification.Apparatus
UV-visible spectra were measured on Hitachi U-2900 spectrophotometer equipped with a 1 cm quartz cell. Phosphorescence spectra were measured on Hitachi F-7000 spectrophotometer equipped with a 1 cm quartz cell. Scanning electron microscopy (SEM) images were recorded on a field emission Hitachi S4800 microscope (Japan) equipped with a Oxford energy-dispersive X-ray (EDX) detector (UK) to perform the elemental mapping. X-ray diffraction (XRD) measurement was acquired on a Tongda TD-3500 X-ray powder diffractometer (Liaoning, China) with Cu Kα radiation. Phosphorescence lifetime was measured on a Fluorolog-3 spectrofluorometer (Horiba JobinYvon) with a Spectra LED (280 nm, S-280, Horiba Scientific) as the excitation source and a picosecond photon detection module (PPD-850, Horiba Scientific) as the detector. The Particle size were measured on a Malvern Nano ZS90 Zetasizer Nano instrument (Worcestershire, UK).Preparation of the CaTiO3:Pr3+ nanoparticles
CaTiO3:Pr3+ were prepared by a solid-state synthesis method as described in the literature with a little modification.40 Pr3+ was introduced in the form of Pr(NO3)3 by dissolving Pr6O11 into HNO3. Ca(NO3)2·4H2O, TiO2, and Pr3+ were weighed according to the nominal compositions of CaTiO3:xPr3+ (x = 0%, 0.1%, 0.4% and 1%), and 3 wt% H3BO3 was added as a flux, then they were mixed by ultrasonic cleaner at room temperature for 15 min, the mixture was put into tube furnace to sinter at 900 °C for 1–5 h. At last, white powder samples CaTiO3:Pr3+ were gained.Synthesis of CaTiO3:Pr3+@SiO2 nanoparticles
Typically, 15 mL cyclohexane, 3.4 mL Triton X-100 and 3.6 mL 1-hexanol are mixed uniformly, after stirring for 5 minutes, a certain concentration of as-prepared CaTiO3:Pr3+ nanoparticles (50 mg) and 300 μL deionized water were added to a beaker under stirring to form a w/o microemulsion. Then 100 μL tetraethyl orthosilicate (TEOS) and 100 μL ammonia aqueous solution were added to the microemulsion and the sample was mechanically stirred for 24 h at room temperature. To separate the particles, ethanol was added to break the microemulsion. The resulting nanocomposites were centrifuged and washed repeatedly with water and ethanol and then dried in vacuum at 40 °C overnight.Results and discussion
Preparation and characterization of CaTiO3:Pr3+@SiO2 nanoparticles
As mentioned previously, the strong phosphorescence CaTiO3:Pr3+ nanoparticles were prepared by solid phase method. We tested the phosphorescence intensity of CaTiO3:Pr3+ with different mole ratios of Pr3+ and calcination time. Fig. S1A† exhibited the phosphorescence spectra of CaTiO3:xPr3+ (x = 0–1%) samples upon 315 nm excitation. The sample had no phosphorescence emission intensity at x = 0, and the phosphorescence intensity of CaTiO3:Pr3+ nanoparticles at x = 0.4% was the highest in those red phosphorescence materials with different mole ratios of Pr3+. The sample sintered at 900 °C for 3 h showed the maximum phosphorescence intensity in Fig. S1B.† Here, the samples used in the later measurements were prepared at Pr3+ mole ratio 0.4%, calcination temperature 900 °C and calcination time 3 h. We also investigated the phosphorescence behavior of CaTiO3:Pr3+ before and after coated a silica shell. The phosphorescence intensity of CaTiO3:Pr3+ decreased after coated a silica shell (Fig. S2A†), but the phosphorescence intensity of CaTiO3:Pr3+@SiO2 hardly changed within 2 h under 315 nm excitation. Compared with the ∼30% decrease in phosphorescence intensity of CaTiO3:Pr3+ in about 2 h (Fig. S2B†), it can be inferred that the CaTiO3:Pr3+@SiO2 nanoparticles had better photo-stability than CaTiO3:Pr3+. CaTiO3:Pr3+@SiO2 nanoparticles were used in later experiments.The micromorphology analysis of CaTiO3:Pr3+@SiO2 nanoparticles were carried out using scanning electron microscopy (SEM). As showed in Fig. 1A, CaTiO3:Pr3+@SiO2 nanoparticles were uniformly dispersed with diameters of 115–300 nm, and the average size was 201 nm (inset of Fig. 1A). Fig. 1B showed the diffraction peak positions and the relative intensities of CaTiO3:Pr3+ and CaTiO3:Pr3+@SiO2, respectively. The discernible five diffraction peaks could be indexed to (112), (220), (312), (224) and (332), which matched well with the database of perovskite in JCPDS (JCPDS Card no. 01-081-0561) file. The same position of characteristic peaks for CaTiO3:Pr3+ and CaTiO3:Pr3+@SiO2 indicated the stability of the crystalline phase of CaTiO3:Pr3+ nanoparticles during silica coating. Besides the peak of CaTiO3, the XRD pattern of CaTiO3:Pr3+@SiO2 (red line) presented abroad XRD peak at low diffraction angle ∼21°, which attributed to the amorphous state SiO2 shells. Moreover, EDS elemental mapping images presented in Fig. S3† verify the presence of O, Si, Ca and Ti elements in CaTiO3:Pr3+@SiO2.
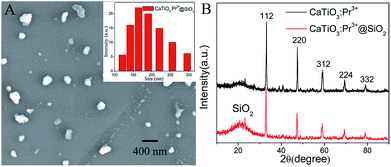 | ||
| Fig. 1 (A) SEM image of CaTiO3:Pr3+@SiO2 nanoparticles, (inset: size distribution of CaTiO3:Pr3+@SiO2 nanoparticles), (B) XRD pattern of CaTiO3:Pr3+ and CaTiO3:Pr3+@SiO2 samples. | ||
Phosphorescence sensing to TNP
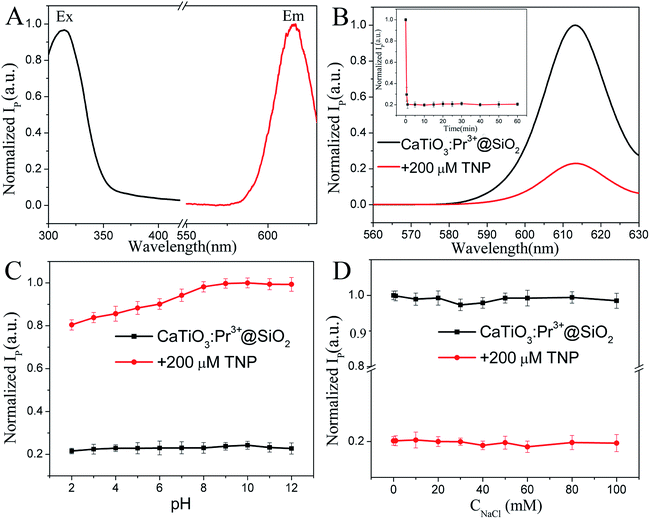
Upon 315 nm excitation, a very intense single red emission band at 614 nm was found in the phosphorescence spectrum of CaTiO3:Pr3+@SiO2 (Fig. 2A), corresponding to the characteristic 1D2 → 3H4 transition of Pr3+.28 The phosphorescence intensity was significantly quenched by ∼80% with the addition of 200 μM TNP (Fig. 2B). The response time for CaTiO3:Pr3+@SiO2 toward TNP was within 1 min (the inset of Fig. 2B).The phosphorescence behavior of CaTiO3:Pr3+@SiO2 in absence and presence of 200 μM TNP in various PBS buffer at pH 2–12 were measured (Fig. 2C). The phosphorescence intensity of CaTiO3:Pr3+@SiO2 in the absence of TNP was slowly raised in the pH range from 2 to 8, and was comparatively stable when pH > 8. The phosphorescence intensity of CaTiO3:Pr3+@SiO2 was comparatively stable in the presence of TNP in the whole pH range from 2 to 12. Considering the more stable phosphorescence intensity of CaTiO3:Pr3+@SiO2 without TNP in the in the pH range from 8 to 12, a weak alkaline condition of pH 8.0 (PBS, 10 mM) was used for the later phosphorescence measurements.
The phosphorescence intensity of CaTiO3:Pr3+@SiO2 in the absence and presence of 200 μM TNP remained almost constant when exposed to 0–100 mM NaCl solution (Fig. 2D), indicating that ionic strength just had negligible effect on the detection of TNP. The dramatic phosphorescence intensity decrease, short response time and stable phosphorescence behavior in wide pH range and high ionic strength demonstrated the great potential of CaTiO3:Pr3+@SiO2 nanoparticles as effective TNP probe.
Specificity of CaTiO3:Pr3+@SiO2 toward TNP
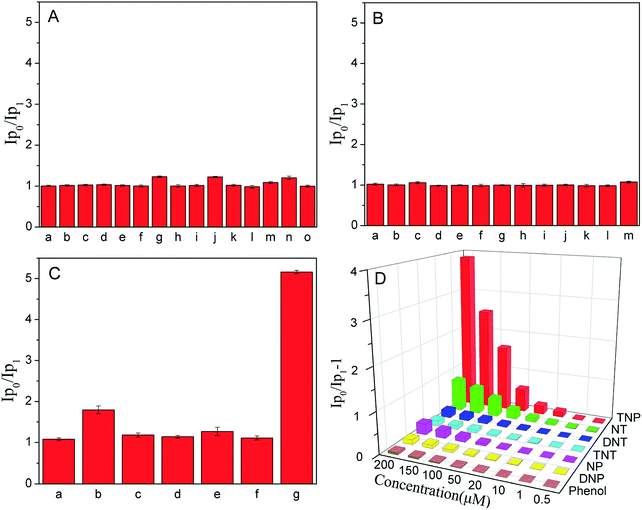
To verify the specific recognition of CaTiO3:Pr3+@SiO2 to TNP, we investigated the phosphorescence behavior of CaTiO3:Pr3+@SiO2 to different metal ions (200 μM), anions (200 μM) and nitroaromatic explosives (200 μM) in PBS(10 mM, pH 8.0). As showed in Fig. 3, the phosphorescence intensity of CaTiO3:Pr3+@SiO2 had no obvious change in the presence of the above mentioned substances except that only several nitroaromatic explosives induced a negligible phosphorescence intensity decrease. The quenching efficiency for various nitroaromatic explosives (2,4,6-trinitrotoluene (TNT), 2,4-dinitrotoluene (DNT), 2-nitrotoluene (NT), 2,4-dinitrophenol (DNP), 4-nitrophenol (NP) and phenol) was also estimated by using the Stern–Volmer (SV) equation,| I0/I = 1 + KSV[Q] |
| Analytes | KS–V values (×104) | Correlation coefficient (R2) |
|---|---|---|
| TNP | 1.25 | 0.999 |
| NT | 0.41 | 0.992 |
| DNT | 0.090 | 0.991 |
| TNT | 0.067 | 0.995 |
| NP | 0.13 | 0.993 |
| DNP | 0.053 | 0.994 |
| Phenol | 0.025 | 0.995 |
Investigation of the detection mechanism
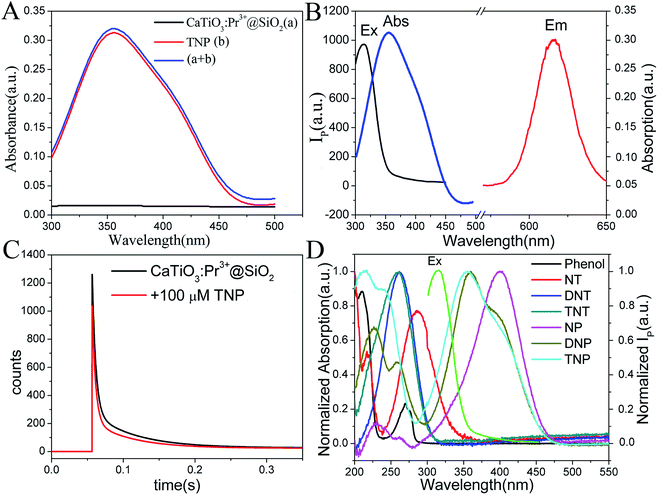
In order to probe the origin of the high selectivity of CaTiO3:Pr3+@SiO2 toward TNP, the quenching process was studied. In general, as shown in Fig. 4A, the UV-vis absorption spectrum of the sum of CaTiO3:Pr3+@SiO2 and TNP was very similar to that of TNP alone except a slight difference in the intensity. This phenomenon indicated that the no Meisenheimer complexes between CaTiO3:Pr3+@SiO2 and TNP were formed.41 As shown in Fig. S5 in the ESI,† no new absorption peak but increased absorption intensity could be observed with the increasing concentration of TNP. These results excluded the possibility of a charge-transfer mechanism between TNP and CaTiO3:Pr3+@SiO2. As displayed in Fig. 4C, the photoluminescence lifetime of CaTiO3:Pr3+@SiO2 in the absence and presence of 100 μM TNP remained nearly constant, and the phosphorescence decay was fitted using a two-exponential decay function to yield a lifetime of 0.016 s. The unchanged lifetime excluded the possibility of the FRET process between CaTiO3:Pr3+@SiO2 and TNP. Fig. 4B showed the excitation spectrum and emission spectrum of CaTiO3:Pr3+@SiO2 and the absorption spectrum of TNP. An obvious overlap between the excitation spectrum of CaTiO3:Pr3+@SiO2 and the absorption spectrum of TNP can be noticed. Owing to the strong absorption of TNP, the excitation light for CaTiO3:Pr3+@SiO2 was weakened by an inner filter effect (IFE) process. Therefore, the IFE could be considered as one major process in the phosphorescence quenching behavior of the CaTiO3:Pr3+@SiO2 after addition of TNP. As comparison, there were little overlap between the UV-vis absorption spectra of the other six nitroaromatic explosives and the phosphorescence excitation spectrum of CaTiO3:Pr3+@SiO2, which resulted in poor IFE efficiency (Fig. 4D). On the other hand, we supplemented the FT-IR spectra of CaTiO3:Pr3+@SiO2, TNP, CaTiO3:Pr3+@SiO2 and TNP mixture, respectively, and the results were presented in Fig. S6.† Comparing line b and line c, the band at 1275 cm−1 responsible for C–N stretching, at 1155 cm−1 for C–O bond stretching, at 1350 cm−1 for –NO2 group symmetric stretching and at 1525 cm−1 for asymmetric stretching were all hardly shifted, which suggested that there were no chemical bond was formed between CaTiO3:Pr3+@SiO2 and TNP.42,43 Besides, we also tested the ζ-potential of CaTiO3:Pr3+@SiO2 alone and CaTiO3:Pr3+@SiO2 with NP, DNP and TNP, As showed in Fig. S7,† the average ζ-potential of CaTiO3:Pr3+@SiO2 alone, CaTiO3:Pr3+@SiO2 with NP, DNP and TNP were −22 mV, −23.9 mV, −14.8 mV and −8.29 mV respectively, which meant that the electrostatic interaction between CaTiO3:Pr3+@SiO2 and TNP was higher than that with DNP and NP. As mentioned above, the unprecedented selectivity of CaTiO3:Pr3+@SiO2 toward TNP can be explained by the favorable IFE and electrostatic interactions. Scheme 1 showed the possible mechanism of the phosphorescence quenching detection of TNP based on the CaTiO3:Pr3+@SiO2 photoluminescence materials.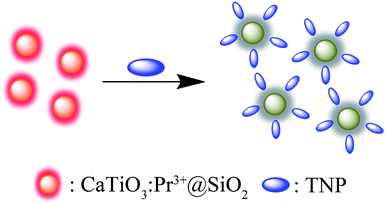 | ||
| Scheme 1 Scheme for the phosphorescence quenching detection of TNP based on the CaTiO3:Pr3+@SiO2 photoluminescence materials. | ||
Detection of TNP by CaTiO3:Pr3+@SiO2
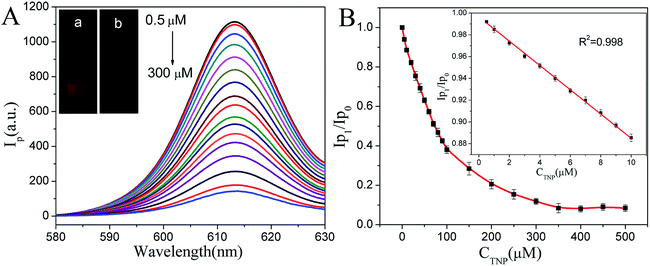
According to the above investigation, we found that the phosphorescence intensity decreased with the increasing of TNP, when CaTiO3:Pr3+@SiO2 were free in aqueous solution under UV light off instantaneously, strong red phosphorescence can be observed (Fig. 5A-a). However, in the presence of TNP, the phosphorescence of CaTiO3:Pr3+@SiO2 was quenched significantly (Fig. 5A-b), indicated that CaTiO3:Pr3+@SiO2 possed good TNP response ability. Therefore, in order to exploring the sensing ability of CaTiO3:Pr3+@SiO2 to TNP, phosphorescence quenching titrations were performed with incremental additions of TNP to CaTiO3:Pr3+@SiO2. Fig. 5A showed the quenching of phosphorescence intensity upon the addition of TNP solutions (0–300 μM). The phosphorescence intensity gradually decreased with increasing concentrations of TNP and then reached a plateau when TNP concentration reached 300 μM (Fig. 5B). The maximum phosphorescence intensity of CaTiO3:Pr3+@SiO2 was reduced by when TNP concentration reached 300 μM (Fig. 5B). The maximum phosphorescence intensity of CaTiO3:Pr3+@SiO2 was reduced by 88.2% upon exposure to 300 μM TNP solution. A good linear relationship between phosphorescence signal of (Ip0/Ip1) and TNP concentration was observed from 0.5 to 100 μM (R2 = 0.998), with a limit of detection of 20.6 nM. Compared with other systems for ATP detection (Table S1†), our CaTiO3:Pr3+@SiO2 phosphorescence sensor showed lower detection limit and wider linear range.Determining the concentration of TNP in water samples
To illustrate the feasibility of the phosphorescence TNP sensor in complex matrices, the proposed method was applied in the detection of TNP in pond water samples. The water samples were transferred to a centrifuge tube and the large particles were separated from the water by centrifugation at 10![[thin space (1/6-em)]](https://www.rsc.org/images/entities/char_2009.gif) 000 rpm for 15 min. The reliability and accuracy of the detection method we developed were evaluated through a recovery study, which was carried out on samples spiked with standard TNP solutions (20, 50, 80 μM). The results were satisfactory with the recoveries of 99.34–101.6% (Table S2†), indicating potential applications in the detection of TNP in pond water.
000 rpm for 15 min. The reliability and accuracy of the detection method we developed were evaluated through a recovery study, which was carried out on samples spiked with standard TNP solutions (20, 50, 80 μM). The results were satisfactory with the recoveries of 99.34–101.6% (Table S2†), indicating potential applications in the detection of TNP in pond water.
Conclusions
In summary, highly photoluminescent CaTiO3:Pr3+@SiO2 nanoparticles were synthesized through a solid-state synthesis method, which can act as a sensitive and selective phosphorescent chemosensor for the detection of TNP in aqueous solution without interference from different metal ions, anions and nitroaromatic explosives. As a phosphorescence probe, CaTiO3:Pr3+@SiO2 has better physical and chemical stabilities, long phosphorescence lifetime and eco-friendliness. The phosphorescence intensity gradually decreased with increasing concentrations of TNP. A good linear relationship between the phosphorescence and TNP concentration was obtained from 0.5 to 100 μM, and the detection limit was as low as 20.6 nM. The IFE and electrostatic interactions were considered to be the main process for the photoluminescence responses for this sensor system. The chemosensor was successfully used to determine the concentration of TNP in water samples, which made it possible for rapid, convenient, sensitive, and selective detection of trace amounts of TNP in environmental and water samples. On conclusion, the developed method is expected to be further applied in environmental pollution analysis.Conflicts of interest
There are no conflicts to declare.Acknowledgements
The work described in this paper was supported by the National Natural Science Foundation of China (21377089, 21407109). We would like to express our sincere thanks to Analytical & Testing Centre of Sichuan University for the measurements.References
- Y. Peng, A. J. Zhang, M. Dong and Y. W. Wang, Chem. Commun., 2011, 47, 4505–4507 RSC.
- G. He, H. Peng, T. Liu, M. Yang, Y. Zhang and Y. Fang, J. Mater. Chem., 2009, 19, 7347–7353 RSC.
- P. Ghosh, S. K. Saha, A. Roychowdhury and P. Banerjee, Eur. J. Inorg. Chem., 2015, 17, 2851–2857 CrossRef.
- P. Ghosh and P. Banerjee, Anal. Chim. Acta, 2017, 965, 111–122 CrossRef CAS PubMed.
- M. Dong, Y. W. Wang, A. J. Zhang and Y. Peng, Chem.–Asian J., 2013, 8, 1321–1330 CrossRef CAS PubMed.
- D. Singha, S. Bhattacharya, P. Majee, S. Mondal, M. Kumar and P. Mahata, J. Mater. Chem. A, 2014, 2, 20908–20915 CAS.
- M. Rong, L. Lin, X. Song, T. Zhao, Y. Zhong, J. Yan, Y. Wang and X. Chen, Anal. Chem., 2015, 87, 1288–1296 CrossRef CAS PubMed.
- Y. Salinas, R. Martinez-Manez, M. D. Marcos, F. Sancenon, A. M. Costero, M. Parra and S. Gil, Chem. Soc. Rev., 2012, 41, 1261–1296 RSC.
- M. E. Germain and M. J. Knapp, Chem. Soc. Rev., 2009, 38, 2543–2555 RSC.
- J. S. Yang and T. M. Swager, J. Am. Chem. Soc., 1998, 120, 11864–11873 CrossRef CAS.
- B. Xu, X. Wu, H. Li, H. Tong and L. Wang, Macromolecules, 2011, 44, 5089–5092 CrossRef CAS.
- Y. Ma, H. Li, S. Peng and L. Wang, Anal. Chem., 2012, 84, 8415–8421 CrossRef CAS PubMed.
- V. Bhalla, A. Gupta, M. Kumar, D. S. Rao and S. K. Prasad, ACS Appl. Mater. Interfaces, 2013, 5, 672–679 CAS.
- S. Babaee and A. Beiraghi, Anal. Chim. Acta, 2010, 662, 9–13 CrossRef CAS PubMed.
- M. López-López and C. García-Ruiz, TrAC, Trends Anal. Chem., 2014, 54, 36–44 CrossRef.
- D. S. Moore, Rev. Sci. Instrum., 2004, 75, 2499–2512 CrossRef CAS.
- R. Mu, H. Shi, Y. Yuan, A. Karnjanapiboonwong, J. G. Burken and Y. Ma, Anal. Chem., 2012, 84, 3427–3432 CrossRef CAS PubMed.
- K. Badjagbo and S. Sauvé, Crit. Rev. Anal. Chem., 2012, 42, 257–271 CrossRef CAS.
- J. M. Sylvia, J. A. Janni, J. D. Klein, K. M. Spencer and A. Chem, Anal. Chem., 2000, 72, 5834–5840 CrossRef CAS PubMed.
- R. Hodyss and J. L. Beauchamp, Anal. Chem., 2005, 77, 3607–3610 CrossRef CAS PubMed.
- P. Ghosh, S. Paul and P. Banerjee, CrystEngComm, 2017, 19, 6703–6710 RSC.
- P. Ghosh, J. Das, A. Basak, S. K. Mukhopadhyay and P. Banerjee, Sens. Actuators, B, 2017, 251, 985–992 CrossRef CAS.
- Q. Zhao, C. Huang and F. Li, Chem. Soc. Rev., 2011, 40, 2508–2524 RSC.
- V. W. Yam and K. M. Wong, Chem. Commun., 2011, 47, 11579–11592 RSC.
- L. He, J. Qiao, L. Duan, G. Dong, D. Zhang, L. Wang and Y. Qiu, Adv. Funct. Mater., 2009, 19, 2950–2960 CrossRef CAS.
- Y. Chi and P. T. Chou, Chem. Soc. Rev., 2010, 39, 638–655 RSC.
- R. D. Costa, E. Ortí, H. J. Bolink, F. Monti, G. Accorsi and N. Armaroli, Angew. Chem., Int. Ed., 2012, 51, 8178–8211 CrossRef CAS PubMed.
- P. T. Diallo, P. Boutinaud, R. Mahiou and J. C. Cousseins, Phys. Status Solidi A, 2015, 160, 255–263 CrossRef.
- Z. Pan, Y. Y. Lu and F. Liu, Nat. Mater., 2012, 11, 58–63 CrossRef CAS PubMed.
- W. Zeng, Y. Wang, S. Han, W. Chen, G. Li, Y. Wang and Y. Wen, J. Mater. Chem. C, 2013, 1, 3004–3011 RSC.
- Y. Luo and Z. Xia, J. Phys. Chem. C, 2014, 118, 23297–23305 CAS.
- R. Ali and M. Yashima, J. Solid State Chem., 2005, 178, 2867–2872 CrossRef CAS.
- H. J. A. Koopmans, G. M. H. V. D. Velde and P. J. Gellings, Acta Crystallogr., Sect. C: Cryst. Struct. Commun., 1983, 39, 1323–1325 CrossRef.
- P. Boutinaud, L. Sarakha, E. Cavalli, M. Bettinelli, P. Dorenbos and R. Mahiou, J. Phys. D: Appl. Phys., 2009, 42, 45106–45112 CrossRef.
- Y. Inaguma, T. Muronoi, K. Sano, T. Tsuchiya, Y. Mori, T. Katsumata and D. Mori, Inorg. Chem., 2011, 50, 5389–5395 CrossRef CAS PubMed.
- B. Wang, H. Lin, J. Xu, H. Chen, Z. Lin, F. Huang and Y. Wang, Inorg. Chem., 2015, 54, 11299–11306 CrossRef CAS PubMed.
- X. Zhang, J. Zhang, X. Ren and X. J. Wang, J. Solid State Chem., 2008, 181, 393–398 CrossRef CAS.
- X. Zhang, J. Zhang, X. Zhang, M. Wang, H. Zhao, S. Lu and X. Wang, J. Phys. Chem. C, 2007, 111, 18044–18048 CAS.
- K. Sue, S. Kawasaki, T. Sato, D. Nishiohamane, Y. Hakuta and T. Furuya, Ind. Eng. Chem. Res., 2016, 55, 7628–7634 CrossRef CAS.
- R. Chen and D. Chen, Spectrochim. Acta, Part A, 2014, 127, 256–260 CrossRef CAS PubMed.
- Y. Wang and Y. Ni, Anal. Chem., 2014, 86, 7463–7470 CrossRef CAS PubMed.
- P. Ghosh and P. Banerjee, Phys. Chem. Chem. Phys., 2016, 18, 22805–22815 RSC.
- P. Ghosh, P. Roy, A. Ghosh, S. Jana, N. C. Murmu, S. K. Mukhopadhyay and P. Banerjee, J. Lumin., 2017, 185, 272–278 CrossRef CAS.
Footnote |
| † Electronic supplementary information (ESI) available. See DOI: 10.1039/c8ra02665c |
| This journal is © The Royal Society of Chemistry 2018 |

