
 Open Access Article
 This Open Access Article is licensed under a Creative Commons Attribution-Non Commercial 3.0 Unported Licence
Detection of resveratrol by phosphorescence quantum dots without conjunction and mutual impact exploration†
Jin Qin,
Ji Zheng,
Xiaoxing Fang and
Guiqin Yan *
*
Shanxi Normal University, Linfen 041004, PR China. E-mail: gqyan2013@163.com; Fax: +(86)0357-2051249
First published on 19th July 2018
Abstract
In this study, a convenient and sensitive method for the detection of resveratrol was established based on phosphorescence quenching of resveratrol for MPA-capped Mn:ZnS QDs. The quenching intensity was in proportion to the concentration of resveratrol within a certain range. Under optimal conditions, the present assay was valid for detecting resveratrol in the range from 0.03 μM to 14 μM with a detection limit of 0.01 μM. The mechanism of action was also explored, and its application in actual samples was also demonstrated with satisfactory results. This study aims to provide a convenient method for the detection of resveratrol.
1 Introduction
Resveratrol (3,4,5-N-trihydroxystilbene, RES) is a polyphenolic compound, which exists mainly in edible plants such as grapes, berries, mulberries, and peanuts.1–3 It is produced as a plant antitoxin as part of the plant defense mechanism in response to environmental stress (UV, ozone exposure, mechanical damage and fungal infections).4–6 It consists of two isomers: cis and trans isomers. However, most of the investigations are focused on the trans-resveratrol, because cis-resveratrol is unstable, and its physiological activity is not clear.7,8In recent years, resveratrol has been isolated and used as a health care product and nutritional supplements. Numerous studies have confirmed that it plays a significant role in slowing cancer,9 aging,10 cardiovascular diseases,11,12 metabolic diseases (diabetes)13,14 and age-associated neurodegenerative diseases (Alzheimer and Parkinson's).15,16 However, it is still a long way from being used as a drug because only some of resveratrol can be absorbed after its metabolism, the majority of which is excreted through urine.17 Therefore, it is necessary to establish a convenient detection system to explore the absorption and metabolism of resveratrol so as to provide a theoretical reference for its pharmacokinetics.
The most representative techniques for the detection of resveratrol in actual samples are high performance liquid chromatography with electrochemical detection (HPLC-UV),18–22 gas chromatography coupled with mass spectrometry (GC-MS),23–27 fluorescence analysis (FL),28–30 magnetic molecularly imprinted polymer (MIP)31,32 and capillary electrophoresis (CE).33–37 Though these methods have been well proven, they have some limitations as they are rather complex, time-consuming and expensive. In view of these limitations, it is necessary to put forward a convenient, accurate and rapid method to detect resveratrol.
Recently, room temperature phosphorescence quantum dot (RTP QD) detection has attracted considerable attention because of its many advantages as compared to fluorescence QDs such as longer lifetime, higher reliability and stability without interference from autofluorescence or scattered light.38–40 The phosphorescence lifetime of Mn-doped ZnS quantum dots is about 2 milliseconds. Moreover, since RTP is rare, the selection of an RTP sensor can be further improved;41 meanwhile, it can be used to avoid complicated sample pretreatments.42 Based on these superior characteristics, such an optical sensor based on RTP QDs will have considerable development and wide application potentials.38–41,43–50
In this study, a rapid and sensitive detection method of resveratrol was designed by using RTP QDs without conjugation. The reaction mechanism between Mn:ZnS QDs and RES was discussed as well. In addition, the phosphorescence quenching of Mn:ZnS QDs by RES was caused by the formation of the Mn:ZnS QDs–RES complex, and both electrostatic attraction and hydrogen bond formation may have played major roles in this process.
2 Experimental
2.1 Reagents
Mercaptopropionic acid (MPA), Zn(Ac)2·2H2O and Mn(Ac)2·4H2O were purchased from Beijing J&K Scientific Co. (China). Na2S·9H2O was purchased from Tianjing Kermel Chemical Reagent Co. (China). Ultrapure water (18.2 MΩ cm) was prepared using a water purification system (Labconco Corporation, USA, Kansas City). RES capsules were purchased from Celex Laboratories Inc. All chemicals were of analytical grade and used without further purification.2.2 Apparatus
Transmission electron microscopy (TEM) images were obtained on JSM-7500F TEM (Japan). Phosphorescence spectroscopy data were obtained on a Cary Eclipse fluorescence spectrophotometer (Varian American Pty Ltd. America) in the phosphorescence mode; the unit was equipped with a plotter unit and a quartz cell (1 cm × 1 cm). The slits for excitation and emission were 10 nm and 20 nm wide, respectively. UV-visible (UV/Vis) spectra were obtained using a Shimadzu UV-29100 UV/Vis spectrophotometer, and pH was measured with a pH meter (Jinpeng Analytical Instruments Co. Ltd, China). Resonance light scattering (RLS) signals were measured on the Cary Eclipse fluorescence spectrophotometer (Δλ = 0) at 200–700 nm.2.3 Preparation of MPA-capped Mn:ZnS QDs
MPA-capped Mn:ZnS QDs were prepared according to previously reported methods51,52 with slight modifications. In a typical synthesis, Zn(Ac)2 (0.1 M, 5 mL), Mn(Ac)2 (0.01 M, 2 mL), and MPA (0.04 M, 170 μL) were added to a three-neck flask successively while stirring. Second, the pH of the mixed solution was set to 11 with NaOH (1 M). After degassing with argon for 30 min, Na2S solution (0.1 M, 5 mL) was added. Under the same conditions, the reaction was continued for 20 min. Then, the reaction solution was aged at 50 °C under open-air conditions for 2 h to form QDs. The resulting MPA-capped Mn:ZnS QDs were washed with ethanol and separated by centrifugation three times, followed by vacuum-drying at room temperature for 24 h. Finally, highly water-soluble QD powder was obtained.2.4 Phosphorescence detection of RES
For detection of RES, 35 μM stock solution of RES was prepared, from which various RES concentrations were prepared by serial dilutions. For the quenching studies, aqueous solutions of Mn:ZnS QDs (2.0 mg mL−1, 100 μL) and RES with different concentrations were mixed in phosphate-buffered saline solution (PBS buffer, pH 6.4, 20 mM) at room temperature for 10 min before the spectral measurements. Experiments were repeated three times. No further pretreatment was employed in the sample preparation.2.5 Sample pretreatment
First, after the shell of the capsule was removed, 0.05 g RES powder was accurately weighed and transferred to a 100 mL beaker; double distilled water was added and ultrasonic vibration was used to dissolve the powder. The mixture was then filtered with 0.22 μm pore size filter membrane. A 100 mL volumetric flask was used to ensure a constant volume, and the solution was protected from light. Fresh human urine was collected from healthy young volunteers. Each urine sample was centrifuged at 10![[thin space (1/6-em)]](https://www.rsc.org/images/entities/char_2009.gif) 000 rpm for 10 min to remove particulate matter. The supernatants were filtered through a 0.22 μm pore size filter membrane and diluted 10 times before analysis.
000 rpm for 10 min to remove particulate matter. The supernatants were filtered through a 0.22 μm pore size filter membrane and diluted 10 times before analysis.
3 Results and discussion
3.1 Characterization of the MPA-capped Mn:ZnS QDs
TEM was applied to characterize the morphology and size of as-prepared Mn:ZnS QDs. Clearly, the nanoparticles were spherical and well-separated with an average diameter of 3.5 nm (Fig. S1a†). XRD was used to further characterize the crystalline structure of Mn:ZnS QDs; it was shown that the prepared Mn:ZnS QDs exhibited a Zn-blend structure, as revealed by the distinguishable (111), (220), and (311) planes (Fig. S1b†). Besides, the maximum excitation peak of the prepared Mn:ZnS QDs occurred at 295 nm, and the narrow emission band was centered at 595 nm (Fig. S1c†), because of the energy transferred from the band gap of ZnS to the Mn2+ dopant and the subsequent 4T1 to 6A1 transition of Mn2+ incorporated into the ZnS host lattice.53–563.2 Phosphorescence quenching of Mn:ZnS QDs by RES
Fig. 1a presents the phosphorescence emission spectra of Mn:ZnS QDs in the absence and presence of RES. Apparently, with the increase in RES concentration, the RTP intensity of Mn:ZnS QDs was quenched at 594 nm. When the concentration of RES reached 14 μM, the RTP intensity of Mn:ZnS QDs was basically stabilized, and the RTP intensity of Mn:ZnS QDs was quenched by 14 μM RES as much as 5 times. This phenomenon indicated that the RES concentration has a great effect on the RTP intensity of Mn:ZnS QDs. | ||
| Fig. 1 (a) RES concentration-dependent RTP emission of the MPA-capped Mn:ZnS QDs; (b) Stern–Volmer plots for the RES–Mn:ZnS QD system at three different temperatures; (c) Lineweaver–Burk plots for the RES–Mn:ZnS QD system at three different temperatures; (d) Van't Hoff plot for the RES–Mn:ZnS QD system at three different temperatures (PBS, 20 mM, pH 6.4; Mn:ZnS QDs, 40 mg L−1). | ||
3.3 Optimization of the experimental conditions
We investigated the effects of pH, reaction time and NaCl concentration on the detection of resveratrol. Among them, pH not only affected the QD luminous intensity and stability itself, but also affected the interaction between QDs and resveratrol. The results showed that the changes of QDs and QDs–RES were basically same as the pH changes, which increased at first and then decreased. It was observed that MPA partly detached from the surface of QDs at lower pH, induced surface defects of QDs, facilitated non-radiation recombination, and led to phosphorescence decrease.57,58 Then, in alkaline conditions, the ionization degree of the carboxyl group on the surface of QDs increased gradually, which may weaken the effect towards resveratrol. Additionally, it reached a maximum degree of RTP quenching of QDs at pH 6.4 (Fig. S2a†); thus, 6.4 was chosen as the optimum pH value for the experiment.Then, the reaction time was studied as well. The results showed that the reaction was completed in 10 min (Fig. S2b†). Therefore, 10 min reaction time was selected as the suitable reaction time.
Furthermore, we explored the effects of salt concentration on the experiment, and the results showed that when the concentration was in the range of 0–0.1 M, the phosphorescence value changed slightly, but when the NaCl concentration increased within the range of 0.1–0.2 M, phosphorescence basically did not change (Fig. S2c†); this indicated that the testing system can exert steady influence at high salt concentrations.
3.4 Possible mechanism
As we know, photon luminescence quenching can be divided into dynamic and static quenching, and this can be distinguished by their differing dependence on temperature.55 The well-known Stern–Volmer equation is usually used for the description of quenching mode, and it is expressed as
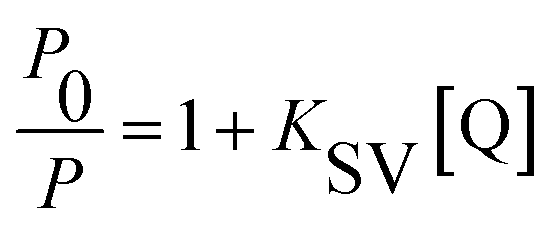 | (1) |
Subsequently, the binding constant (K) of RES and Mn:ZnS QDs can be calculated by using the Lineweaver–Burk equation:61
 | (2) |
Here, P and P0 are the phosphorescence intensities of Mn:ZnS QDs in the presence and absence of RES, respectively; [Q] is the concentration of RES. Fig. 1c shows the values of binding constants K, which can be obtained by the Lineweaver–Burk equation at different temperatures; the order of magnitude of K is 104 (Table 1). In Table 1, we can see that the binding constant (K) values decreased with increasing temperature, which may indicate the formation of an unstable complex. There may be hydrogen bonding between Mn:ZnS QDs and RES.62,63 The temperature increase resulted in poor stability of complexes and then promoted the disintegration of a part of the complex; therefore, the values of K decreased.
| Temperature (K) | K ( × 104/M) | ΔG° (kJ mol−1) | ΔH° (kJ mol−1) | ΔS° (J mol−1) |
|---|---|---|---|---|
| 298 | 2.13 | −24.68 | ||
| 308 | 2.01 | −25.38 | −3.89 | 69.78 |
| 318 | 1.93 | −26.08 |
As the binding constant K is related to temperature, the thermodynamic process can be used to study the formation process of the complex, and thermodynamic parameters are further used to study the binding mode of Mn:ZnS QDs and RES. The standard enthalpy change (ΔH°) and standard entropy change (ΔS°) can be calculated according to the Van't Hoff relationship,
 | (3) |
Here, K is the binding constant at the corresponding temperature; R is the gas constant. A linear relationship is observed for the Van't Hoff plot of lnK versus 1/T (Fig. 1d). The standard enthalpy change (ΔH°) and standard entropy change (ΔS°) can be used to calculate the Gibbs free energy change (ΔG°):
| ΔG° = ΔH° − TΔS° | (4) |
The values of ΔG°, ΔH° and ΔS° were acquired, and they are presented in Table 1, from which it can be seen that the combination between RES and Mn:ZnS QDs was spontaneous with a negative sign for ΔG°. ΔH° has a negative value, and ΔS° is positive, which indicated that the binding of RES to the surface of Mn:ZnS QDs is an exothermic process. When ligand molecules bind independently to a set of equivalent sites on a macromolecule, the equilibrium between free and bound molecules is given by the equation:64,65
 | (5) |
For the system of Mn:ZnS QDs–RES, the values of n at different temperatures are listed in Table 2. The values of n were 0.962, 0.930 and 0.897 at 298 K, 308 K and 318 K, respectively. The value of n was approximately equal to 1, which implied that there was one independent class of binding site for QDs towards RES.
| T/K |
|
Experimental value of binding-site number | Theoretical value of binding-site number |
|---|---|---|---|
| 298 |  |
0.962 | 1 |
| 308 |  |
0.930 | 1 |
| 318 | 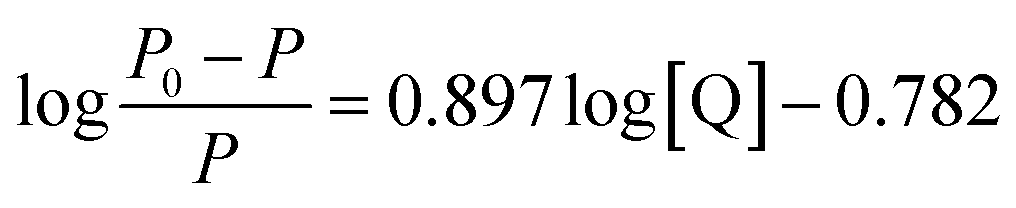 |
0.897 | 1 |

The interaction and structural changes of molecules can be easily examined by UV-Vis absorption spectroscopy. Therefore, UV-Vis absorption spectra were used to investigate the RES–QD system. As demonstrated in Fig. 2a, in the spectrum of Mn:ZnS QDs, strong absorption was observed in the range of 220–300 nm. In the spectrum of RES, there were two characteristic absorption peaks at 252 nm and 319 nm. When RES was introduced into QDs, a new absorption peak appeared in the vicinity of 276 nm, which was not caused by a simple superposition of the two data. Additionally, with the increase in the concentration of RES, the peak intensity of the mixture in the vicinity of 276 nm and 319 nm gradually increased, and the positions of the peaks clearly red shifted; however, the intensity of the peak located at 252 nm decreased, and its position blue shifted. This indicated that there is strong interaction between RES and QDs, forming a new complex in structure.
 | ||
| Fig. 2 (a) UV-Vis absorption spectrum of QDs-RES system; (b) RLS spectrum of QDs–RES system; (c) a linear calibration plot of the quenched RTP (P0/P) intensity against the concentration of RES (PBS, 20 mM, pH 6.4; Mn:ZnS QDs, 40 mg L−1). | ||
Moreover, as illustrated in Fig. 2b, the RLS spectra of Mn:ZnS QDs–RES system were obtained. It can be seen that the RLS intensity of pure QDs (curve 1) or RES (curve 2) was very weak. However, it was strongly enhanced in the wavelength range of 220–700 nm after mixing. These results revealed that the interaction between Mn:ZnS QDs and RES can generate larger aggregates, and the increase in the volume of composites results in the increase in RRS intensity.
As the isoelectric point of MPA is 4.3,38 after the addition of RES, which has an isoelectric point of 7.3,66 an ionic conjugate is prone to be formed due to electrostatic attraction. Furthermore, large amounts of MPA on the surface of QDs play a role of capping agent with the carboxylic groups, and the carboxylic groups are less likely to undergo ionization under these experimental conditions; thus, it is easy to form hydrogen bonds with the three phenolic hydroxyl groups of RES. The surface reaction of quantum dots increases their surface defects, reducing the form of surface electron radiation transitions and increasing the form of non-radiative transitions. This is due to the weakened spin-forbidden transitions n–π*, which lead to the decrease in RTP signal (Scheme 1).67
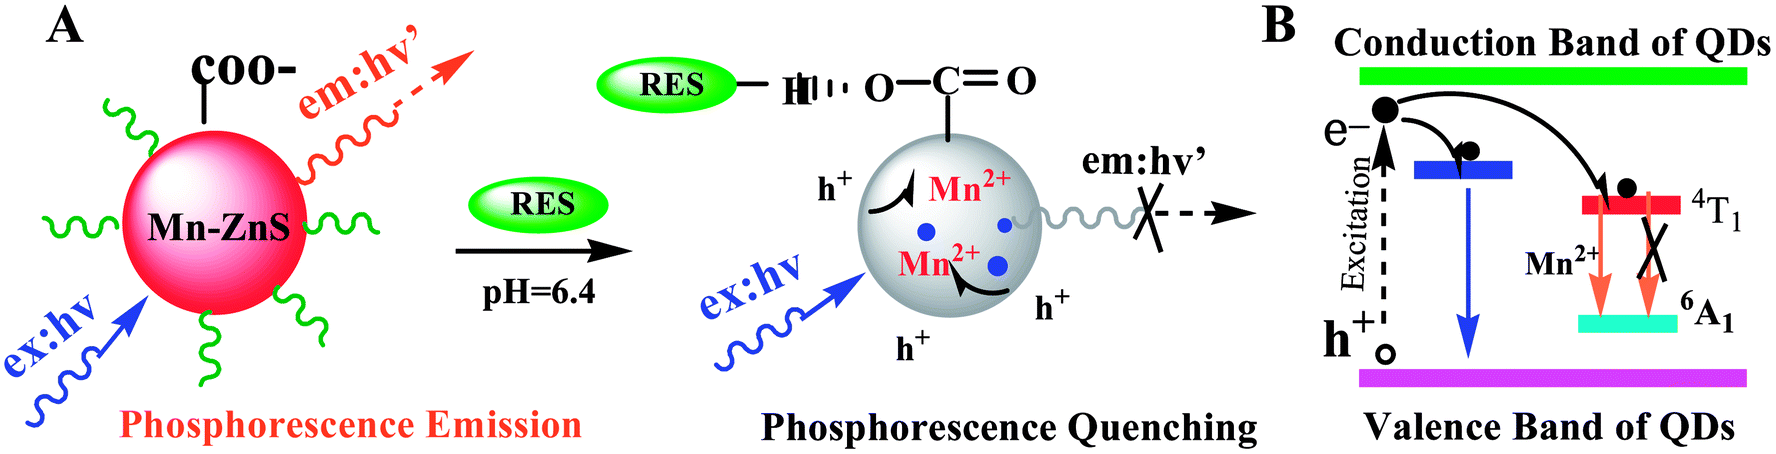 | ||
| Scheme 1 The phosphorescence quenching process of Mn:ZnS QDs by RES. | ||
3.5 Standard curves
Under optimum experimental conditions, the phosphorescence spectra of RES–QDs were studied after the addition of different amounts of RES. The resultant plots, as shown in Fig. 2c, exhibited a good linear relationship in the range from 0.03 μM to 14 μM. The detection limit was 0.01 μM. The results were compared with those of other analytical techniques (Table 3). Our method showed a lower detection limit than HPLC-UV and MIP, although HPLC-UV has a wider linear range. Also, the detection limit of this system was slightly higher than those of EC and GC-MS, but its linear range was wider. Compared with the fluorescence method, this system has a wider linear range, and the RTP suffers from less background interference, which can be used to detect RES content in actual samples. In brief, the RTP method shows excellent performance after comparing with other methods.| Methods | Detection range (M) | LOD (M) | Application | Reference |
|---|---|---|---|---|
| HPLC-UV | 2.2 × 10⁻⁸–2.2 × 10⁻⁵ | 2.2 × 10⁻⁸ | Human plasma | 19 |
| EC | 5.0 × 10⁻⁹–1.7 × 10⁻⁷ | 2.0 × 10⁻⁹ | Medicine, urine | 36 |
| GC-MS | 2.2 × 10⁻⁸–2.2 × 10⁻⁶ | 8.8 × 10⁻⁹ | Wine | 24 |
| FL | 4.4 × 10⁻⁷–2.2 × 10⁻⁵ | 8.8 × 10⁻⁹ | Human plasma | 29 |
| MIP | 6.6 × 10⁻⁸–3.3 × 10⁻⁶ | 1.9 × 10⁻⁸ | Wine | 31 |
| PL | 3.0 × 10⁻⁸–1.4 × 10⁻⁵ | 1.0 × 10⁻⁸ | Medicine, urine | This work |
3.6 Selectivity and stability of the method
In this study, the selectivity of the established RTP method for RES detection was further evaluated with the addition of possible coexisting substances. A substance with a relative deviation of less than 5% was considered as a non-interference in the assay.68,69 From Table S1,† it can be seen that 105-fold Na+, K+, Cl−, 103-fold Ca2+, Mg2+ and HCO3−, 500-fold Cu2+, 400-fold L-Gly, 300-fold serine and L-Cys, 200-fold Fe3+, Zn2+, Fe2+ and Glucose, and 100-fold Al3+, Mn2+, NH4+, Ag+, BSA and uric acid imposed no prominent influence on the system. These results demonstrated that the proposed method has acceptable selectivity, which might be implemented to detect RES in actual samples.Additional experiments were performed to test the stability. After the system was stored for 3 days at 4 °C in a fridge, only a small decrease in the response signal (approximately 6.5%) was observed, thus indicating that the sensor possesses acceptable stability.
3.7 Analysis of practical samples
RES contents in capsules and urine were detected in further standard recovery experiments; the results are given in Table 4. Excellent recoveries were obtained in the range of 96.3–104.7%; the relative standard deviations ranged from 1.92% to 3.49%, which indicated the reliability of the proposed method for the detection of RES in real samples.| Type of samples | Found (μM) | Added (μM) | Total (μM) | Recovery (%) | R.S.D. (%) (n = 3) |
|---|---|---|---|---|---|
| RES capsules | 0.3 ± 0.02 | 0.3 | 0.63 ± 0.02 | 96.3 ± 2 | 3.26 |
| 3 ± 0.03 | 3 | 5.96 ± 0.03 | 104.7 ± 3 | 2.53 | |
| Human urine | — | 0.06 | 0.06 ± 0.01 | 102.4 ± 1 | 1.92 |
| — | 6 | 5.97 ± 0.02 | 98.7 ± 3 | 3.49 |
4 Conclusions
In the present study, a facile and effective RTP method for the sensitive detection of resveratrol has been developed. The RTP of Mn:ZnS QDs enabled sensing of resveratrol in the range from 0.03 μM to 14 μM with a detection limit of 0.01 μM. In addition, we demonstrated the applications of the present approach in real samples. Therefore, this method can be promising for the detection of resveratrol in food industry and diagnostic applications.Conflicts of interest
There are no conflicts to declare.Acknowledgements
This work was supported by the Research Fund for the Doctoral Program of Higher Education of China (No.: 20111404110002) and the Fund for Construction Program of Chemical Advantage and Key Discipline of Shanxi Province of China (No.: 912019).References
- M. Abril, et al., Food Chem., 2005, 92, 729–736 CrossRef.
- A. Roldan, V. Palacios and I. Caro, J. Agric. Food Chem., 2010, 58, 4268–4273 CrossRef PubMed.
- J. A. Baur and D. A. Sinclair, Nat. Rev. Drug Discovery, 2006, 5, 493–506 CrossRef PubMed.
- J. Šmidrkal, V. Filip and K. Melzoch, et al., Chem. Listy, 2001, 95, 602–609 Search PubMed.
- P. Langcake and R. J. Pryce, Physiol. Plant Pathol., 1976, 9, 77–86 CrossRef.
- B. B. Aggarwal, A. Bhardwaj and R. S. Aggarwal, et al., Anticancer Res., 2004, 24, 2783–2840 Search PubMed.
- B. C. T. And and A. L. Waterhouse, J. Agric. Food Chem., 1996, 44, 1253–1257 CrossRef.
- A. Katsagonis, J. A. Politou and M. A. Koupparis, J. Liq. Chromatogr. Relat. Technol., 2005, 28, 1393–1405 CrossRef.
- S. B. Jones, S. E. Deprimo, M. L. Whitfield and J. D. Brooks, Cancer Epidemiol., Biomarkers Prev., 2005, 14, 596–604 CrossRef PubMed.
- C. A. Lastra and I. Villegas, Mol. Nutr. Food Res., 2005, 49, 405–430 CrossRef PubMed.
- B. Tadolini, C. Juliano, L. Piu, F. Franconi and L. Cabrini, Free Radical Res., 2000, 33, 105–114 CrossRef PubMed.
- P. A. Kroon, A. Iyer, P. Chunduri, V. Chan and L. Brown, Curr. Med. Chem., 2010, 17, 2442–2455 CrossRef PubMed.
- K. Szkudelska and T. Szkudelski, Eur. J. Pharmacol., 2010, 635, 1–8 CrossRef PubMed.
- S. Timmers, E. Konings, L. Bilet and R. H. Houtkooper, et al., Cell Metab., 2011, 14, 612–622 CrossRef PubMed.
- D. Delmas, B. Jannin and N. Latruffe, Mol. Nutr. Food Res., 2005, 49, 377–395 CrossRef PubMed.
- J. Flieger and E. Blicharska, Anal. Lett., 2016, 50, 294–303 CrossRef.
- X. L. Peng, et al., J. Huazhong Univ. Sci. Technol., Med. Sci., 2011, 31, 114–119 CrossRef PubMed.
- M. Zhou, X. Chen and D. Zhong, J. Chromatogr. B, 2007, 854, 219–223 CrossRef PubMed.
- Z. Zhu, J. Chromatogr. B: Biomed. Sci. Appl., 1999, 724, 389–392 CrossRef.
- A. I. Romero-Pérez, R. M. Lamuela-Raventós, C. Andrés-Lacueva and M. C. Torre-Boronat, J. Agric. Food Chem., 2001, 49, 210–215 CrossRef.
- F. S. Hosseinian, W. Li and T. Beta, Food Chem., 2008, 109, 916–924 CrossRef PubMed.
- D. Ly, K. Kang, J. Y. Choi, A. Ishihara and K. Back, et al., J. Med. Food, 2008, 11, 385–389 CrossRef PubMed.
- T. Luan, G. Li and Z. Zhang, Anal. Chim. Acta, 2000, 424, 19–25 CrossRef.
- R. Montes, M. Garcíalópez, I. Rodríguez and R. Cela, Anal. Chim. Acta, 2010, 673, 47–53 CrossRef PubMed.
- J. I. Cacho, N. Campillo, P. Vitas and M. Hernández-Córdoba, J. Chromatogr. A, 2013, 1315, 21–27 CrossRef PubMed.
- P. Viñas, N. Campillo, N. Martínezcastillo and M. Hernándezcórdoba, J. Chromatogr. A, 2009, 1216, 1279 CrossRef PubMed.
- L. S. Cai, J. A. Koziel, M. Dharmadhikari and J. V. Leeuwen, J. Chromatogr. A, 2008, 1216, 281–287 CrossRef PubMed.
- M. D. P. Godoycaballero, D. Airadorodríguez, I. Duránmerás and T. Galeanodíaz, Talanta, 2010, 82, 1733–1741 CrossRef PubMed.
- C. D. Bernardes, R. J. Poppi and M. M. Sena, Talanta, 2010, 82, 640–645 CrossRef PubMed.
- L. Molina-García and A. Ruiz-Medina, Anal. Chim. Acta, 2011, 689, 226–233 CrossRef PubMed.
- F. F. Chen, X. Y. Xie and Y. P. Shi, J. Chromatogr. A, 2013, 1300, 112–118 CrossRef PubMed.
- S. Mugo, B. J. Edmunds, D. Berg and N. K. Gill, Anal. Methods, 2015, 7, 9092–9099 RSC.
- C. H. Lin and Y. H. Chen, Electrophoresis, 2001, 22, 2574–2579 CrossRef PubMed.
- L. Gao, Q. Chu and J. Ye, Food Chem., 2002, 78, 255–260 CrossRef.
- P. W. Stege, L. L. Sombra, G. Messina, L. D. Martinez and M. F. Silva, Electrophoresis, 2010, 31, 2242–2248 CrossRef PubMed.
- H. Zhang, L. Xu and J. Zheng, Talanta, 2007, 71, 19–24 CrossRef PubMed.
- X. Gu, Q. Chu, M. O'Dwyer and M. Zeece, J. Chromatogr. A, 2000, 881, 471–481 CrossRef PubMed.
- P. Wu, Y. He, H. F. Wang and X. P. Yan, Anal. Chem., 2010, 82, 1427–1433 CrossRef PubMed.
- J. M. Costa-Fernández, R. Pereiro and A. Sanz-Medel, TrAC, Trends Anal. Chem., 2006, 25, 207–218 CrossRef.
- H. Yu, H. F. Wang and X. P. Yan, Chemistry, 2009, 15, 5436–5440 CrossRef PubMed.
- J. M. Traviesa-Alvarez, I. Sánchez-Barragán, J. M. Costa-Fernández, R. Pereiro and A. Sanz-Medel, Analyst, 2007, 132, 218–223 RSC.
- E. Sotelo-Gonzalez, M. T. Fernandez-Argüelles, J. M. Costa-Fernandez and A. Sanz-Medel, Anal. Chim. Acta, 2012, 712, 120–126 CrossRef PubMed.
- H. B. Ren and X. P. Yan, Talanta, 2012, 97, 16–22 CrossRef PubMed.
- H. F. Wang, Y. Y. Wu and X. P. Yan, Anal. Chem., 2013, 85, 1920–1925 CrossRef PubMed.
- J. Zheng, X. Fang, J. Qin, Z. Zhang and Y. Miao, et al., New J. Chem., 2016, 40, 3857–3862 RSC.
- Z. Zhang, Y. Miao, Q. Zhang, L. Lian and G. Yan, Biosens. Bioelectron., 2015, 68, 556–562 CrossRef PubMed.
- C. X. Yang and X. P. Yan, Anal. Chem., 2011, 83, 7144–7150 CrossRef PubMed.
- Y. Miao, J. Lv and G. Yan, Biosens. Bioelectron., 2017, 94, 263–270 CrossRef PubMed.
- Y. Miao, J. Lv, Y. Li and G. Yan, RSC Adv., 2016, 6, 110 Search PubMed.
- Y. Miao, RSC Adv., 2015, 5(94), 76804–76812 RSC.
- J. Zhuang, X. Zhang, G. Wang, D. Li and W. Yang, et al., J. Mater. Chem., 2003, 13, 1853–1857 RSC.
- Y. He, H. F. Wang and X. P. Yan, Anal. Chem., 2008, 80, 3832–3837 CrossRef PubMed.
- R. Thakar, Y. Chen and P. T. Snee, Nano Lett., 2007, 7, 3429–3432 CrossRef PubMed.
- J. Zheng, W. Ji, X. Wang and M. Ikezawa, et al., J. Phys. Chem. C, 2010, 114, 15331–15336 CrossRef.
- I. Yu, T. Isobe and M. Senna, J. Phys. Chem. Solids, 1996, 57, 373–379 CrossRef.
- W. Y. Xie, W. T. Huang, H. Q. Luo and N. B. Li, Analyst, 2012, 137, 4651–4653 RSC.
- X. Zhang, H. Zhao, Y. Xue, Z. Wu and Y. Zhang, et al., Biosens. Bioelectron., 2012, 34, 112–117 CrossRef PubMed.
- X. Wang, P. Li, Z. Liu and Y. He, Colloids Surf., A, 2013, 421, 118–124 CrossRef.
- Y. J. Hu, H. L. Yue, X. L. Li and S. S. Zhang, et al., J. Photochem. Photobiol., B, 2012, 112, 16–22 CrossRef PubMed.
- J. Wang, Y. Y. Zhang and Y. Guo, et al., Dyes Pigm., 2009, 80, 271–278 CrossRef.
- M. P. Marzocchi and G. Smulevich, Raman Spectrosc., 2003, 34, 725–736 CrossRef.
- Y. He, P. Yin and H. Gong, et al., Sens. Actuators, B, 2011, 157, 8–13 CrossRef.
- J. Peng, S. Liu, S. Yan, X. Fan and Y. He, Colloids Surf., A, 2010, 359, 13–17 CrossRef.
- X. Z. Feng, Z. Lin, L. J. Yang, C. Wang and C. L. Bai, Chin. J. Anal. Chem., 1999, 47, 1223–1229 Search PubMed.
- H. Gao, L. Lei and J. Liu, et al., J. Photochem. Photobiol., A, 2004, 167, 213–221 CrossRef.
- J. B. Zheng, H. F. Zhang, X. Q. Zhang and H. Gao, Chem. Res. Chin. Univ., 2006, 27, 1635–1639 Search PubMed.
- Y. Wu, Y. Miao, M. Yang, Y. Li and G. Yan, Acta Opt. Sin., 2016, 36(5), 0516001 CrossRef.
- Z. Liu, P. Yin and H. Gong, et al., J. Lumin., 2012, 132, 2484–2488 CrossRef.
- C. Zhou, X. Xi and P. Yang, Biochemistry, 2007, 72, 37–43 Search PubMed.
Footnote |
| † Electronic supplementary information (ESI) available. See DOI: 10.1039/c8ra02630k |
| This journal is © The Royal Society of Chemistry 2018 |