 Open Access Article
Improved analytical performance of photoionization ion mobility spectrometry for the rapid detection of organophosphorus pesticides using K0 patterns with multiple reactant ions
Qinghua Zhoua,
Bin Wanga,
Jia Lib,
Zanhui Jina,
Haiyang Li*c and
Jinyuan Chen *a
*a
aKey Laboratory of Microbial Technology for Industrial Pollution Control of Zhejiang Province, College of Environment, Zhejiang University of Technology, Hangzhou 310014, People’s Republic of China. E-mail: cjy1128@zjut.edu.cn; Fax: +86-571-88320054
bKey Laboratory of Tea Biology and Resources Utilization, Ministry of Agriculture, Tea Research Institute, Chinese Academy of Agricultural Sciences, Hangzhou 310008, People’s Republic of China
cKey Laboratory of Separation Science for Analytical Chemistry, Dalian Institute of Chemical Physics, Chinese Academy of Sciences, Dalian 116023, People’s Republic of China
First published on 16th May 2018
Abstract
Ion mobility spectrometry (IMS) has become a potential technique for the rapid detection of organophosphorus pesticides (OPPs). However, using only the commonly-used reactant ion (Ac)2H+(H2O)n, some OPPs are difficult to distinguish due to their severely overlapping ion peaks. In this study, the switching of reactant ions ((Ac)2H+(H2O)n, O2−(H2O)n and Cl−(H2O)n) in a stand-alone photoionization ion mobility spectrometer was realized by on-line switching the polarity of high voltage and dopant species. Multiple reactant ions were employed to establish the characteristic K0 patterns for the tested OPPs, including fenthion, dursban, dimethoate, malathion, fenitrothion, imidan and isocarbophos. The tested OPPs were represented on a heat map and a three-dimensional coordinate system based on the K0 patterns, from which they could be readily identified. Under optimal conditions, the limits of detection (LODs) of the tested OPPs were evaluated to be 0.3–2.7 ng, and satisfactory repeatability was demonstrated by the obtained relative standard deviations (RSDs) of 4.8% to 14.7%. Finally, Chinese cabbage extract spiked with dursban and malathion was detected by the proposed ion mobility spectrometer, demonstrating its applicability for the simultaneous identification of coexisting OPPs in real samples.
1. Introduction
Organophosphorus pesticides (OPPs) have been extensively used in agriculture due to their relatively low price and excellent ability to control pests and diseases. However, excess usage of OPPs has led to increasing residues in various environmental matrices, causing adverse effects on human health and the ecosystem.1–3 Therefore, developing rapid, simple and sensitive analytical methods for the detection of OPPs in different matrices is of great importance.So far, chromatographic methods have been most commonly used for the detection of OPPs, such as gas chromatography (GC) and high performance liquid chromatography (HPLC) with different detectors,4–9 due to their high sensitivity and selectivity. However, these methods are known to be expensive, time-consuming and laborious, preventing their application in the rapid field-screening of OPPs.
Ion mobility spectrometry (IMS), an instrumental technique in chemical analysis, has been applied in the rapid field-screening of explosives and illicit drugs in practice10–14 due to its attractive features, such as high sensitivity, fast analysis and good portability. Furthermore, in recent years, IMS has been increasingly used as a potential method for the rapid detection of OPPs.15–20 However, the resolving power of stand-alone IMS is relatively low, resulting in the overlapping ion peaks of some OPPs on ion mobility spectra, such as diazinon, parathion, fenthion and dursban20 as well as imidan, phosphamidon and isocarbophos.21 To overcome this problem, different strategies have been proposed to improve the identification of target OPPs.17,20,21 Saraji et al.20 designed a gas chromatography-corona discharge ion mobility spectrometry (GC-IMS) detection system, realizing the accurate identification of diazinon, parathion and fenthion; nevertheless, a dozen minutes were usually required for GC separation, suggesting that GC-IMS was not practical for the rapid field-screening of OPPs. Moreover, in our previous research,21 acetone was used as a dopant to boost the selectivity of positive photoionization IMS for OPP detection, accomplishing the selective detection of dimethoate and phosphamidon; however, this method failed to identify coexisting OPPs simultaneously. Therefore, it was still desirable to develop a simple and rapid method to improve the analytical performance of IMS for the identification of OPPs.
It is well-known that the reactant ions play an important role in the formation of product ions in IMS. Different reactant ions usually lead to different ionization channels and produce different product ions.22,23 For instance, when using the reactant ion O2−(H2O)n, three product ions (M − H)−, M·O2− and (M2 − H)− were observed for propofol; meanwhile, the use of an alternative reactant ion, Cl−, resulted in the formation of one product ion, M·Cl−.22 These observations suggested that a combination of multiple reactant ions would provide more spectral information, which was a benefit for improving the identification of target analytes. Dopants, including ammonia, ketones and halogenated hydrocarbons, are usually employed in IMS to produce various reactant ions.24,25 Therefore in this study, the formation of the reactant ions (Ac)2H+(H2O)n, O2−(H2O)n and Cl−(H2O)n in a stand-alone photoionization ion mobility spectrometer was realized by on-line switching the polarity of high voltage and dopant species. Using multiple reactant ions, the reduced mobility (K0) patterns of the tested OPPs were established. The main aim of this study was to identify the tested OPPs based on their K0 patterns, using the heat map and three-dimensional coordinate system. Finally, the capability of the proposed method for real samples was demonstrated by the simultaneous identification of coexisting dursban and malathion in Chinese cabbage extract.
2. Material and methods
2.1. Reagents
The dopants, acetone and dichloromethane, were of analytical grade and purchased from Tianjin Kermel Chemical Reagent Co., Ltd. (Tianjin, China). Standard solutions of 1000 mg L−1 fenthion, imidan, dursban, dimethoate and malathion and 100 mg L−1 isocarbophos and fenitrothion were purchased from AccuStandard, Inc. (New Haven, CT, USA). Lower concentrations of the OPPs were obtained by the successive dilution of standard solutions with methanol.2.2. Apparatus
In this study, homemade stand-alone polarity-switchable photoionization ion mobility spectrometry (PSP-IMS) apparatus was built, which is schematically shown in Fig. 1. The primary dopant, approximately 30 ppmv acetone, was continuously introduced into the IMS cell. In the ionization region, the acetone molecules were ionized under ultraviolet irradiation by a commercial low-pressure dc-discharge Kr lamp, producing an abundance of (Ac)2H+(H2O)n and low-energy electrons. When the IMS cell was operated in the positive mode, (Ac)2H+(H2O)n was employed as the reactant ions. When the polarity of the IMS was switched to negative, the reactant ions O2−(H2O)n were formed via the molecule–ion reactions between O2 and the low-energy electrons.23 Furthermore, in negative mode, the reactant ions O2−(H2O)n could be transformed to Cl−(H2O)n when 20 ppmv dichloromethane was introduced as the secondary dopant. As shown in Fig. 1, when valve 1 and valve 2 were opened (power-on), the dichloromethane dopant was introduced into the IMS cell by dopant gas; when these two valves were closed (power-off), the gas circuit of the dichloromethane dopant was cut off. The switching of reactant ions could be accomplished within 1 min.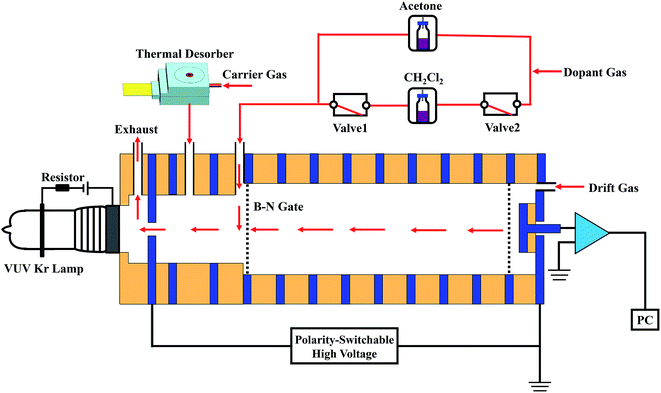 | ||
| Fig. 1 Schematic diagram of the polarity-switchable photoionization ion mobility spectrometry (PSP-IMS) with multiple reactant ions. | ||
Compressed air, purified using activated carbon, silica gel and 13× molecular sieve traps, was used as the dopant gas, carrier gas and drift gas, with flow rates of 100, 300 and 400 mL min−1, respectively. Moisture levels were kept below 1 ppmv. The IMS cell was run under an electric field of 351 V cm−1 at 100 °C.
The OPP samples were introduced into the proposed IMS apparatus using a thermal desorber. The operation details have been described in our previous work.21 The chemical analysis was accomplished within 5 s.
2.3. Calculation
As described in previous publications,21,22 the K0 values for unknown ion peaks were calculated with 1,2,4-trinitrotoluene (in negative mode) and dimethyl methylphosphonate (in positive mode) as the chemical standards.3. Results and discussion
3.1. Overlapping ion peaks of OPPs
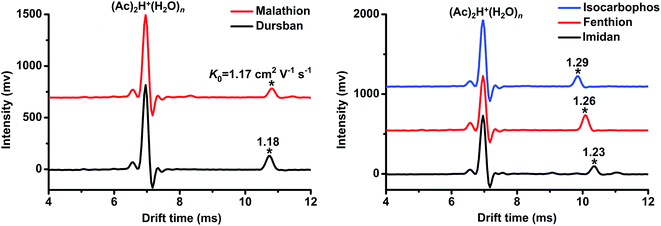
Using the commonly-used reactant ion (Ac)2H+(H2O)n,15,16,21,25 the tested OPPs including fenthion, imidan, dursban, dimethoate, isocarbophos, malathion and fenitrothion were detected. The determined K0 values are presented in Table 1, from which we can see that the product ions of each pesticide (except fenitrothion) could be detected. However, as depicted in Fig. 2, the ion peaks of dursban (K0 = 1.18 cm2 V−1 s−1) and malathion (K0 = 1.17 cm2 V−1 s−1) fully overlapped, and the peaks of imidan (K0 = 1.23 cm2 V−1 s−1), fenthion (K0 = 1.26 cm2 V−1 s−1) and isocarbophos (K0 = 1.29 cm2 V−1 s−1) were extremely close to each other. It was tough to distinguish these OPPs using only (Ac)2H+(H2O)n as the reactant ions. Therefore, this study was carried out to generate multiple reactant ions ((Ac)2H+(H2O)n, O2−(H2O)n and Cl−(H2O)n) in a stand-alone PSP-IMS, aiming to improve the identification of OPPs by establishing their reduced mobility (K0) patterns.| Analyte | K0 (cm2 V−1 s−1) | ||
|---|---|---|---|
| (Ac)2H+(H2O)n | O2−(H2O)n | Cl−(H2O)n | |
| Dursban | 1.18 | 1.66, 1.22 | 1.66 |
| Dimethoate | 1.43 | 1.51 | 1.36 |
| Fenthion | 1.26 | 1.28 | — |
| Fenitrothion | — | 1.82, 1.72, 1.34 | 1.34 |
| Malathion | 1.17 | 1.76 | 1.20 |
| Imidan | 1.23 | 1.76 | 1.76 |
| Isocarbophos | 1.29 | 1.27 | 1.19 |
3.2. Switching of the reactant ions (Ac)2H+(H2O)n, O2−(H2O)n and Cl−(H2O)n
The reactant ions (Ac)2H+(H2O)n, O2−(H2O)n and Cl−(H2O)n were on-line switchable via the following mechanisms:when the applied high voltage was positive, the reactant ions (Ac)2H+(H2O)n were produced via the photoionization of the acetone dopant,26 and then the OPP molecules were ionized by proton transfer reactions with (Ac)2H+(H2O)n, as described in reactions (1) and (2).
| 2Ac + hv + nH2O → (Ac)2H+(H2O)n + e− | (1) |
| X + (Ac)2H+(H2O)n → XH+(H2O)n−m + 2Ac + mH2O | (2) |
X = OPP molecules
When the polarity of high voltage was switched to negative, the reactant ions O2−(H2O)n were formed via reaction (3).23 The OPP molecules were ionized by molecule–ion reactions with O2−(H2O)n, as described in reaction (4).
| e− + O2 + nH2O + M → O2−(H2O)n + M | (3) |
M = N2, O2, H2O etc.
| X + O2−(H2O)n → XO2−(H2O)n−m or (X–H)−(H2O)n−m or X−(H2O)n−m + mH2O | (4) |
Meanwhile, in negative mode, the reactant ions O2−(H2O)n were further transformed to Cl−(H2O)n by introducing dichloromethane as the secondary dopant, and then the OPP molecules were ionized by molecule–ion reactions with Cl−(H2O)n, as described in reactions (5) and (6).
| O2−(H2O)n + CH2Cl2 → Cl−(H2O)n + O2 | (5) |
| Cl−(H2O)n + X → XCl−(H2O)n−m + mH2O | (6) |
3.3. Identification of tested OPPs using K0 patterns
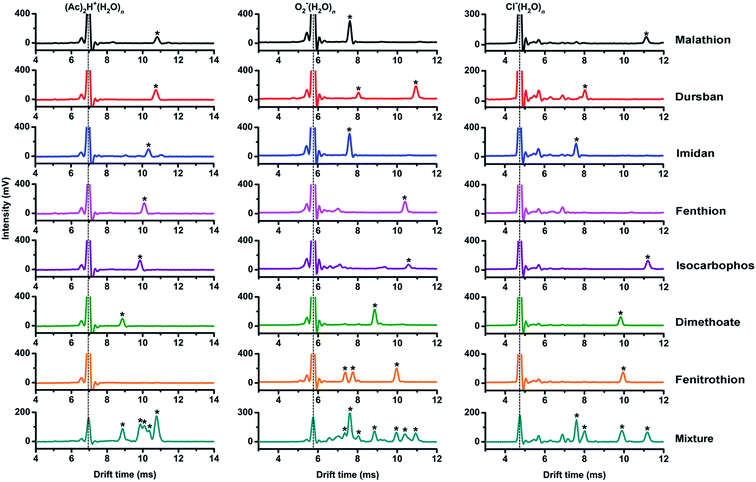
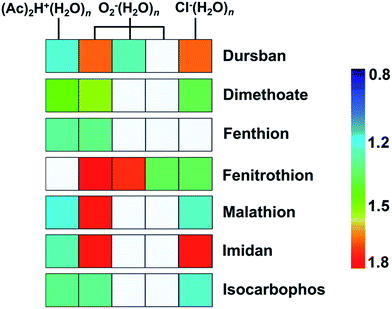
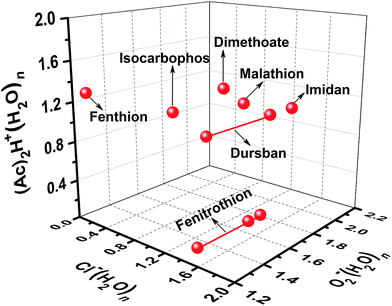
As shown in Fig. 3, the tested OPPs were detected using the proposed PSP-IMS with multiple reactant ions ((Ac)2H+(H2O)n, O2−(H2O)n and Cl−(H2O)n). The determined K0 values are summarized in Table 1. As depicted in Fig. 4, the multiple K0 values are represented in a heat map. In this figure, each pesticide was characterized by a K0 pattern with five colorimetric elements. The color differences of the K0 patterns were readily observed, promising the simultaneous identification of tested OPPs. For instance, based on the K0 patterns of dimethoate, dursban, fenitrothion and malathion in Fig. 4, dimethoate could be identified by the colorimetric elements of (Ac)2H+(H2O)n, dursban and fenitrothion could be identified by those of O2−(H2O)n and malathion could be identified by those of Cl−(H2O)n, demonstrating the capability of K0 patterns to simultaneously identify the tested OPPs.As shown in Fig. 5, the tested OPPs are presented in a three-dimensional coordinate system based on their K0 patterns, where the three axes indicate the K0 values with the reactant ions (Ac)2H+(H2O)n, O2−(H2O)n and Cl−(H2O)n, respectively. This shows an excellent 3D-separation of the tested OPPs, demonstrating the applicability of K0 patterns to improve the identification of OPPs.
In addition, it should be noted that when the reactant ions were switched from (Ac)2H+(H2O)n to O2−(H2O)n or Cl−(H2O)n, fenitrothion could be sensitively detected, indicating that the use of multiple reactant ions could also be a potential method for increasing the detectable species of OPPs in stand-alone IMS.
3.4. Optimization of the thermal desorption temperature
The thermal desorption temperature was a critical parameter for the procedure of sample introduction. In this study, the thermal desorption temperature was optimized in a range from 100 to 220 °C. As shown in Fig. 6, with an increased desorption temperature, the signal intensities of tested OPPs were enhanced initially, and then reached a maximum; after this the signal intensities gradually decreased. Finally, an optimal temperature of 160 °C was selected, which promised satisfying sensitivity for all target OPPs.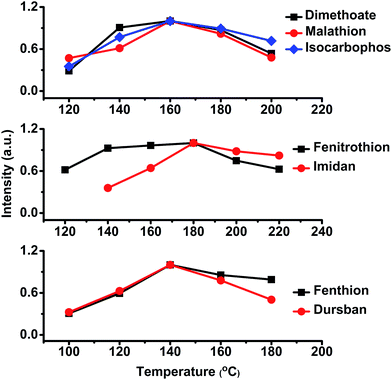 | ||
| Fig. 6 The effect of thermal desorption temperature on the signal intensity of tested OPPs. An optimal temperature of 160 °C was selected to ensure satisfying sensitivity for all target OPPs. | ||
3.5. Evaluation of method performance
Table 2 presents the analytical characteristics of the proposed method, demonstrating its good linearity for the tested OPPs. In this study, no pre-concentration procedures were employed before IMS analysis, and the limits of detection (LODs, S/N = 3) of the tested OPPs were evaluated to be 0.3–2.7 ng. Therefore, it is also desirable to develop a simple and rapid pre-concentration method for PSP-IMS, so that a sensitivity of sub-ng level for OPP analysis could be achieved. Moreover, the repeatability of the proposed method was evaluated by five replicate measurements of 20 ng tested OPPs. The relative standard deviations (RSD) ranged from 4.8% to 14.7%, demonstrating satisfactory repeatability.| Analyte | Linear range/ng | Linear equation | γ | LODs/ng |
|---|---|---|---|---|
| a In this section, fenitrothion was detected with the reactant ion O2−(H2O)n, while the other OPPs were detected with the reactant ion (Ac)2H+(H2O)n. | ||||
| Dursban | 2.0–50.0 | y = 2.08x − 4.48 | 0.997 | 0.6 |
| Dimethoate | 2.0–50.0 | y = 3.97x − 6.83 | 0.996 | 0.3 |
| Fenthion | 2.0–50.0 | y = 1.86x − 1.28 | 0.998 | 0.5 |
| Fenitrothion | 10.0–200.0 | y = 0.20x + 1.82 | 0.988 | 2.7 |
| Malathion | 2.0–100.0 | y = 2.25x + 3.52 | 0.999 | 0.5 |
| Imidan | 5.0–200.0 | y = 0.34x + 1.40 | 0.999 | 1.4 |
| Isocarbophos | 2.0–100.0 | y = 3.07x + 12.30 | 0.995 | 0.5 |
3.6. Application
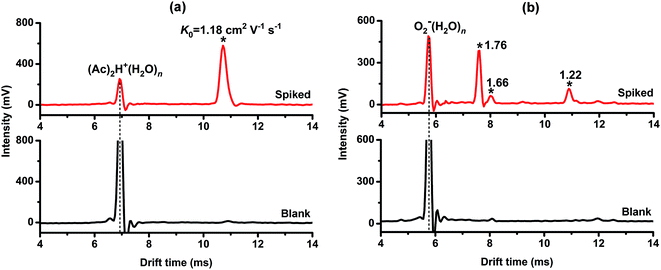
To evaluate the applicability of the proposed method for real samples, Chinese cabbage extract was obtained using the method described in our previous work.21 After spiking with 50 ng μL−1 dursban and malathion, the extract sample was detected by the proposed PSP-IMS with the reactant ions (Ac)2H+(H2O)n and O2−(H2O)n, respectively. As shown in Fig. 7(a), using the reactant ion (Ac)2H+(H2O)n a sole ion peak (K0 = 1.18 cm2 V−1 s−1) was observed for two target OPPs. Meanwhile, as shown in Fig. 7(b), when the reactant ion was switched to O2−(H2O)n, the characteristic ion peaks of dursban (K0 = 1.66 and 1.22 cm2 V−1 s−1) and malathion (K0 = 1.76 cm2 V−1 s−1) were observed. Based on the comprehensive ion mobility spectra, dursban and malathion in Chinese cabbage extract were readily identified. The recoveries of malathion and dursban were evaluated to be 84.1% and 81.9%, respectively. In addition, the blank Chinese cabbage extract was tested as a comparison. It was notable that few ion peaks were observed for the blank extract, suggesting no significant matrical interferences in the identification of the target OPPs. These results demonstrated the applicability of the proposed method for the simultaneous identification of coexistent OPPs in real samples.4. Conclusions
In this study, the formation of the reactant ions (Ac)2H+(H2O)n, O2−(H2O)n and Cl−(H2O)n was realized in a stand-alone polarity-switchable photoionization ion mobility spectrometer by simply switching the polarity of high voltage and dopant species. By using multiple reactant ions, K0 patterns of the tested OPPs were established. To the best of our knowledge, this is the first time that these K0 patterns have been represented in a heat map, from which the differences could be readily observed, promising the simultaneous identification of the tested OPPs. Additionally, the tested OPPs exhibited excellent separation in a three-dimensional coordinate system based on their K0 patterns, demonstrating the capability of the K0 patterns to improve the identification of OPPs. The applicability of the proposed IMS for the simultaneous identification of coexisting OPPs in real samples was also demonstrated. Furthermore, the application of multiple reactant ions could also be a potential method for increasing the detectable species of OPPs in stand-alone IMS.Conflicts of interest
There are no conflicts to declare.Acknowledgements
This work is partly supported by the Natural Science Foundation of China (No. 21607129), the China Postdoctoral Science Foundation (No. 2016M601967) and the Zhejiang Provincial Natural Science Foundation of China (No. LZ15B07000).References
- D. B. Barr, R. Allen, A. O. Olsson, R. Bravo, L. M. Caltabiano, A. Montesano, J. Nguyen, S. Udunka, D. Walden, R. D. Walker, G. Weerasekera, R. D. Whitehead, S. E. Schober and L. L. Needham, Environ. Res., 2005, 99, 314–326 CrossRef PubMed.
- J. G. Young, B. Eskenazi, E. A. Gladstone, A. Bradman, L. Pedersen, C. Johnson, D. B. Barr, C. E. Furlong and N. T. Holland, NeuroToxicology, 2005, 26, 199–209 CrossRef PubMed.
- S. Y. Wee and A. Z. Aris, Chemosphere, 2017, 188, 575–581 CrossRef PubMed.
- H. M. Albishri, N. A. M. Aldawsari and D. A. El-Hady, Electrophoresis, 2016, 37, 2462–2469 CrossRef PubMed.
- S. Mahpishanian and H. Sereshti, J. Chromatogr. A, 2016, 1443, 43–53 CrossRef PubMed.
- A. Salemi, R. Rasoolzadeh, M. M. Nejad and M. Vosough, Anal. Chim. Acta, 2013, 769, 121–126 CrossRef PubMed.
- L. Wu, Y. Song, M. Hu, H. Zhang, A. Yu, C. Yu, Q. Ma and Z. Wang, Food Chem., 2015, 176, 197–204 CrossRef PubMed.
- Z. Xiao, M. He, B. Chen and B. Hu, Talanta, 2016, 156–157, 126–133 CrossRef PubMed.
- Z.-L. Xu, H. Deng, X.-F. Deng, J.-Y. Yang, Y.-M. Jiang, D.-P. Zeng, F. Huang, Y.-D. Shen, H.-T. Lei, H. Wang and Y.-M. Sun, Food Chem., 2012, 131, 1569–1576 CrossRef.
- T. Khayamian, M. Tabrizchi and M. Jafari, Talanta, 2006, 69, 795–799 CrossRef PubMed.
- S. Cheng, J. Dou, W. Wang, C. Chen, L. Hua, Q. Zhou, K. Hou, J. Li and H. Li, Anal. Chem., 2013, 85, 319–326 CrossRef PubMed.
- G. R. Asbury, J. Klasmeier and H. H. Hill, Talanta, 2000, 50, 1291–1298 CrossRef PubMed.
- R. G. Ewing, D. A. Atkinson, G. A. Eiceman and G. J. Ewing, Talanta, 2001, 54, 515–529 CrossRef PubMed.
- P. Guerra-Diaz, S. Gura and J. R. Almirall, Anal. Chem., 2010, 82, 2826–2835 CrossRef PubMed.
- M. T. Jafari, Talanta, 2006, 69, 1054–1058 CrossRef PubMed.
- T. L. Yao, G. Yan and Q. L. Miao, Anal. Chem., 1998, 70, 347–352 CrossRef.
- M. T. Jafari, M. Saraji and H. Sherafatmand, Anal. Chim. Acta, 2014, 814, 69–78 CrossRef PubMed.
- A. Ebrahimi and M. T. Jafari, Talanta, 2015, 134, 724–731 CrossRef PubMed.
- M. Saraji, M. T. Jafari and M. Mossaddegh, Anal. Chim. Acta, 2016, 926, 55–62 CrossRef PubMed.
- M. Saraji, M. T. Jafari and M. Mossaddegh, J. Chromatogr. A, 2016, 1429, 30–39 CrossRef PubMed.
- Q. Zhou, J. Li, B. Wang, S. Wang, H. Li and J. Chen, Talanta, 2018, 176, 247–252 CrossRef PubMed.
- Q. Zhou, L. Hua, C. Wang, E. Li and H. Li, J. Am. Soc. Mass Spectrom., 2015, 26, 190–193 CrossRef PubMed.
- S. Cheng, W. Wang, Q. Zhou, C. Chen, L. Peng, L. Hua, Y. Li, K. Hou and H. Li, Anal. Chem., 2014, 86, 2687–2693 CrossRef PubMed.
- V. Moll, V. Bocoş-Binţinţan, I.-A. Raţiu, D. Ruszkiewicz and C. L. P. Thomas, Analyst, 2012, 137, 1458–1465 RSC.
- E. Waraksa, U. Perycz, J. Namieśnik, M. Sillanpää, T. Dymerski, M. Wójtowicz and J. Puton, TrAC, Trends Anal. Chem., 2016, 82, 237–249 CrossRef.
- D. Jiang, L. Peng, M. Wen, Q. Zhou, C. Chen, X. Wang, W. Chen and H. Li, Anal. Chem., 2016, 88, 4391–4399 CrossRef PubMed.
| This journal is © The Royal Society of Chemistry 2018 |

