 Open Access Article
Enhanced catalytic activity of monodispersed porous Al2O3 colloidal spheres with NiMo for simultaneous hydrodesulfurization and hydrogenation
Kaihong Xie,
Yanxiong Fang,
Baoyu Liu * and
Chengchao Li*
Faculty of Chemical Engineering and Light Industry, Guangdong University of Technology, Guangzhou, China 510009. E-mail: baoyu.liu@gdut.edu.cn; licc@gdut.edu.cn
First published on 17th May 2018
Abstract
Novel composites made from monodispersed porous Al-glycolate spheres (NiMo/Al-SP) were synthesized through alcoholysis or hydrolysis treatments. The obtained samples were characterized by a complementary combination of X-ray diffraction (XRD), Fourier transform infrared spectroscopy (FT-IR), N2 physisorption, scanning electron microscopy (SEM), transmission electron microscopy (TEM), hydrogen temperature-programmed reduction (H2-TPR), and pyridine Fourier transform infrared spectroscopy (Py FT-IR). In addition, the catalytic performances of the resultant catalysts were evaluated in the simultaneous HDS of dibenzothiophene (DBT) and HYD of naphthalene (DBT and naphthalene represent the sulfur-containing compounds and polycyoalkanes, respectively). The experimental results showed that, 71.22% DBT and 88.28% naphthalene were converted by NiMo/Al-SP(H) under the conditions of 270 °C temperature, 5 MPa H2 (initial pressure at room temperature) and 10 h reaction time. The design and preparation of NiMo/Al-SP provide an effective and novel pathway for the development of high-performance catalysts and production processes.
1 Introduction
In recent years, due to the decline of crude oil's quality, environmental issues resulting from the combustion of sulfur and polycyclic aromatic containing fossil fuels have been the cause of greater concern.1,2 Therefore, in many countries, more and more stringent environmental legislation has been enforced for the transportation of fuels to limit the amount of polycyclic aromatic compounds and heteroatoms, such as sulfur, oxygen and nitrogen in fossil fuels.3–5 The hydrogenation process (HYD) is one of the most efficient and conventional industrial methods to remove sulfur-containing and polycyclic aromatic compounds from fossil fuels, so that they would meet the new emission specifications for exhaust gases. The activities of catalysts for hydrogenation play a very important role in obtaining ultra-clean products. Therefore, it is important to design and develop new catalysts with high HDS and HYD activity to produce clean diesel.It is well known that traditional hydrotreating catalysts are composed of supported active components, such as MoS2 or WS2 particles promoted with either nickel (Ni) or cobalt (Co) on the support material.6–8 The support plays a key role in the hydrotreating process, and not only helps the dispersion of the active phase, but also influences the properties of active components.9–11 Until now, remarkable attention has been paid to developing novel materials that could be used as support materials. Some examples include metal oxides (Al2O3, TiO2, ZrO2),12–14 ordered mesoporous materials (MCM-41, SBA-15, KIT-6)15,16 and carbon materials.10,17,18 Although these materials showed excellent properties for hydrotreament processes, their further application is restricted owing to their low specific area, low hydrothermal stability, weaker acidity, and lower metal–support interaction for carbon materials.
Al2O3 is the most widely used support material in the petroleum industries due to its adjustable pore structure and good mechanical strength.2,19 However, conventional Al2O3 has some obvious disadvantages, such as low surface area, and broad pore size distribution, which restricts its commercial application. Therefore, many efforts have been devoted to developing new methods to prepare Al2O3 having excellent properties. Rashidi et al.11 prepared nanostructured alumina, and used it as a support in ultra-deep hydrodesulphurization of diesel fuels. The surface area of as-prepared alumina was 403 m2 g−1, while the pore size was 10 nm. Furthermore, the corresponding catalysts exhibited high HDS activity. Badoga et al.14 have synthesized a series of mesoporous alumina with different pore sizes, and the resulting NiMo catalysts were used for hydrotreating heavy gas oil. They found that the NiMo/Meso-Al-0.6 showed the highest activity among various alumina-based support materials due to its special physicochemical properties, highest metal dispersion and weak acidic sites.
It is well known that the morphology and composition of catalysts are important to influence the activity and selectivity of the catalyst.20,21 The morphology and pore size of supports are important for the diffusion of reactant and product molecules and for the dispersion of active phase, which are vital for the catalytic activity.22,23 J. N. D. de León et al.24 prepared 1D-Al2O3 nanorods as an efficient catalyst for HDS, and the corresponding catalysts exhibited higher activities compared to the conventional NiMo/Al2O3. The results showed that the nanorods with plane (110) were favorable for WS2 slabs, and allowed the formation of W–S–Al bonds. Gao et al.25 compared different morphologies of SBA-15 with spheres, rods and hexagonal prisms, and the corresponding catalysts were tested for the hydrodesulphurization of DBT. The results showed that the spherical catalyst exhibited highest activities because of the suitable meso-channels and high dispersion of active phase.
Generally speaking, the metal–support interaction and the dispersion of active phase are influenced by the physicochemical properties and the shape of support, which dramatically enhance the activity of a catalyst. Besides, the textural and acidic properties of a support also play an important role in the activity of the hydrotreating catalysts. However, studies focusing on the adjustment of physicochemical properties and acidic sites of catalysts during the preparation of porous Al2O3 with controllable morphology are still scarce in literature.
In this work, two kinds of novel porous Al-glycolate spheres with tuneable acidity and texture properties were prepared for the simultaneous HDS of dibenzothiophene (DBT) and HYD of naphthalene to investigate the effect of acidity and texture on catalytic properties. The results showed that the acidity exhibited a strong effect on the hydrogenation of naphthalene. Interestingly, the hydrolysis and alcoholysis played key roles in the preparation of monodispersed porous colloidal spheres. The physicochemical properties and the surface acidity of Al-glycolate spheres (Al-PS) can be tuned using different treatment pathways of Al-glycolate spheres. Additionally, the corresponding NiMo catalysts were tested in hydrodesulphurization and hydrogenation reaction using dibenzothiophene and naphthalene as the probe compounds. The effect of reaction time on the DBT and naphthalene were investigated over these catalysts.
2 Experimental
2.1 Materials
Aluminum isopropoxide (Al(OPri)3) and polyvinylpyrrolidone (PVP; molecular weight (MW) = 58![[thin space (1/6-em)]](https://www.rsc.org/images/entities/char_2009.gif) 000 g mol−1) were purchased from Aladdin, China. Nitric acid (HNO3; 65–68 wt%), ethylene glycol (EG) and acetone (C2H5O) were purchased from Guangzhou Chemical Reagent Factory, China. Ethanol (C2H5OH), urea (CO(NH2)2), nickel nitrate (Ni(NO3)2·6H2O), naphthalene (C12H10) and heptane (C7H16) were purchased from Damao Chemical Reagent Factory, China. Dibenzothiophene (C12H8S) was purchased from J&K, China. Ammonium molybdate ((NH4)6Mo7O24·4H2O) was purchased from Tianjin Kemiou Chemical Reagent Co., China. Nano-Al2O3 was purchased from Aladdin, China. All reagents were used as received without any further purification.
000 g mol−1) were purchased from Aladdin, China. Nitric acid (HNO3; 65–68 wt%), ethylene glycol (EG) and acetone (C2H5O) were purchased from Guangzhou Chemical Reagent Factory, China. Ethanol (C2H5OH), urea (CO(NH2)2), nickel nitrate (Ni(NO3)2·6H2O), naphthalene (C12H10) and heptane (C7H16) were purchased from Damao Chemical Reagent Factory, China. Dibenzothiophene (C12H8S) was purchased from J&K, China. Ammonium molybdate ((NH4)6Mo7O24·4H2O) was purchased from Tianjin Kemiou Chemical Reagent Co., China. Nano-Al2O3 was purchased from Aladdin, China. All reagents were used as received without any further purification.
2.2 Preparation of materials
![[thin space (1/6-em)]](https://www.rsc.org/images/entities/char_2009.gif) :
:![[thin space (1/6-em)]](https://www.rsc.org/images/entities/char_2009.gif) 1, respectively), which was followed by the addition of 4 mmol urea (CO(NH2)2). Then, the mixture was stirred for 60 min. The resultant mixture was placed in a 200 ml Teflon-lined stainless-steel autoclave and heated to 120 °C for 12 h. The product was collected, washed with 95% ethanol, and dried at 70 °C. It was then calcined at 550 °C for 8 h. The obtained product without calcination was denoted as Al-glycolate spheres (H), while the calcined product was denoted as Al-SP (H).
1, respectively), which was followed by the addition of 4 mmol urea (CO(NH2)2). Then, the mixture was stirred for 60 min. The resultant mixture was placed in a 200 ml Teflon-lined stainless-steel autoclave and heated to 120 °C for 12 h. The product was collected, washed with 95% ethanol, and dried at 70 °C. It was then calcined at 550 °C for 8 h. The obtained product without calcination was denoted as Al-glycolate spheres (H), while the calcined product was denoted as Al-SP (H).2.3 Characterization
X-ray powder diffraction (XRD) was carried out on Bruker DS advance unit with Cu Kα radiation. Fourier transform infrared spectroscopy (FT-IR) was carried out using a Bruker Fourier transform infrared spectrometer, which used potassium bromide (KBr) pellet technique within the range of 500–4000 cm−1. The nitrogen adsorption–desorption measurements of the materials were performed on a Micromeritics ASAP2450 analyzer at −196 °C. Scanning electron microscopy (SEM) and transmission electron microscopy (TEM) were used to investigate the morphology and microstructure of Al-glycolate spheres, respectively. Scanning electron microscopy (SEM) images of the as-synthesized materials were obtained using a Hitachi S3400N instrument. Transmission electron microscopy (TEM) micrographs of as-prepared materials were obtained using a Hitachi HT7700 instrument. Hydrogen temperature-programmed reduction (H2-TPR) was used to investigate the reducibility of as-prepared catalysts, while the oxide samples were pretreated in argon atmosphere at 300 °C for 1 h. As the temperature decreased to 80 °C, the argon flow was switched to a H2/Ar (5/95; v/v) flow (50 ml min−1). The samples were then heated to 800 °C at the heating rate of 20 °C min−1. Fourier transform infrared spectroscopy (FT-IR) of adsorbed pyridine was used to determine the type and strength of acidic sites of catalysts. Before the tests, the samples were degassed under vacuum at 400 °C for 2 h, and then, cooled and exposed to pyridine atmosphere. After adsorption, the infrared spectrum was recorded at 200 °C and 350 °C. The amount of L acidic sites and B acidic sites were calculated as follows.C (pyridine on L acidic sites) = 1.42 IA (L) R2/W, where C = concentration (mmol g−1), IA (L) = integrated area of L band (cm−2), R = radius of sample disk (cm), W = weight of disk (mg).
C (pyridine on B acidic sites) = 1.88 IA (B) R2/W, where C = concentration (mmol g−1), IA (B) = integrated area of L band (cm−2), R = radius of sample disk (cm), W = weight of disk (mg).
The X-ray photoelectron spectra (XPS) of the sulfided catalysts were acquired on a Thermo Scientific spectrometer. The sulfided catalysts were prepared under the same conditions as the catalytic activity evaluation in the following section.
2.4 Performance of catalysts
The activities of the as-prepared catalysts for dibenzothiophene's HDS and the hydrogenation of naphthalene were assessed in a batch reactor using dibenzothiophene (1268 ppm of S) and 10 wt% naphthalene in heptane as the model compounds. Prior to testing the performance of catalysts, 60 mg of catalysts' precursor was placed inside the batch reactor containing sulfide at 250 °C and 3 MPa H2 (initial pressure at room temperature) for 6 h using a heptane solution of CS2 (3 wt%). After pre-sulfurization, the catalyst's performance was determined in a 100 ml stainless steel autoclave at 270 °C and 5 MPa H2 (initial pressure at room temperature) for 8 h using a heptane solution of DBT (1268 ppm of S) and naphthalene (10 wt%). Additionally, the reactant and liquid product were analyzed using an Agilent 7820A gas chromatograph, which was equipped with a DB-624 capillary column (30 m × 0.25 mm) and flame ionization detector (FID). The activity of the catalysts was determined according to the following equation.| χS (%) = [(CS0 − CS)/CS0] × 100, | (1) |
| χN (%) = [(CN0 − CN)/CN0] × 100, | (2) |
3 Results and discussion
3.1 Characterizations
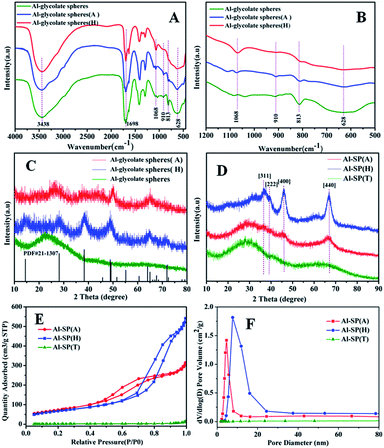
Fig. 1(A) and (B) showed the FT-IR spectra of Al-glycolate spheres, Al-glycolate spheres (H) and Al-glycolate spheres (A). The bands centered at 1698 cm−1 were attributed to the stretching vibration of O–C![[double bond, length as m-dash]](https://www.rsc.org/images/entities/char_e001.gif) O.27 The bands at 1068 cm−1 were attributed to the stretching vibration of Al–OH.22 The bands at 910, 813, and 628 cm−1 were attributed to the chelation of carboxylate oxygen to central metal.26 These results showed that the Al-glycolate spheres were coordination compounds, composed of carboxylate group and Al ion.26 Besides, it can be noticed that the chelating carboxylate oxygen decreased in intensity after the hydrolysis or alcoholysis treatment of Al-glycolate spheres, while the intensity of Al–OH increased. The intensity of Al–OH exhibited the following ascending order: Al-glycolate spheres (H) > Al-glycolate spheres (A) > Al-glycolate spheres. On the contrary, the intensity of chelating carboxylate oxygen followed the following descending order: Al-glycolate sphere (H) < Al-glycolate sphere (A) < Al-glycolate sphere. These results showed that, for Al-glycolate spheres treated with either water or ethanol, the carboxylate groups were gradually replaced by the hydroxyl groups (Table 1).
O.27 The bands at 1068 cm−1 were attributed to the stretching vibration of Al–OH.22 The bands at 910, 813, and 628 cm−1 were attributed to the chelation of carboxylate oxygen to central metal.26 These results showed that the Al-glycolate spheres were coordination compounds, composed of carboxylate group and Al ion.26 Besides, it can be noticed that the chelating carboxylate oxygen decreased in intensity after the hydrolysis or alcoholysis treatment of Al-glycolate spheres, while the intensity of Al–OH increased. The intensity of Al–OH exhibited the following ascending order: Al-glycolate spheres (H) > Al-glycolate spheres (A) > Al-glycolate spheres. On the contrary, the intensity of chelating carboxylate oxygen followed the following descending order: Al-glycolate sphere (H) < Al-glycolate sphere (A) < Al-glycolate sphere. These results showed that, for Al-glycolate spheres treated with either water or ethanol, the carboxylate groups were gradually replaced by the hydroxyl groups (Table 1).
The XRD patterns are displayed in Fig. 1(C) and (D). The as-prepared Al-glycolate spheres (X) (X = A, H and T) are shown in Fig. 1(C). It can be clearly seen that Al-glycolate spheres did not exhibit any diffraction peaks that can be attributed to the amorphous nature of Al-glycolate spheres. The XRD pattern of Al-glycolate spheres (H) exhibited five diffraction peaks at 14.06°, 28.32°, 38.42°, 49.24° and 64.74° corresponding to (020), (120), (031), (200) and (171), which were ascribed to the typical peak of boehmite phase.28 Compared with the Al-glycolate spheres (H), the XRD pattern of Al-glycolate spheres (A) showed four peaks at 28.78°, 38.1°, 49.9° and 64.88°, which were assigned to the diffraction peak of boehmite. However, the intensity of diffraction peaks of Al-glycolate spheres (H) were stronger than Al-glycolate spheres (A) owing to the difference in decomposition of Al-glycolate spheres coordination compound.
Fig. 1(D) shows the XRD pattern of the calcined material at 550 °C. It can be seen that the Al-SP (T) displayed two very broad diffraction peaks, which confirmed the amorphous nature of Al-glycolate spheres treated without hydrolysis or alcoholysis. This phenomenon can be explained that the additional carboxylate groups inhibit the crystallization of Al2O3.29,30 The as-synthesized sample treated with ethanol showed XRD peaks at 45.9° and 66.8°, which corresponded to (440) and (400), and were attributed to the γ-Al2O3 (JCPDS card no. 10-0425). The XRD of hydrolysis sample displayed diffraction peaks at 37.09°, 39.44°, 45.9° and 66.8°, corresponding to (311), (322), (400) and (440), and were attributed to the typical diffraction peaks of γ-Al2O3. While, the intensity of diffraction peaks of γ-Al2O3 derived from hydrolysis of Al-glycolate spheres was stronger than the alcoholysis of Al-glycolate.
The nitrogen adsorption–desorption isotherms and the corresponding pore size distributions for the as synthesized samples are shown in Fig. 1(E) and (F), respectively. For the sample of Al-SP (T), the hysteresis loop could not be observed in the isotherms, which indicated that the Al-glycolate spheres (T) did not possess any mesoporous structure. In addition, the results also confirmed that the Al-glycolate spheres without alcoholysis or hydrolysis treatment could not produce any mesoporous structure. For the sample of Al-SP (A) and Al-SP (H), the isotherms exhibited Type IV curves with an H3 hysteresis loop indicative of a mesoporous structure.31 These results were different from the Al-SP (T), indicating that the Al-glycolate spheres treated with ethanol or water could produce mesoporous structure. The surface area showed the following order: Al-SP (T) (8.5 m2 g−1) < Al-SP (H) (243 m2 g−1) < Al-SP (A) (267 m2 g−1). However, the pore sizes were found to be in the following order: Al-SP (T) (18 nm) > Al-SP (H) (10 nm) > Al-SP (A) (5.8 nm). And the pore volume showed the following order: Al-SP (H) (0.84 cm3 g−1) > Al-SP (A) (0.49 cm3 g−1) > Al-SP (T) (0.023 cm3 g−1).
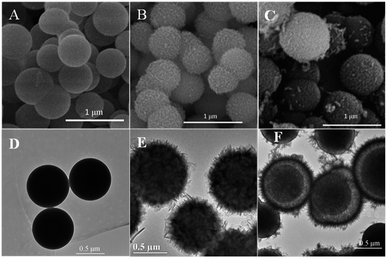
The SEM and TEM micrographs of the as-prepared materials are presented in Fig. 2. As can be seen in Fig. 2(A–C), all the samples exhibited monodispersed sphere-like morphologies, indicating that the colloidal spheres treated with water or ethanol did not change their shape. Compared with the Al-glycolate spheres, the colloidal spheres treated with water or ethanol exhibited spherical shape with coarse surface. Different from the Al-glycolate spheres, the Al-glycolate spheres (A) exhibited wrinkled surfaces.
The TEM analysis was used to further investigate the detailed morphology and structure of the as-prepared colloidal spheres. As shown in Fig. 2(D–F), all the as-prepared samples exhibited mono-disperse spherical shape. For the sample of Al-glycolate spheres (shown in Fig. 5(D)), it is clearly observed that the colloidal spheres were solid spheres with smooth surface. The TEM images of Al-glycolate spheres (A) (shown in Fig. 5(E)) clearly show that the uniform porous acanthosphere is composed of nanoflakes. Compared with the Al-glycolate spheres (A), the Al-glycolate spheres (H) (shown in Fig. 5(F)) exhibited non-uniformity in shape, and consisted of porous spheres, core–shell fluff ball structure and hollow spheres.
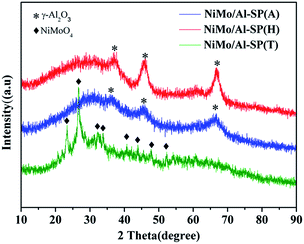
As shown Fig. 3, the characteristic peak positions of NiMo/Al-SP (A) and NiMo/Al-SP (H) at 2θ = 66.8°, 45.9° and 37.09° were attributed to γ-Al2O3 (JCPDS card no. 10-0425). Meanwhile, the NiMo/Al-SP (A) and NiMo/Al-SP (H) did not show the presence of any diffraction peaks related to Ni and Mo species, which indicated that the active phase was well dispersed in the support.19,32 In comparison, for the sample of Al-SP (T), the diffraction peaks appeared at 23.32°, 26.67°, 32.15°, 33.70°, 40.60°, 43.89°, and 47.76°, which belonged to the β-NiMoO4 phase (JCPDS card no. 45-0142).33 These results can be attributed to the overloading of Ni and Mo species,19 indicating that most of the Ni and Mo species were agglomerated on the support.
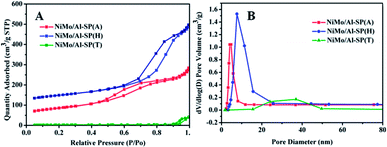
The N2 adsorption–desorption isotherm and BJH pore size distributionof NiMo/Al-SP (X) (X = A, H and T) are shown in Fig. 4. As can be seen from Fig. 4, all the three NiMo/Al-SP (X) catalysts exhibited Type IV curves with an H3 hysteresis loop. Comparing with the Al-SP (T) support, the NiMo/Al-SP (T) catalyst exhibited hysteresis loop at relatively high pressure and showed relatively broader pore size distribution. Besides, the pore size distributions of NiMo/Al-SP (T) were relatively broad due to the disordering of the pore size structure.34 Compared with the support, the surface area, pore volume and pore sizes of NiMo/Al-SP (A) and NiMo/Al-SP (H) decreased due to the introduction of active phase.
The H2-TPR was used to study the reducibility of the as-prepared NiMo/Al-SP (X) (X = A, H and T) catalysts, and the results are shown in Fig. 5. As can be seen from Fig. 5, the NiMo/Al-SP (T) showed two reduction peaks. The low temperature peak at 475 °C was assigned to the polymeric Mo species (from Mo6+ to Mo4+)14,34 and the reduction of Ni species,35 while the high temperature peak at 677 °C was attributed to the deep reduction of Mo4+ to Mo0. For NiMo/Al-SP (A) and NiMo/Al-SP (H), the TPR profiles displayed two main reduction peaks and one shoulder peak. The first temperature peak, lower than 400 °C, was assigned to Ni2 to Ni0,32 while the high temperature peak (in the range 700–800 °C) was assigned to deep reduction of tetrahedrally coordinate monomeric Mo species (from Mo4+ to Mo0).34 Furthermore, the shoulder peak (in the range of 500–600 °C) was attributed to the octahedral coordination of Mo species.36 Compared with NiMo/Al-SP (A) and NiMo/Al-SP (H), the lower reduction temperature of NiMo/Al-SP (T) had higher H2 consumption, which can be caused by the larger number of poorly dispersed Mo species.36 This has been confirmed through aforementioned XRD results. In addition, in the low temperature region between 500–600 °C, compared with the NiMo/Al-SP (H), NiMo/Al-SP (A) exhibited a lower reduction temperature, which indicated the weaker metal–support interaction, leading to higher reducibility. This phenomenon can be explained that the Al-SP (A) was more easy to interact with Mo species than Al-SP (H) owing to the lower number of Al–OH on Al-SP (A) compared with Al-SP (H).34
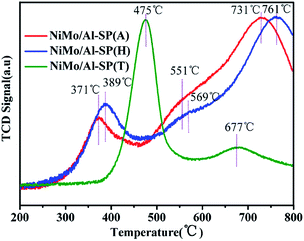 | ||
| Fig. 5 Temperature-programmed reduction profiles of NiMo/Al-SP (A), NiMo/Al-SP (H) and NiMo/Al-SP (T) catalysts. | ||
To identify the type and strength of acidic sites in NiMo/Al-SP (A), NiMo/Al-SP (H), NiMo/Al-SP (T), pyridine-IR was conducted at 200 °C and 350 °C within the wavelength of 1700–1400 cm−1. The corresponding results are shown in Fig. 6. There were three bands positioned at about 1450 cm−1, 1577 cm−1, and 1612 cm−1, which were assigned to the pyridine adsorbed onto L acidic sites.1,37 The band positioned at 1541 cm−1 was attributed to pyridine adsorbed onto B acidic sites, while that position at 1492 cm−1 was ascribed to the pyridine adsorbed on both L and B acidic sites.38 According to a previous study,39 the number of L and B acidic sites for the three catalysts can be calculated from the spectra of pyridine adsorption, the corresponding results are shown in the Table 3. The intensity of the spectra showed the following order: NiMo/Al-SP (H) (151.5 μmol g−1) > NiMo/Al-SP (A) (111.3 μmol g−1) > NiMo/Al-SP (T) (0 μmol g−1). As can be seen from Fig. 6(A), there are no peaks for the NiMo/Al-SP (T). Compared with NiMo/Al-SP (T), both the NiMo/Al-SP (A) and NiMo/Al-SP (H) exhibited L acidic sites and B acidic sites. Besides, the intensity of B acidic sites of NiMo/Al-SP(H) was stronger than that for the NiMo/Al-SP (A), which may have been caused by the difference in degree of dissociation of Al-glycolate spheres. It means that the number of bridging hydroxyl groups was different from both the Al-SP (A) and Al-SP (H). These results are also confirmed by the previous FT-IR results, as shown in Fig. 1(B).
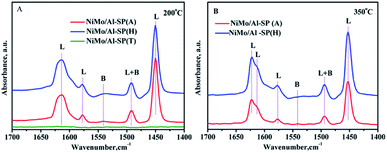 | ||
| Fig. 6 FTIR spectra of pyridine adsorbed on different catalysts after degassing at (A) 200 °C and (B) 350 °C. | ||
| Catalysts | Amount of acid sites (μmol g−1) | |||||
|---|---|---|---|---|---|---|
| 200 °C | 350 °C | |||||
| L | B | L + B | L | B | L + B | |
| NiMo/Al-SP (A) | 108.1 | 3.2 | 111.3 | 39.9 | 0.4 | 40.3 |
| NiMo/Al-SP (H) | 139.2 | 12.3 | 151.5 | 68.8 | 1.7 | 70.5 |
| NiMo/Al-SP (T) | 0 | 0 | 0 | — | — | — |
The Mo 3d XPS spectra of sulfide catalysts were tested and the results were shown in the Fig. 7. The related parameters are summarized in Table 4. According to the previous research,19,34 the peak at 228.7 ± 0.2 eV and 231.9 ± 0.2 eV are assigned to the 3d5/2 and 3d3/2 of Mo4+ with fix intensity ratio of 3![[thin space (1/6-em)]](https://www.rsc.org/images/entities/char_2009.gif) :
:![[thin space (1/6-em)]](https://www.rsc.org/images/entities/char_2009.gif) 2. The peak at 230.4 ± 0.4 eV and 233.6 ± 0.4 eV are related to the Mo5+ in the MoSxOy, The peak at 232.5 ± 0.3 eV and 235.7 ± 0.3 eV corresponds to the Mo6+ oxides species. Finally, the peak at 226.5 eV is belonged to the S2−. The sulfidation degree of Mo is calculated by that Mo4+/(Mo4+ + Mo5+ + Mo6+) and the results are shown in the Table 4. As shown in the Table 4, the sulfidation degree of NiMo catalysts are followed the order: NiMo/Al-SP (T) (54.13%) > NiMo/Al-SP (H) (39.89%) > NiMo/Al-SP (A) (33.09%). The NiMo/Al-SP (T) exhibited the highest sulfidation degree, which could be assigned to the lowest interaction between active phases and Al-SP (T), which is in consistent with the H2-TPR results.
2. The peak at 230.4 ± 0.4 eV and 233.6 ± 0.4 eV are related to the Mo5+ in the MoSxOy, The peak at 232.5 ± 0.3 eV and 235.7 ± 0.3 eV corresponds to the Mo6+ oxides species. Finally, the peak at 226.5 eV is belonged to the S2−. The sulfidation degree of Mo is calculated by that Mo4+/(Mo4+ + Mo5+ + Mo6+) and the results are shown in the Table 4. As shown in the Table 4, the sulfidation degree of NiMo catalysts are followed the order: NiMo/Al-SP (T) (54.13%) > NiMo/Al-SP (H) (39.89%) > NiMo/Al-SP (A) (33.09%). The NiMo/Al-SP (T) exhibited the highest sulfidation degree, which could be assigned to the lowest interaction between active phases and Al-SP (T), which is in consistent with the H2-TPR results.
 | ||
| Fig. 7 Mo 3d XPS spectra of sunfided catalysts: (A) NiMo/Al-SP (A), (B) NiMo/Al-SP (H), (C) NiMo/Al-SP (T). | ||
| Catalysts | Mo4+ | Mo5+ | Mo6+ | SMob | |||
|---|---|---|---|---|---|---|---|
| Ar%a (d5/2) | Ar% (d3/2) | Ar% (d5/2) | Ar% (d3/2) | Ar% (d5/2) | Ar% (d3/2) | ||
| a Ar% means the area percent of the XPS peak.b SMo = Mosulfidation = Mo4+/(Mo4+ + Mo5+ + Mo6+). | |||||||
| NiMo/Al-SP (A) | 19.85 | 13.24 | 9.08 | 6.06 | 31.06 | 20.71 | 33.09 |
| NiMo/Al-SP (H) | 23.93 | 15.96 | 6.97 | 4.65 | 29.09 | 19.40 | 39.89 |
| NiMo/Al-SP (T) | 32.48 | 21.65 | 12.32 | 8.22 | 15.20 | 10.13 | 54.13 |
3.2 Evaluation of the catalysts
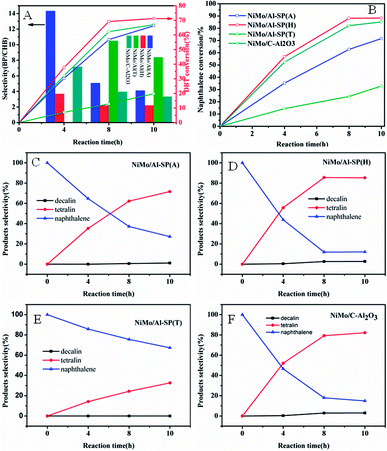
The DBT and naphthalene were used as the probe compounds, and the HDS and hydrogenation results over NiMo/Al-SP (T), NiMo/Al-SP (A), NiMo/Al-SP (H) and NiMo/C-Al2O3 at different reaction times within 4–10 hours are shown in the Fig. 7(A) and (B). As can be seen from Fig. 7(A) and (B), for all catalysts, the conversion of DBT and naphthalene significantly increased with increasing the reaction time. In HDS of DBT, there are two parallel reaction routes: one is the direct desulfurization (DDS), and biphenyl (BP) is the main product. The other one is the hydrogenation (HYD) to yield cyclohexylbenzene (CHB). The selectivity (BP/CHB) of the HDS of DBT for all the catalysts was decreased with increasing reaction time. And BP is the main products in the HDS reaction, which indicated that the DDS route is the main reaction route. Besides, the main products of hydrogenation of naphthalene are tetralin and no cracking products are detected. In addition, for the four catalysts, the efficiencies of hydrogenation of naphthalene were higher than that of HDS. The HDS efficiency over all the catalysts and the hydrogenation of efficiency followed the order of: NiMo/Al-SP (H) > NiMo/C–Al2O3 > NiMo/Al-SP (A) > NiMo/Al-SP (T). The DBT and naphthalene conversion of the NiMo/Al-SP (H) catalyst reached 71.22% and 88.28%, respectively.The textural properties play a key role in the hydrodesulfurization of DBT and hydrogenation of naphthalene. Large surface area is beneficial for the dispersion of active phase and large pore size and pore volume has great influence on the diffusion of reactant and product molecules. The pore volume of catalyst followed the order: NiMo/Al-SP (H) (0.64 cm3 g−1) > NiMo/Al-SP (A) (0.41 cm3 g−1) > NiMo/Al-SP (T) (0.063 cm3 g−1), which is well in line with the activity of catalyst. Compared with the pore size of NiMo/Al-SP (A) (5.9 nm), NiMo/Al-SP (H) (9.3 nm) exhibited larger pore size. Large pore volume and pore size can not only enhance the interaction between the reactant and active phase but also eliminate the diffusion resistant molecules. Besides, the lowest surface area of NiMo/Al-SP (T) leads to the agglomeration of active phase, which confirm in XRD results, also responding to the lowest catalyst activity. Appropriate acidity of catalyst is another factor to influence on the hydrodesulfurization of DBT and hydrogenation of naphthalene.34,38,40 In this research, the intensity of the B acid site and and L acid site are followed the order: NiMo/Al-SP(H) (3.2 μmol g−1, 108.1 μmol g−1) > NiMo/Al-SP (A) (12.3 μmol g−1, 139.2 μmol g−1) >NiMo/Al-SP (T) (0 μmol g−1, 0 μmol g−1), which is in accord with the activity of catalyst. Although the L acidity is harmful for the saturated hydrogenation of naphthalene,41 B acidity is beneficial for the scission of C–S bond and can promote the migration of hydrogen. Besides, compared with the sulfidation degree of catalyst: NiMo/Al-SP (T) (54.13%) > NiMo/Al-SP (H) (39.89%) > NiMo/Al-SP (A) (33.09%). Higher sulfidation degree of catalysts is beneficial for the reaction. However, the activity of NiMo/Al-SP (T) is not coincided with the sulfidation degree. The lowest pore volume is responded to this phenomenon (Table 2) (Fig. 8).
Above all, the NiMo/Al-SP (H) has the best performance of hydrodesulfurization and hydrogenation was due to the synergistic effects of textural property, appropriate acidity and sulfidity. Besides, the pore volume and the pore size is the most important factor to influence the activity of catalyst in this research.
4 Conclusions
In this work, Al-glycolate spheres having porous acanthosphere, porous spheres and core–shell spheres morphologies were prepared through alcoholysis or hydrolysis treatments. The characterization results showed that the Al-glycolate spheres were coordination compound, composed of carboxylate groups and Al ion. The carboxylate groups in Al-glycolate spheres were replaced by the hydroxyl groups during alcoholysis or hydrolysis treatment. The Al-glycolate sphere is a solid sphere without a mesoporous structure. After alcoholysis or hydrolysis treatment, the porous sphere can be produced. Additionally, the amorphous nature is transformed into boehmite phase. The corresponding NiMo catalysts were prepared by the incipient wetness method, and the catalytic properties were tested in simultaneous hydrodesulfurization and hydrogenation using dibenzothiophene and naphthalene as the probe compounds, respectively. The activity of hydrodesulfurization of DBT and the hydrogenation of naphthalene followed the order: NiMo/Al-SP (H) > NiMo/Al-SP (A) > NiMo/Al-SP (T). The NiMo/Al-SP (H) possessed the largest catalytic activity due to the synergistic effects of textural property, appropriate acidity and sulfidity.Conflicts of interest
There are no conflicts to declare.Acknowledgements
The authors acknowledge the support from Startup R&D funding of One-Hundred Young Talents of Guangdong University of Technology (No. 220413141), the Science and Technology Program of Guangzhou, China (201804010172), National Natural Science Foundation of China (No. 21276052, 21776049), Science and Technology Planning Project of Guangdong Province, China (No. 2012A090300006) are gratefully acknowledged.Notes and references
- L. H. Ding, Z. S. Zhang, Y. Zheng, Z. Ring and J. W. Chen, Appl. Catal., A, 2006, 301, 241–250 CrossRef.
- C. S. Song, Catal. Today, 2003, 86, 211–263 CrossRef.
- B. Pawelec, R. M. Navarro, J. M. Campos-Martin and J. L. G. Fierro, Catal. Sci. Technol., 2011, 1, 23–42 Search PubMed.
- A. Stanislaus, A. Marafi and M. S. Rana, Catal. Today, 2010, 153, 1–68 CrossRef.
- D. Q. Zhang, A. J. Duan, Z. Zhao, G. F. Wan, Z. Y. Gao, G. Y. Jiang, K. B. Chi and K. H. Chuang, Catal. Today, 2010, 149, 62–68 CrossRef.
- S. L. Amaya, G. Alonso-Nunez, T. A. Zepeda, S. Fuentes and A. Echavarria, Appl. Catal., B, 2014, 148, 221–230 CrossRef.
- C. Dujardin, M. A. Lelias, J. van Gestel, A. Travert, J. C. Duchet and F. Mauge, Appl. Catal., A, 2007, 322, 46–57 CrossRef.
- L. Pena, D. Valencia and T. Klimova, Appl. Catal., B, 2014, 147, 879–887 CrossRef.
- S. Badoga, A. K. Dalai, J. Adjaye and Y. F. Hu, Fuel Process. Technol., 2017, 159, 232–246 CrossRef.
- A. I. Dugulan, J. A. R. van Veen and E. J. M. Hensen, Appl. Catal., B, 2013, 142, 178–186 CrossRef.
- F. Rashidi, T. Sasaki, A. M. Rashidi, A. N. Kharat and K. J. Jozani, J. Catal., 2013, 299, 321–335 CrossRef.
- S. Badoga, R. V. Sharma, A. K. Dalai and J. Adjaye, Fuel, 2014, 128, 30–38 CrossRef.
- R. A. Ortega-Dominguez, J. A. Mendoza-Nieto, P. Hernandez-Hipolito, F. Garrido-Sanchez, J. Escobar-Aguilar, S. A. I. Barri, D. Chadwick and T. E. Klimova, J. Catal., 2015, 329, 457–470 CrossRef.
- S. Badoga, R. V. Sharma, A. K. Dalai and J. Adjaye, Appl. Catal., A, 2015, 489, 86–97 CrossRef.
- S. Badoga, A. K. Dalai, J. Adjaye and Y. F. Hu, Ind. Eng. Chem. Res., 2014, 53, 2137–2156 CrossRef.
- H. D. Wu, A. J. Duan, Z. Zhao, D. H. Qi, J. M. Li, B. Liu, G. Y. Jiang, J. Liu, Y. C. Wei and X. Zhang, Fuel, 2014, 130, 203–210 CrossRef.
- C. Avendano, A. Briceno, F. J. Mendez, J. L. Brito, G. Gonzalez, E. Canizales, R. Atencio and P. Dieudonne, Dalton Trans., 2013, 42, 2822–2830 RSC.
- J. L. Pinilla, H. Puron, D. Torres, I. Suelves and M. Millan, Carbon, 2015, 81, 574–586 CrossRef.
- M.-h. Zhang, J.-y. Fan, K. Chi, A.-j. Duan, Z. Zhao, X.-l. Meng and H.-l. Zhang, Fuel Process. Technol., 2017, 156, 446–453 CrossRef.
- Y. Fan, G. Shi, H. Y. Liu and X. J. Bao, Appl. Catal., B, 2009, 91, 73–82 CrossRef.
- M. Gupta, J. He, T. Nguyen, F. Petzold, D. Fonseca, J. B. Jasinski and M. K. Sunkara, Appl. Catal., B, 2016, 180, 246–254 CrossRef.
- S. Liu, X. Liang, J. Zhang and B. Chen, Catal. Sci. Technol., 2017, 7, 466–480 Search PubMed.
- A. Sayari, B. H. Han and Y. Yang, J. Am. Chem. Soc., 2004, 126, 14348–14349 CrossRef PubMed.
- J. N. D. de León, T. A. Zepeda, G. Alonso-Nunez, D. H. Galvan, B. Pawelec and S. Fuentes, J. Catal., 2015, 321, 51–61 CrossRef.
- D. W. Gao, A. J. Duan, X. Zhang, Z. Zhao, E. Hong, J. M. Li and H. Wang, Appl. Catal., B, 2015, 165, 269–284 CrossRef.
- C. C. Li and H. C. Zeng, J. Am. Chem. Soc., 2012, 134, 19084–19091 CrossRef PubMed.
- P. L. Gentili, F. Presciutti, F. Evangelisti and F. Costantino, Chem.–Eur. J., 2012, 18, 4296–4307 CrossRef PubMed.
- A. Boumaza, L. Favaro, J. Ledion, G. Sattonnay, J. B. Brubach, P. Berthet, A. M. Huntz, P. Roy and R. Tetot, J. Solid State Chem., 2009, 182, 1171–1176 CrossRef.
- G. X. Xue, X. Huang, N. Zhao, F. K. Xiao and W. Wei, RSC Adv., 2015, 5, 13385–13391 RSC.
- J. Zhou, C. Tang, B. Cheng, J. Yu and M. Jaroniec, ACS Appl. Mater. Interfaces, 2012, 4, 2174–2179 Search PubMed.
- H. Liu, C. L. Yin, H. Li, B. Liu, X. H. Li, Y. M. Chai, Y. P. Li and C. G. Liu, Fuel, 2014, 129, 138–146 CrossRef.
- A. V. da Silva Neto, E. R. Leite, V. T. da Silva, J. L. Zotin and E. A. Urquieta-González, Appl. Catal., A, 2016, 528, 74–85 CrossRef.
- D. P. Cai, B. Liu, D. D. Wang, Y. Liu, L. L. Wang, H. Li, Y. R. Wang, C. X. Wang, Q. H. Li and T. H. Wang, Electrochim. Acta, 2014, 115, 358–363 CrossRef.
- X. Wang, Z. Zhao, P. Zheng, Z. Chen, A. Duan, C. Xu, J. Jiao, H. Zhang, Z. Cao and B. Ge, J. Catal., 2016, 344, 680–691 CrossRef.
- D. Ferdous, A. K. Dalai and J. Adjaye, Appl. Catal., A, 2004, 260, 137–151 CrossRef.
- S. Shan, H. Liu, Y. Yue, G. Shi and X. Bao, J. Catal., 2016, 344, 325–333 CrossRef.
- J. A. Z. Pieterse, S. Veefkind-Reyes, K. Seshan, L. Domokos and J. A. Lercher, J. Catal., 1999, 187, 518–520 CrossRef.
- Y. Li, D. H. Pan, C. Z. Yu, Y. Fan and X. J. Bao, J. Catal., 2012, 286, 124–136 CrossRef.
- C. A. Emeis, J. Catal., 1993, 141, 347–354 CrossRef.
- G. Perot, Catal. Today, 2003, 86, 111–128 CrossRef.
- M. X. Du, Z. F. Qin, H. Ge, X. K. Li, Z. J. Lu and J. G. Wang, Fuel Process. Technol., 2010, 91, 1655–1661 CrossRef.
| This journal is © The Royal Society of Chemistry 2018 |

