DOI:
10.1039/C8RA02512F
(Paper)
RSC Adv., 2018,
8, 19116-19124
Nitrogen doped hierarchically structured porous carbon fibers with an ultrahigh specific surface area for removal of organic dyes†
Received
23rd March 2018
, Accepted 12th May 2018
First published on 24th May 2018
Abstract
Recently, tremendous efforts have been devoted to creating inexpensive porous carbon materials with a high specific surface area (SSA) as adsorbents or catalysts for the efficient removal of organic pollutants. Here, activated porous carbon fibers with hierarchical structures were designed and constructed by an electrospinning technique, in situ polymerization, and activation and carbonization processes. Benefiting from the precursor fiber design and subsequent activation techniques, the activated porous carbon fibers (APCFs) derived from a benzoxazine/polyacrylonitrile (BA-a/PAN) precursor exhibited an ultrahigh SSA of 2337.16 m2 g−1 and a pore volume of 1.24 cm3 g−1, showing excellent adsorption capacity toward methylene blue (MeB, 2020 mg g−1). Interestingly, the APCFs after pre-adsorption of MeB also display robust activation of peroxymonosulfate (PMS) with singlet oxygen for the ultrafast removal of MeB. Meanwhile, the synergistic effect of adsorption and a catalytic oxidation reaction using APCFs can realize outstanding total organic carbon (TOC) removal in a comparatively short time. Moreover, a synergistic adsorption–oxidation mechanism for promoting the removal of MeB using APCFs was proposed. This study is useful for the design and development of novel metal-free carbon adsorbents, catalysts or catalyst carriers with an ultrahigh SSA for various applications.
1. Introduction
The immoderate emission of toxic organic pollutants into water resources has led to serious damage to aquatic ecosystems1, which exceeds the self-cleaning capability of nature, and even has carcinogenic effects on human health.2 It is therefore critical to develop efficient wastewater treatment technologies for environmental remediation. Adsorption technology including use of carbon, covalent/metal organic frameworks and functional polymer materials etc. has been considered as one of the most powerful technologies owing to its ease of operation, high efficiency and relatively low cost.3–7 However, the adsorption process is usually time-consuming and most of the refractory pollutants are difficult to completely adsorb; therefore, some complicated follow-up processes such as bioavailability or deep oxidation methods are required. Advanced oxidation processes (AOPs) are powerful and attractive techniques for the effective degradation of refractory organic pollutants using highly reactive radicals such as hydroxyl radicals (˙OH), sulfate radicals (SO4˙−) and singlet oxygen (1O2) etc.8,9 Nevertheless, AOPs are aimed at degrading organic pollutants into lower molecular weight molecules, thus a high percentage of total organic carbon (TOC) (40–60%) still remained in the treated water. Consequently, individual AOPs also cannot reach high efficiency and environmentally friendly conversion.10–12
To achieve highly efficient wastewater treatment technology without complex follow-up processes, carbon based adsorbents and catalysts such as graphene, carbon nanotubes etc. have been successfully fabricated to remove organic pollutants owing to their comparatively high specific surface area (SSA), unique structures and functionalities,13–15 but the high cost severely suppresses their practical applications at present. Porous carbon materials also have attracted researchers’ interests due to their high specific surface area and robust chemical resistance, as well as their excellent electrical/thermal conductivities. These featured characteristics make the porous carbon materials promising candidates for wastewater treatment, energy storage electrodes, electrochemistry etc.16–19 However, the comparatively low SSA of carbon materials (around hundreds of square meters per gram) may seriously affect their performance.16,20,21
Polybenzoxazine (PBZ), as a new kind of phenolic resin, has been widely used to fabricate porous carbon materials with hierarchical structures by virtue of a wide range of intriguing features including near-zero volumetric shrinkage, high glass-transition temperatures and high carbon yields.22–24 In addition, during the carbonization process, the nitrogen in the BA-a monomer can be used as a nitrogen source to break the inertness of the carbon structure and facilitate electronic conductivity by tailoring the electronic state, thus shortening the activation time of the oxidant for the degradation of organic pollutants.25 However, the chemical synthesis and operation steps of conventional synthetic strategies (e.g. substrate methods, chemical vapor deposition methods and vapor growth methods) are dangerous, complex and costly.26,27 Electrospinning, a facile and powerful technique, provides a straightforward and inexpensive fabrication strategy for organic, inorganic or composite fiber preparation.28–31 The electrospun products have features such as a three-dimensional open porous structure, high surface area and huge aspect ratio, which would be beneficial to mass transfer for effective wastewater treatment. However, it is still challenging to construct hierarchical porous carbon fibers with an ultrahigh SSA for effective wastewater treatment.
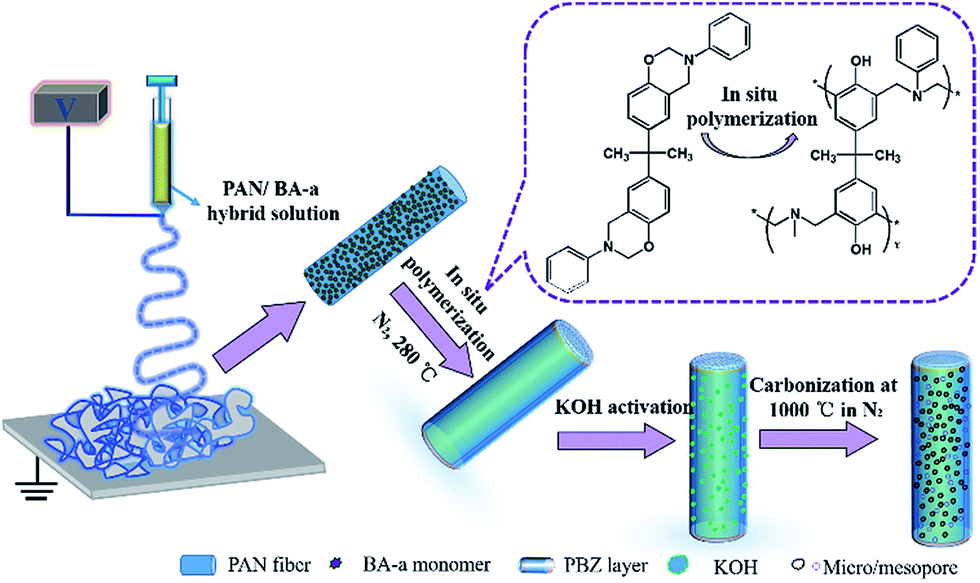
In this work, nitrogen doped hierarchical activated porous carbon fibers (APCFs) derived from a benzoxazine/polyacrylonitrile (BA-a/PAN) precursor were fabricated in combination with an electrospinning technique, in situ polymerization and activation and carbonization processes, and the fabrication process is shown in detail in Fig. 1. It is worth noting that the BA-a monomer added in the PAN precursor aimed to create hierarchical carbon fibers with an ultrahigh SSA. The main content of this article is as follows: (1) the optimal adsorption conditions for different charged organic dyes; (2) the study of the synergistic and competitive adsorption and catalytic oxidation removal of MeB on APCFs at different stages; (3) the proposal of a synergistic adsorption–oxidation mechanism for MeB removal on APCFs.
 |
| | Fig. 1 Schematic illustration for the preparation of nitrogen doped hierarchical APCFs. | |
2. Experimental
2.1 Materials
Polyacrylonitrile (P1361, PAN) was used as received from SpectrumChemical Co., Ltd, China. N,N-Dimethylacetamide (DMAc), methylene blue (MeB), methyl orange (MO), bisphenol-A, paraformaldehyde and aniline were purchased from Aladdin Chemical Reagent Co., Ltd, China. Peroxymonosulfate (PMS, KHSO5·0.5KHSO4·0.5K2SO4) was purchased from Sigma-Aldrich. Potassium hydroxide (KOH), hydrochloric acid (HCl), dichloromethane and anhydrous calcium chloride were purchased from Xilong Chemical Co., Ltd, China.
2.2 Preparation of activated porous carbon fibers
The synthesis procedures and relevant characterization of BA-a are shown in Fig. S1 and 2.†22–24,32 The precursor fibers were fabricated via a facile method of co-electrospinning of BA-a/PAN solution. Various ratios of BA-a precursor were added into the PAN solutions. Taking 1![[thin space (1/6-em)]](https://www.rsc.org/images/entities/char_2009.gif) :1 as an example, 2.7 g of BA-a powder was first dissolved into 27.3 g of DMAc solution with vigorous stirring for 30 min, then 2.7 g of PAN powder was added to the above solution with vigorous stirring for another 12 h. The solution was then transferred into a plastic syringe electrospinning machine with a fixed positive voltage of 15 kV and a feed rate of 1.0 mL h−1 with a distance of 12 cm between the needle tip and the collector. All of the chamber temperatures and relative humidities during the electrospinning processes were fixed at 23 ± 2 °C and 42 ± 3%, respectively. The PAN fibers containing various weight ratios of BA-a with respect to PAN powder were denoted BPANX. Then the fibrous membranes were cured at 280 °C for 1 h in a N2 flow to obtain thermally-stabilized fibrous membranes, followed by immersion into 30 wt% of KOH solution for 1 h with mild shaking, and finally were dried at 80 °C for 3 h. Subsequently, the activated fibrous membranes were carbonized at 1000 °C in a N2 flow with a heating rate of 2 °C min−1 and washed with 0.1 M HCl at least 3 times. The directly carbonized PAN fibrous membranes were denoted CFs. The BA-a/PAN fibrous membranes directly carbonized without KOH activation were denoted PCFsY. The resultant black carbon fibers were denoted APCFsZ, where X, Y and Z stand for the weight ratios of BA-a with respect to PAN powder obtained at different stages.
:1 as an example, 2.7 g of BA-a powder was first dissolved into 27.3 g of DMAc solution with vigorous stirring for 30 min, then 2.7 g of PAN powder was added to the above solution with vigorous stirring for another 12 h. The solution was then transferred into a plastic syringe electrospinning machine with a fixed positive voltage of 15 kV and a feed rate of 1.0 mL h−1 with a distance of 12 cm between the needle tip and the collector. All of the chamber temperatures and relative humidities during the electrospinning processes were fixed at 23 ± 2 °C and 42 ± 3%, respectively. The PAN fibers containing various weight ratios of BA-a with respect to PAN powder were denoted BPANX. Then the fibrous membranes were cured at 280 °C for 1 h in a N2 flow to obtain thermally-stabilized fibrous membranes, followed by immersion into 30 wt% of KOH solution for 1 h with mild shaking, and finally were dried at 80 °C for 3 h. Subsequently, the activated fibrous membranes were carbonized at 1000 °C in a N2 flow with a heating rate of 2 °C min−1 and washed with 0.1 M HCl at least 3 times. The directly carbonized PAN fibrous membranes were denoted CFs. The BA-a/PAN fibrous membranes directly carbonized without KOH activation were denoted PCFsY. The resultant black carbon fibers were denoted APCFsZ, where X, Y and Z stand for the weight ratios of BA-a with respect to PAN powder obtained at different stages.
2.3 Adsorption and catalytic oxidative degradation of organic dyes
For the organic dye adsorption tests, methylene blue (MeB) and methyl orange (MO) were chosen as typical model contaminants. The adsorption tests were conducted in a 200 mL beaker with 100 mL of organic solution. The processing parameters including organic dye concentration and pH value were also systematically investigated. The catalytic oxidation processes were conducted in a 200 mL beaker with 100 mL of organic solution (20 mg L−1), 0.1 g L−1 of carbon fibers and 0.5 g L−1 of PMS solution. For the adsorption–catalytic removal tests, 10 mg of APCFs100 was first immersed into 100 mL of MeB solution at the desired initial concentration for 60 min, and then 2 mL of PMS (25 g L−1) was added to the above solutions. After that, 2 mL of solution at the designed time intervals was withdrawn. Subsequently, all of the samples were analyzed using a UV-vis spectrophotometer after filtrating with a cellulose acetate membrane with a pore size of 0.45 μm. In order to evaluate the reversibility of the resultant APCFs100, the used carbon fibers were rinsed with 1 M NaOH three times, followed by washing with ethanol three times, and then they were dried in an oven for 30 min to remove the adsorbed MeB and obtain the regenerated APCFs100.
2.4 Characterization
The surface morphology of the fibers treated at different stages was observed using a field emission scanning electron microscope (FE-SEM) (Zeiss SUPRA 55 SAPPHIRE) and transmission electron microscope (TEM) (JEM-2100F, JEOL Ltd.). The chemical structure of BA-a was investigated by Fourier transform infrared spectroscopy (FTIR, Thermo Scientific, Nicolet iS50). 1HNMR spectra of BA-a were measured on a Bruker Avance 400 instrument (resonance frequency of 400 MHz for 1H) and d-CH2Cl2 was used as the solvent. The crystal structure of the samples was measured using an X-ray diffractometer (XRD) (Bruker D8). The surface area and pore size distribution of relevant samples were analyzed by N2 ad/desorption measurements (Micrometric ASAP 2020, USA). The near-surface chemical information of the materials was analyzed by X-ray photoelectron spectroscopy (XPS, K-Alpha, Al Kα radiation, 1486.6 eV, 12 kV, 3 mA). Raman spectra were obtained by using a micro-Raman spectroscopy system (inVia-Reflex, Renishaw, Co., UK). Thermal degradation measurements were performed by thermogravimetric analysis (TGA) (NETZSCH, STA 449F3). The degraded byproducts of MeB were measured using an Agilent 1290 UHPLC coupled 6430 triple quadrupole mass spectrometer (Agilent Technologies, CA, USA). Electron paramagnetic resonance (EPR) spectroscopy was applied for in situ investigation of the generated reactive radicals (Bruker A200 spectrometer, Germany).
3. Results and discussion
3.1 Morphology of precursory, stabilized and carbonized fibers
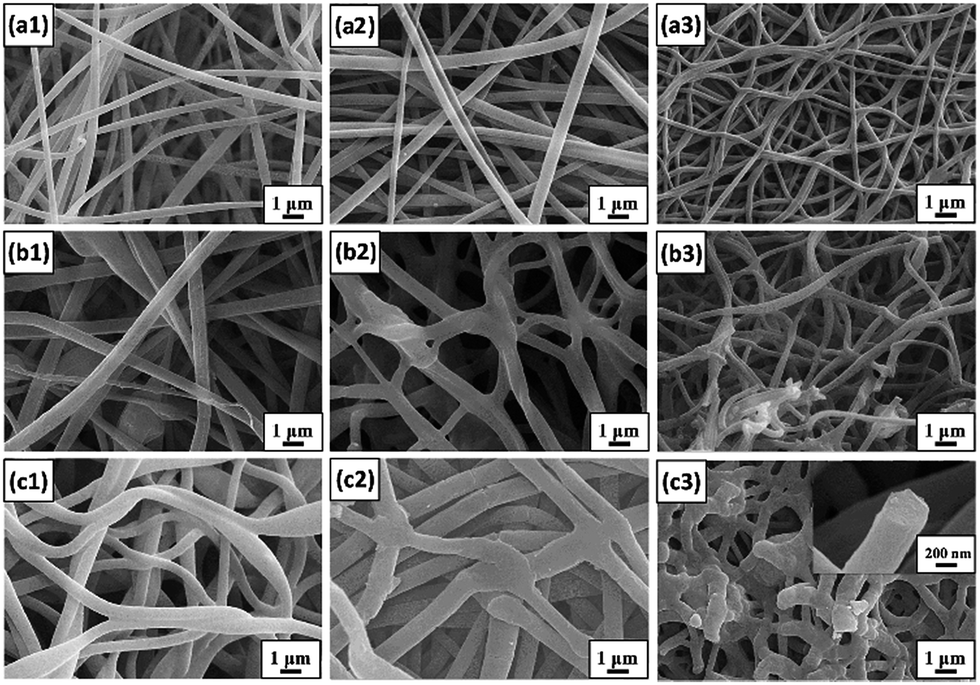
The morphology of the resultant fibers with various BA-a amounts treated at each stage was monitored by FE-SEM microscopy, as shown by the images in Fig. 2(a1–c1) and S3.† The average diameter of BPAN0, BPAN30, BPAN70 and BPAN100 is 172, 372, 577 and 490 nm, respectively, which clearly shows that the fiber diameter did not always increase regularly with increasing BA-a content. For the BPAN30 fibers, the average diameter was increased to 372 nm owing to the increasing viscosity or polymer concentration.33 However, further increasing the BA-a content will improve the conductivity of the electrospinning solution due to the positively charged quaternary ammonium of BA-a, thus enhancing the drafting force of fibers at high voltage.28,34,35 An activation process was considered as one of the most crucial processes to prepare APCFs with hierarchical structures.36,37 Considering that the BA-a monomer in the PAN matrix was not stable under the activation and carbonization processes, a curing process was carried out at 280 °C in N2 flow, ensuring that the instable fibers converted to stable thermoplastic fibers. FE-SEM images of cross-linked fibers containing various BA-a amounts are displayed in Fig. 2(a2–c2). The average diameter of relevant fibers was increased from 352 to 588 nm and the increasing adhesion structures could be clearly observed as the BA-a content was increased from 30 to 100%. Then the BPAN fibers were immersed into 30 wt% of KOH solution for 1 h, followed by carbonization at 1000 °C. During the carbonization process, the BPAN fibers gradually converted to graphite carbon, and the KOH molecules reacted with carbon resulting in hydroxide reduction and carbon oxidation. The produced H2, CO and H2O gases led to hierarchically structured carbon fibers with an ultrahigh SSA.38,39 The morphologies and structures of APCFs are greatly dependent on the BA-a content in the PAN fibers as shown in Fig. 2(a3–c3). APCFs30 and APCFs70 exhibited uniform structures with average diameters of 226 and 286 nm, respectively. However, many defects and breakages appeared on the APCFs100 fiber surface (452 nm) with microporous and mesoporous structures (the inset of Fig. 2(c3)). Formation of these obvious hierarchical structures was mainly ascribed to the synergistic effect of the BA-a precursor (pore-foaming agent) and KOH activation process.
 |
| | Fig. 2 FE-SEM images of fibers fabricated from various weight ratios of BA-a with respect to PAN, (a) 30 wt%, (b) 70 wt% and (c) 100 wt%, respectively. (1) Precursory fibers, (2) cured fibers and (3) activated porous carbon fibers. | |
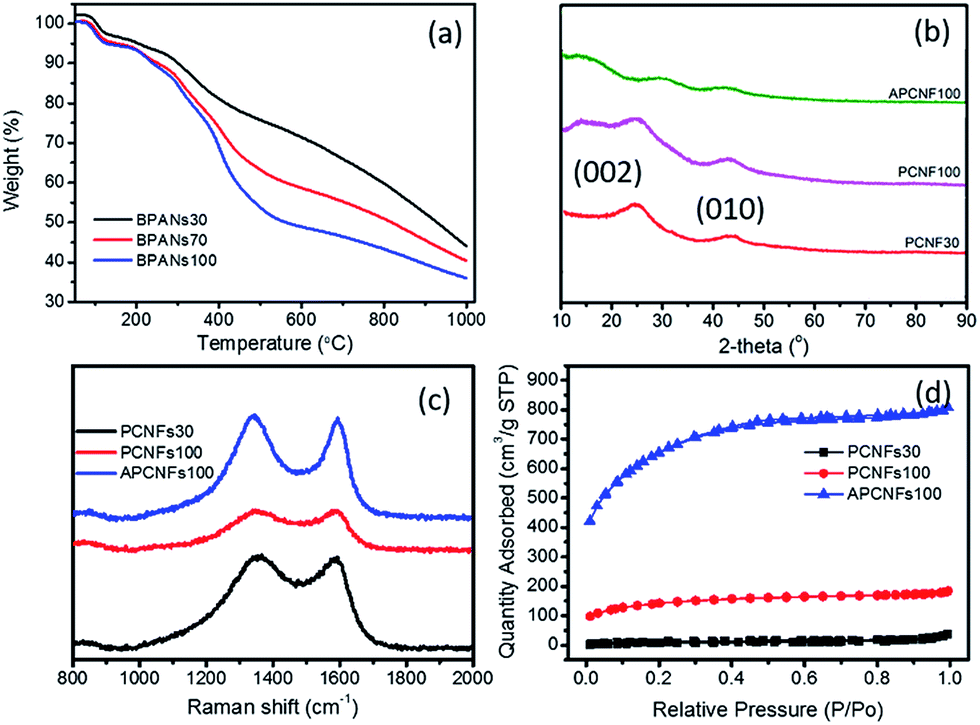
The effect of BA-a content on the thermal properties of the PAN matrix was studied by TGA as shown in Fig. 3a. All the curves began to decompose around 280 °C and when the carbonization temperature reached 1000 °C the weight loss of BPAN30, BPAN70 and BPAN100 was 55.95, 59.62 and 64.02 wt%, respectively, illustrating that increasing the BA-a content can effectively enhance the hierarchical structures and SSA of carbon fibers. The structural features and state of carbon were analyzed by XRD spectroscopy, as displayed by the patterns in Fig. 3b. The strong diffraction peak at 25.9° and comparatively weak peak at 43.0° were assigned to the (002) and (111) planes of the standard XRD data of the carbon phase. In addition, the weak intensity of APCFs100 indicated that the carbon had lower crystallinity, demonstrating that the precursor fibers treated by a strong alkali can seriously destroy the crystal structures of graphite carbon.38 Raman spectra were used to further characterize the crystal structures and defects of relevant fibers as shown in Fig. 3c. All of the samples displayed both a D band (disordered carbon, 1349 cm−1) and sp2 G band (ordered carbon, 1585 cm−1). The ID/IG ratio was used to evaluate the defects in the carbon domains. The samples exhibited increasing ID/IG ratios of 1.01, 1.02 and 1.05 with respect to PCFs30, PCFs100 and APCFs100, respectively. All of the above-mentioned results demonstrate that increasing the BA-a content and activation process can seriously destroy the degree of stacking order of graphite. It is worth noting that the amorphous carbon with more active sites has proved to be more suitable for efficient removal of organic pollutants.40
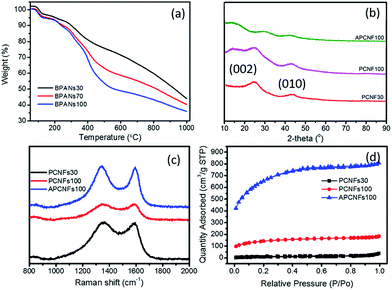 |
| | Fig. 3 (a) TGA curves, (b) XRD patterns, (c) Raman spectra and (d) N2 ad/desorption isotherms of relevant carbon fibers. | |
To further verify the porous structure induced by the pore-agent (BA-a) and activation process, nitrogen ad/desorption measurement was carried out to investigate the porous textural structures as shown in Fig. 3d and S4.† All of the isotherms exhibited a typical type I isotherm with the adsorption behaviour of micropore filling, monolayer adsorption and capillary condensation. It was found that the nitrogen adsorption quantity was increased obviously with increasing BA-a content. The BET surface area was increased from 125.22 to 692.35 m2 g−1 as the BA-a content was increased from 30 to 100%. After activation, the SSA sharply increased to 2337.16 m2 g−1 (Table S1†). This indicates that the activation process makes the closed pores in precursor carbon fibers convert to open pores after acid treatment, thus enhancing the SSA of activated porous carbon fibers. As is well-known, a large surface area is a prerequisite for adsorbent and catalyst materials because the enhanced inner hierarchical pores in the fibers can furnish an unobstructed diffusion pathway with more active sites.41 The pore size distribution calculated via the non-local density function theory (NLDFT) model revealed that all of the curves are located in the range of 1.6 to 40 nm and centered at 1.84 nm (Fig. S4†).
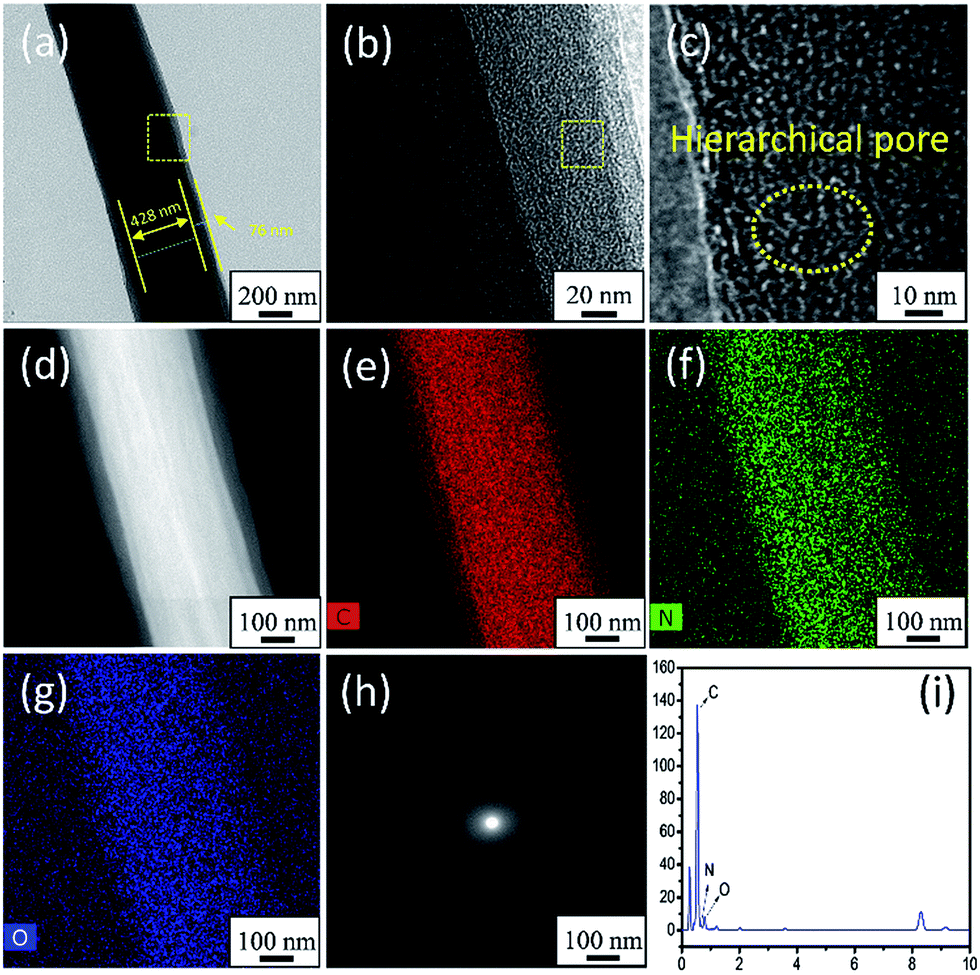
The TEM images, HAADF-STEM mapping images, SAED pattern, and STEM-EDX images shown in Fig. 4 further confirmed the structure and morphology of APCFs100. Interestingly, a core–shell structured APCFs100 was clearly observed as shown in Fig. 4a. The APCFs100 carbonized by two components of BA-a/PAN precursor was different from that carbonized by three components of BA-a/PAN/metal salts as reported in previous literature.22,23,39 The formation of this featured structure can be attributed to the separated phases of PBZ/PAN from the carbonization process. However, metal salts are often used to accelerate ordered carbon growth with a homogeneous structure, thus preventing the PBZ from migrating to the fiber surface for shell layer formation.42,43 Fig. 4(b and c) displays the low and high magnification TEM images of the interface of the core–shell structured APCFs100. Hierarchical pores (≤2 nm) can be obviously observed as shown by the dotted yellow lines. Additionally, the HAADF-STEM and STEM-EDX mapping images shown in Fig. 4d–g and i reveal the uniform distribution of C/N/O elements with an atomic ratio of 96.71%, 1.21% and 2.08%, respectively. In addition, no obvious resolved lattice fringes can be seen from the plane of carbon, and the selected area electron diffraction (SAED) pattern shows no spotty ring patterns of graphene (Fig. 4h), illustrating that the activation process can seriously destroy the crystal structure of the ordered carbon, which is in accordance with the XRD results.
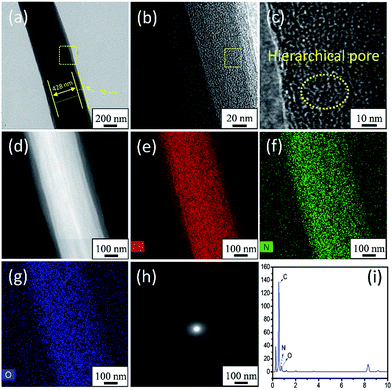 |
| | Fig. 4 (a) The TEM image of a single fiber, (b and c) low and high magnification TEM images, (d) HAADF-STEM image, (e–g) STEM-EDX mapping images, (h) SAED pattern and (i) EDX spectrum of APCFs100. | |
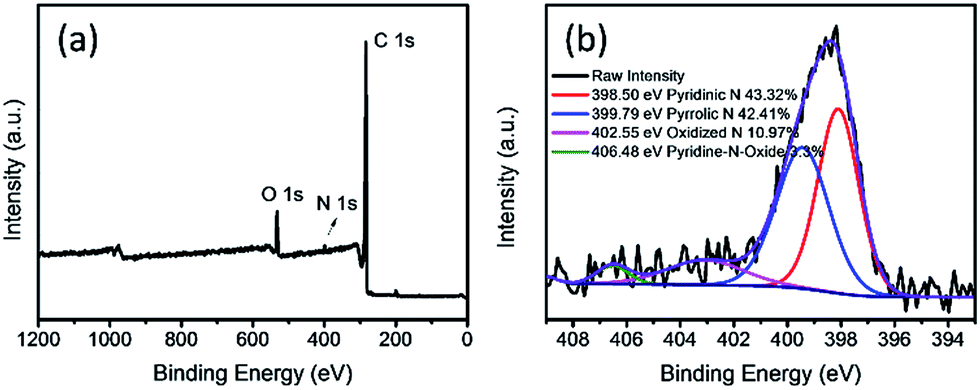
XPS analyses were carried out to give a detailed insight into the composition and chemical state of nitrogen doped APCFs100 as shown in Fig. 5a. It is clearly observed that the element N apparently exists in the resultant APCFs100 with an atom ratio of 1.98%, demonstrating that a small quantity of N was derived from PAN and BA-a. The N 1s spectrum of APCFs100 showed it exists as pyridinic N (398.5 eV), pyrrolic N (399.79 eV), oxidized N (402.55 eV) and pyridine-N-oxide (406.48 eV) with levels of 43.32, 42.41, 10.97 and 3.30% in the overall N dopant amount, respectively. The quantity of N doped into the carbon was lower than that of traditional N doped graphene because the carbonization process performed at a high temperature of 1000 °C can break up the C–N bonds, finally resulting in the loss of nitrogen.26 In addition, XPS analysis of O 1s is also explored as shown in Fig. S5.† The spectrum of O 1s can be deconvoluted into three single peaks with binding energies of 531.5 eV (–OH), 532.4 eV (C![[double bond, length as m-dash]](https://www.rsc.org/images/entities/char_e001.gif) O) and 533.0 eV (N–C–O). These electronegative N and O groups perform as active sites for PMS activation. Moreover, the high resolution C 1s spectrum (Fig. S6†) can be fitted into five components with binding energies at 283.74 eV (–CC), 284.92 eV (C–OH), 286.52 eV (C–O–C), 289.45 eV (–CO) and 287.60 eV (–COOH). The nitrogen and oxygen groups doped in porous carbon fibers may further enhance catalyst activity for the efficient removal of organic pollutants.21
O) and 533.0 eV (N–C–O). These electronegative N and O groups perform as active sites for PMS activation. Moreover, the high resolution C 1s spectrum (Fig. S6†) can be fitted into five components with binding energies at 283.74 eV (–CC), 284.92 eV (C–OH), 286.52 eV (C–O–C), 289.45 eV (–CO) and 287.60 eV (–COOH). The nitrogen and oxygen groups doped in porous carbon fibers may further enhance catalyst activity for the efficient removal of organic pollutants.21
 |
| | Fig. 5 (a) XPS survey and (b) N 1s spectra of APCFs100. | |
3.2 Organic dye adsorption performances
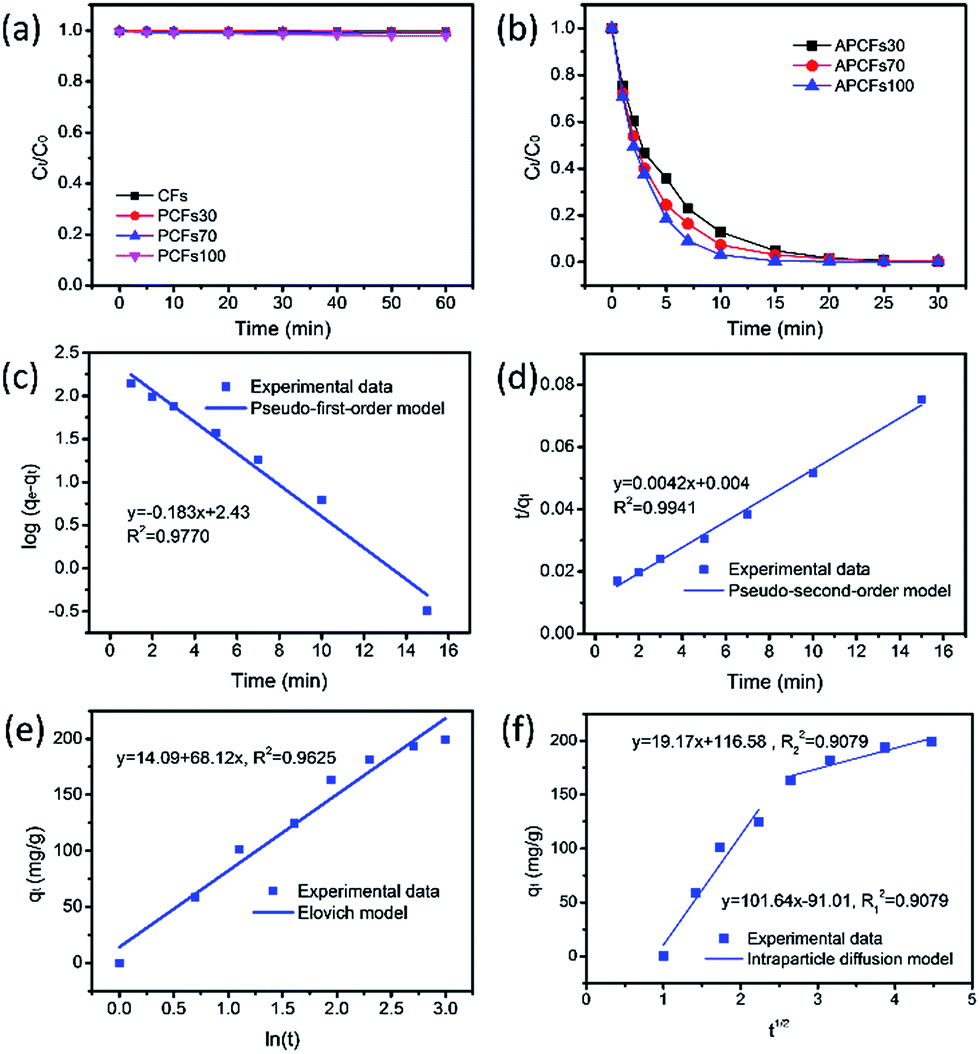
For the organic pollutant removal tests, MeB was employed as a model pollutant to study the adsorption properties. It was obviously observed that the PCFs are incapable of MeB capture due to their closed inner pores (Fig. 6a). After activation, 95.2, 96.9 and 99.6% of MeB were captured by APCFs30, APCFs70 and APCFs100 within 15 min, revealing that the APCFs displayed a fast capture and high adsorption capability toward MeB. To further systematically analyze the adsorption kinetics of MeB on APCFs100, pseudo-first-order, pseudo-second-order, Elovich and intraparticle diffusion models were evaluated, as shown in eqn (1)–(4).| | |
ln(qe − qt) = lnqe − k1t
| (1) |
| |
 | (2) |
| |
 | (3) |
where k1 (min−1) and k2 (g mg−1 min−1) are the corresponding pseudo-first-order and pseudo-second-order adsorption rate constants, respectively, α is the initial adsorption rate (mg g−1 min−1), β is related to the extent of surface coverage and activation energy for chemisorption, qt is the amount of adsorbed dye at time t, t1/2 is the square root of the time and Ci is the intercept at stage i. The value of Ci is related to the thickness of the boundary layer. The values of k2 and qe were calculated from the slope and intercept of the straight portion of the linear plots obtained by plotting t/qt against t. The rate constants of kid and Ci can be obtained from the slope and intercept of the linear regression of the plots of qt versus t1/2.
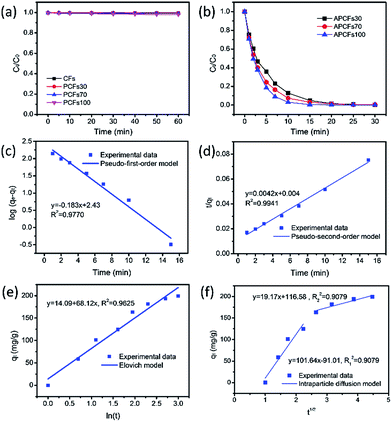 |
| | Fig. 6 The time dependence of relevant carbon fibers for MeB adsorption, (a) without and (b) with KOH activation. The adsorption kinetics of MeB onto APCFs100; (c) pseudo-first-order, (d) pseudo-second-order, (e) Elovich and (f) intraparticle diffusion models. ([MeB] = 20 mg L−1, [adsorbent dosage] = 10 mg, pH = 7 and T = 20 °C). | |
As shown in Fig. 6(c and d), the adsorption rate of the pseudo-first-order kinetic model was 0.183 min−1 with a correlation coefficient of 0.9770 and that of the pseudo-second-order kinetic model was 0.0042 g mg−1 min−1 with a correlation coefficient of 0.9941, revealing that the pseudo-second-order model has a higher regression factor (R2 ≥ 0.9941) than that of the pseudo-first-order model (R2 ≥ 0.9770). Therefore, the adsorption kinetics of MeB adsorption on APCFs100 follow the pseudo-second-order model. In addition, Fig. 6e gives the comparatively low value of a correlation coefficient of 0.9625, demonstrating that the Elovich model was unsuitable to present the adsorption kinetics of MeB onto the APCFs and the adsorption process was not controlled by chemisorption. The plot shown in Fig. 6f is nonlinear and does not pass through the origin, illustrating that intraparticle diffusion was involved in the adsorption process but was not the predominant step. The initial sharp step was the external surface adsorption or instantaneous adsorption stage because the instantaneous availability of APCFs100 with a large surface area can provide more active sites for MeB adsorption. The second gentle step was the gradual adsorption stage because intraparticle diffusion might be a rate-controlling step. After most of the MeB molecules were adsorbed onto APCFs100, the mobility of the free MB molecules was difficult or even hampered, resulting in higher diffusion resistance in the later stage.
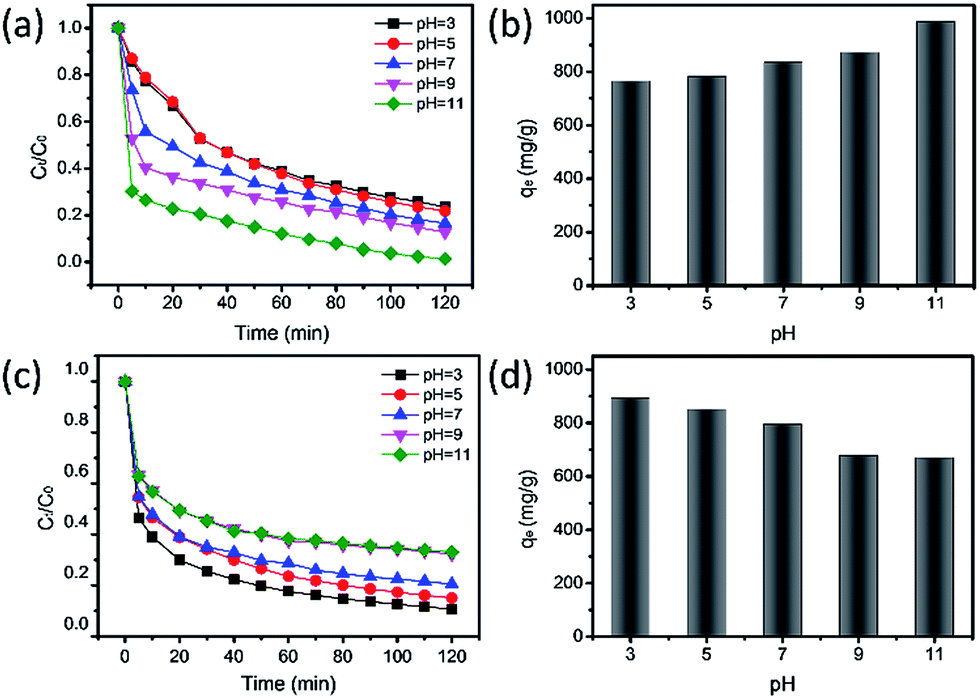
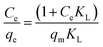
The pH value of solutions in industry dramatically affects adsorption performance according to the law of interactions between electric charges.44 Here, MeB and MO were employed for adsorption tests at different pH values. As shown in Fig. 7(a and c), the adsorption rate of MeB markedly increased as the pH values increased from 3 to 11, and 98.6% of MeB can be adsorbed in 120 min. In contrast, the adsorption rate of MO slightly decreased from 89.3% to 66.9% in 120 min. It is reasoned that the alkaline conditions make APCFs100 possess highly negative charge density for MeB adsorption due to the deprotonation and competitive adsorption of H+ and cationic dye.45 For the same reason, the excellent adsorption performance which occurred at low pH values for anionic charged dyes was due to the protonation and competitive adsorption of OH− and anionic dye. The maximum adsorption capacities of MeB at pH = 11 and MO at pH = 3 in 120 min can reach up to 986.88 mg g−1 and 892.98 mg g−1 as shown in Fig. 7(b and d), respectively, demonstrating that APCFs100 has excellent adsorption capacity for different charged organic dyes.
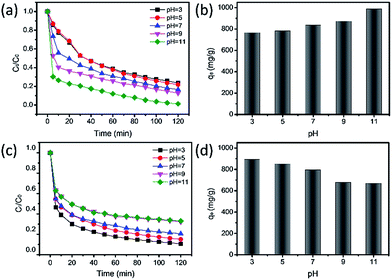 |
| | Fig. 7 The effect of pH values on the adsorption performance toward different charged organic dyes using APCFs100; (a) and (b) for MeB, and (c) and (d) for MO. ([MeB, MO] = 100 mg L−1, [adsorbent dosages] = 10 mg, T = 20 °C). | |
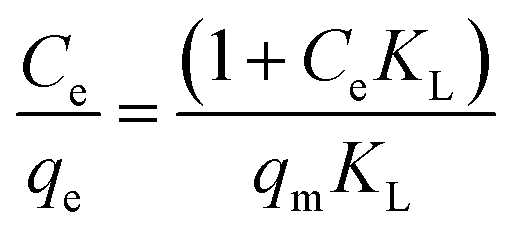
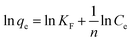
The maximum adsorption capacities of MeB at pH = 3 and pH = 11 can reach 1850 and 2020 mg g−1, respectively, as shown in Fig. 8a, which fits well with the Langmuir plots as shown in Fig. 8b. The exceptional adsorption capacity is comparable with that of the reported adsorbents as listed in Table S2.† For APCFs100, the adverse charged solution with respect to the pollutant can accelerate the adsorption rate (Fig. 7(a and c)), but there seems to be no obvious adsorption capacity change as the pH value was increased from 3 to 11, demonstrating that the ultrahigh adsorption capacity was mainly ascribed to the high SSA with micro/mesoporous structures. To further uncover the adsorption behavior of APCFs100, Langmuir and Freundlich isotherm models were widely employed to study the adsorption behaviors. The isotherms models are expressed as eqn (5) and (6), respectively.
| |
 | (5) |
| |
 | (6) |
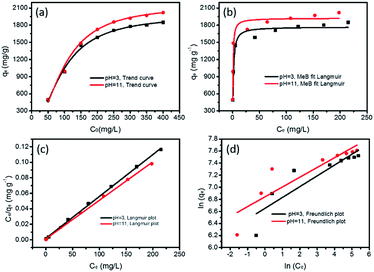 |
| | Fig. 8 MeB adsorption isotherms on APCFs100; (a) trending curve, (b) non-linear fitting by a Langmuir model and linear fitting by (c) a Langmuir and (d) Freundlich model. | |
In the above equations, Ce is the equilibrium concentration of the dye, and qe and qm are the equilibrium and maximum adsorption capacity of APCFs100, which were calculated from experiments. KL is the Langmuir constant, KF is the empirical constant and the value of 1/n is the adsorption intensity or surface heterogeneity. The relevant Langmuir and Freundlich plots for MeB adsorption on APCFs100 are presented in Fig. 8(c and d), and the relevant calculated parameters are listed in Table 1. It is clearly observed that the Langmuir model has higher correlation coefficients of 0.998 and 0.996 than those derived from the Freundlich model of 0.956 and 0.985 at pH = 3 and 11, respectively, suggesting that the surface of APCFs100 is uniform and that monolayer adsorption plays a dominant role in the adsorption process.
Table 1 The evaluated model parameters of the adsorption isotherms of APCFs100 for MeB adsorption at pH = 3 and pH = 11, respectively
| Langmuir model |
Freundlich model |
| pH = 3 |
pH = 11 |
pH = 3 |
pH = 11 |
| qm = 1850 mg g−1 |
qm = 2020 mg g−1 |
1/n = 0.179 |
1/n = 0.162 |
| KL = 0.00185 |
KL = 0.0012 |
KF = 772.78 mg g−1 |
KF = 934.48 mg g−1 |
| R2 = 0.998 |
R2 = 0.998 |
R2 = 0.956 |
R2 = 0.985 |
Moreover, the recyclability of adsorbents is of great importance for their further practical applications because it concerns the effectiveness and economy of the treatment process of organic pollutants. Therefore, sequential experiments were carried out to study the reusability of APCFs100 as shown in Fig. S7.† After 5 cycles, the adsorption capacity of MeB slightly decreased from 834.8 to 680.5 mg g−1 because a small amount of APCFs100 was lost and a certain amount of MeB molecules banded tightly to APCFs100 failed to desorb. Furthermore, the TEM image, N2 ad/desorption isotherm and XRD pattern (Fig. S8†) were used to characterize the recycled APCFs100. From observing the TEM image and XRD pattern there seemed to be no obvious changes, but the N2 ad/desorption isotherm was obviously declining and the SSA decreased to 1852.25 g m−2 because it was difficult for some adsorbed MeB molecules banded to APCFs100 to desorb, finally resulting in the decrease of adsorption capacity.
3.3 Adsorption–oxidation degradation of MeB on APCFs100
It is well known that the traditional adsorption process for complete pollutant removal was time-consuming especially during the late stages of development. Adsorption combined with other physical–chemical processes, such as advanced oxidation, extraction and flocculation, were applied for efficient removal of contaminants in wastewater.46,47 Herein, APCFs100 can simultaneously act as an adsorbent and catalyst for efficient removal of organic pollutants via an adsorption and advanced oxidation process. In order to systematically study the effect of the SSA and pore volume adsorption and catalytic performance, Fig. 9(a and b) shows the effect of the activation process and BA-a content on the performance of catalytic oxidative degradation. For comparison, PMS alone and CFs + PMS were also measured under the same conditions (Fig. 9a), and 27.65% and 30.07% of MeB were consumed in 60 min, demonstrating that the comparatively low SSA with insufficient active sites was adverse to activating PMS. In the case of PCFs for PMS activation, MeB degradation slightly increased from 34.3 to 52.3% in 60 min as the BA-a content in PAN was increased from 30 to 100%. It is worth noting that for APCFs100 the MeB removal significantly increased to 95.1% in 15 min, but the removal efficiency was far less than that of the adsorption performance (99.5%) as shown in Fig. 6b. In previous work, Yang et al. reported that the catalytic oxidative degradation process possibly occurred in the porous bulk or on the boundary layer of activated carbon rather than in the liquid phase.48 Inspired by this point, we further designed adsorption–degradation experiments to confirm the mechanism and determine why adsorption improved more than catalytic performance. First, 20, 40, 60, 80 and 100 mg L−1 of MeB solution was preconcentrated by an adsorption process on APCFs100 for 60 min. Then, 2 mL of PMS solution (25 g L−1) was added into the above solutions, respectively. As shown in Fig. 9c, 20 mg L−1 of MeB solution can be completely adsorbed in 20 min. The other four curves exhibit a sharp slope and the high concentration MeB solutions (40–100 mg L−1) can be completely degraded in another 30 min. In contrast, only 73.1% of MeB was consumed in 90 min, totally depending on the adsorption process (Fig. 6a). The nitrogen doped ultrahigh SSA of APCFs100 exhibited fast MeB removal via synergistic adsorption–degradation processes. It is worth noting that the adsorption–degradation process not only intensified the removal efficiency of MeB, but also realized high TOC removal as shown in Fig. 9d. The TOC removal efficiency decreased from 98.5 to 85.5% as the MeB solutions increased from 40 to 100 mg L−1, revealing that APCFs100 may also act as an adsorbent for partially adsorbing the degraded micromolecules. The degradation rate of MeB over APCFs100 is slightly increased to 8.52% in 10 min after 3 degradation cycles (Fig. 9e). The reason could be that a certain amount of MeB molecules banded to APCFs100 forcibly occupied the active sites during the oxidative degradation process. Electro Paramagnetic Resonance (EPR) experiments were used to demonstrate the reactive oxygen species in the APCFs/PMS system as shown in Fig. 9f. The strong 1:1:1 triplet signal characteristic of TEMP-1O2 confirmed that 1O2 was dominant in MeB degradation. In addition, the 5,5-dimethyl-pyrroline-N-oxide (DMPO) spin-trapping EPR spectra were also used to detect the common ˙OH and SO4˙− species, and no signals for DMPO–˙OH or DMPO–SO4˙− were detected, which illustrated that ˙OH and SO4˙− were not generated in the APCFs/PMS system.49 The degradation mechanism and degraded intermediate products are also discussed and displayed in Fig. S9.†
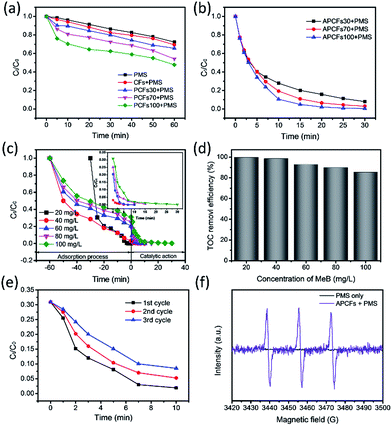 |
| | Fig. 9 MeB oxidative degradation on (a) PCFs and (b) APCFs. The (c) adsorption–degradation and (d) TOC removal efficiency of MeB on APCFs100; the inset shows the magnified catalytic oxidation reaction curves. (e) Reusability test of APCFs for MeB degradation. (f) 2,2,6,6-Tetramethyle-4-piperidone (TEMP) spin-trapping EPR spectra of the ACNFs100/PMS system ([PMS] = 0.5 g L−1, [adsorbent dosage] = 10 mg, pH = 7, T = 20 °C). | |
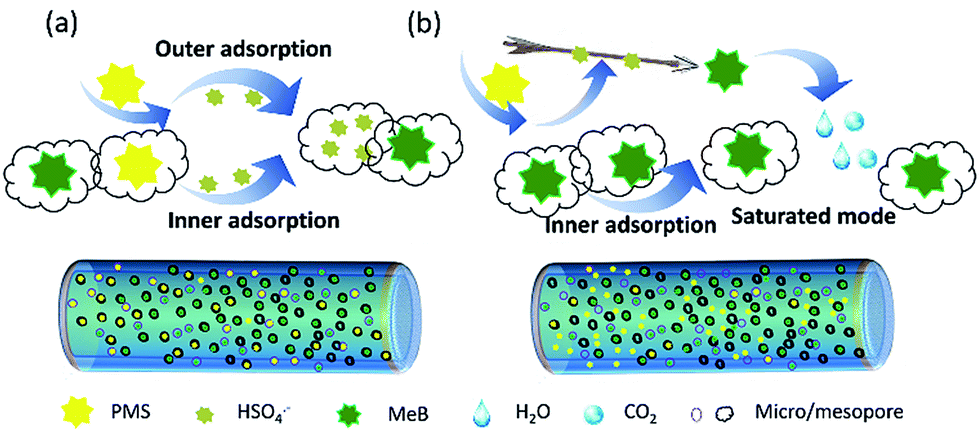
Based on the above discussion, a rational adsorption-catalyst mechanism was proposed as shown in Fig. 10. When the APCFs100 synchronously acts as an adsorbent and catalyst, the hierarchically structured APCFs100 with high SSA rapidly capture the MeB and PMS molecules simultaneously. Then the active radicals activated by APCFs100 can be trapped in the microspores, which forcibly occupies the active sites and finally results in the decrease of adsorption capacity. In contrast, the ad/desorption processes would reach a dynamic equilibrium if the targeted MeB molecules occupy the inner micro/mesopores via pre-adsorption. The PMS activation possibly occurred in the porous bulk or on the boundary layer on the surface of the activated carbon fibers instead of being captured by the inner micro/mesopores. The pre-adsorption process on APCNFs100 provided a good chance to activate PMS with reactive oxygen radicals for MeB degradation.
 |
| | Fig. 10 Schematic illustration of the rational mechanism of adsorption and catalyst on APCFs100; (a) adsorption and catalyst, simultaneously; (b) adsorption and catalyst, respectively. | |
4. Conclusions
In summary, we have presented a robust methodology for creating hierarchical porous carbon fibers with an ultrahigh SSA and pore volume for the synergistic adsorption and catalytic oxidative degradation of MeB. The APCFs100 exhibited a fast capture rate of MeB at a comparatively low concentration; whereas the synergistic effect of adsorption and oxidative degradation processes greatly enhanced the removal efficiency of MeB at high concentrations. Moreover, the synergistic system not only exhibited efficient removal of MeB but also realized high TOC removal. Furthermore, a rational synergistic adsorption-oxidation mechanism for enhancing MeB removal on APCFs100 was proposed. The successful fabrication of hierarchical APCFs provides new insight into the design and development of metal-free adsorbents, catalysts or carbon supports instead of the traditional costly graphene or carbon nanotubes for various applications.
Conflicts of interest
There are no conflicts to declare.
Acknowledgements
The authors gratefully acknowledge the National Natural Science Foundation of China (Grant no. 51573034), the State Key Laboratory of Urban Water Resource and Environment in HIT of China (2016DX02), and the Postdoctoral Science Foundation of Heilongjiang Prov. (LBH-TZ0606 and LBH-Q16012).
Notes and references
- G. M. Gadd, J. Chem. Technol. Biotechnol., 2009, 84, 13–28 CrossRef.
- G. A. R. De Oliveira, J. De Lapuente, E. Teixido, C. Porredon, M. Borras and D. P. De Oliveira, Environ. Toxicol. Chem., 2016, 35, 429–434 CrossRef PubMed.
- Z. Zhu, P. Wu, G. Liu, X. He, B. Qi, G. Zeng, W. Wang, Y. Sun and F. Cui, Chem. Eng. J., 2017, 313, 957–966 CrossRef.
- Z. Zhu, G. Li, G. Zeng, X. Chen, D. Hu, Y. Zhang and Y. Sun, J. Mater. Chem. A, 2015, 3, 22000–22004 Search PubMed.
- Y. Kim, J. Bae, H. Park, J. K. Suh, Y. You and H. Choi, Water Res., 2016, 101, 187–194 CrossRef PubMed.
- X. Zhu, S. An, Y. Liu, J. Hu, H. Liu, C. Tian, S. Dai, X. Yang, H. Wang and C. Abney, AIChE J., 2017, 63, 3470–3478 CrossRef.
- M. Tehrani and R. Zare-Dorabei, RSC Adv., 2016, 6, 27416–27425 RSC.
- S. Giannakis, F. A. G. Vives, D. Grandjean, A. Magnet, L. F. De Alencastro and C. Pulgarin, Water Res., 2015, 84, 295–306 CrossRef PubMed.
- Y. Yang, J. J. Pignatello, J. Ma and W. A. Mitch, Water Res., 2016, 89, 192–200 CrossRef PubMed.
- Y. Huang and Y. Huang, J. Hazard. Mater., 2019, 167, 418–426 CrossRef PubMed.
- Y. Du, W. Ma, P. Liu, B. Zou and J. Ma, J. Hazard. Mater., 2016, 308, 58–66 CrossRef PubMed.
- Y. Yao, H. Chen, C. Lian, F. Wei, D. Zhang, G. Wu, B. Chen and S. Wang, J. Hazard. Mater., 2016, 314, 129–139 CrossRef PubMed.
- F. Zietzschmann, C. Stutzer and M. Jekel, Water Res., 2016, 92, 180–187 CrossRef PubMed.
- C. Guan, J. Jiang, C. Luo, S. Pang, C. Jiang, J. Ma, Y. Jin and J. Li, Environ. Sci. Technol., 2017, 51, 479–487 CrossRef PubMed.
- W. Peng, S. Liu, H. Sun, Y. Yao, L. Zhi and S. Wang, J. Mater. Chem. A, 2013, 1, 5854–5859 Search PubMed.
- Z. Zhu, Y. Xu, B. Qi, G. Zeng, P. Wu, G. Liu, W. Wang, F. Cui and Y. Sun, Environ. Sci.: Nano, 2017, 4, 302–306 RSC.
- S. Peng, G. Jin, L. Li, K. Li, M. Srinivasan, S. Ramakrishna and J. Chen, Chem. Soc. Rev., 2016, 45, 1225–1241 RSC.
- Q. Wei, F. Xiong, S. Tan, L. Huang, E. H. Lan, B. Dunn and L. Mai, Adv. Mater., 2017, 1062300 Search PubMed.
- Z. Xu, J. Huang, W. Chong, X. Qin, X. Wang, L. Zhou and J. K. Kim, Adv.Energy
Mater., 2017, 7, 1602078 Search PubMed.
- H. Liu, P. Sun, M. Feng, H. Liu, S. Yang, L. Wang and Z. Wang, Appl. Catal., B, 2016, 187, 1–10 CrossRef.
- Y. Wang, Z. Ao, H. Sun, X. Duan and S. Wang, Appl. Catal., B, 2016, 198, 295–302 CrossRef.
- J. Ge, Y. Qu, L. Cao, F. Wang, L. Dou, J. Yu and B. Ding, J. Mater. Chem. A, 2016, 4, 7795–7804 Search PubMed.
- Z. Zhu, C. Ji, L. Zhong, S. Liu, F. Cui, H. Sun and W. Wang, J. Mater. Chem. A, 2017, 5, 18071–18080 Search PubMed.
- T. Ren, Y. Si, J. Yang, B. Ding, X. Yang, F. Hong and J. Yu, J. Mater. Chem., 2012, 22, 15919–15927 RSC.
- X. Duan, K. O’Donnell, H. Sun, Y. Wang and S. Wang, Small, 2015, 11, 3036–3044 CrossRef PubMed.
- H. Wang and J. J. Moore, Carbon, 2012, 50, 1235–1242 CrossRef.
- A. Röthlisberger, M. Seita, A. Reiser, E. Shawat, R. Spolenak and G. D. Nessim, Carbon, 2013, 63, 498–507 CrossRef.
- Y. Li, Z. Zhu, J. Yu and B. Ding, ACS Appl. Mater. Interfaces, 2015, 7, 13538–13546 Search PubMed.
- N. Wang, Z. Zhu, J. Sheng, S. S. Al-Deyab, J. Yu and B. Ding, J. Colloid Interface Sci., 2014, 428, 41–48 CrossRef PubMed.
- J. He, W. Wang, F. Sun, W. Shi, D. Qi, K. Wang, R. Shi, F. Cui, C. Wang and X. Chen, ACS Nano, 2015, 9, 9292–9302 CrossRef PubMed.
- Z. Zhu, Y. Liu, H. Hou, W. Shi, F. Qu, F. Cui and W. Wang, Environ. Sci. Technol., 2018, 52, 3027–3036 CrossRef PubMed.
- Z. Zhu, D. Hu, Y. Liu, Y. Xu, G. Zeng, W. Wang, Y. Zhang and F. Cui, J. Appl. Polym. Sci., 2017, 134, 44753 Search PubMed.
- A. Greiner and J. H. Wendorff, Angew. Chem., Int. Ed., 2007, 46, 5670–5703 CrossRef PubMed.
- I. S. Chronakis, S. Grapenson and A. Jakob, Polymer, 2006, 47, 1597–1603 CrossRef.
- X. Wang, B. Ding, G. Sun, M. Wang and J. Yu, Prog. Mater. Sci., 2013, 58, 1173–1243 CrossRef.
- S. H. Yoon, S. Lim, Y. Song, Y. Ota, W. Qiao, A. Tanaka and I. Mochida, Carbon, 2004, 42, 1723–1729 CrossRef.
- V. O. Njoku, K. Y. Foo, M. Asif and B. H. Hameed, Chem. Eng. J., 2014, 250, 198–204 CrossRef.
- E. Raymundo-Piñero, P. Azaïs, T. Cacciaguerra, D. Cazorla-Amorós, A. Linares-Solano and F. Béguin, Carbon, 2005, 43, 786–795 CrossRef.
- Y. Si, T. Ren, Y. Li, B. Ding and J. Yu, Carbon, 2012, 50, 5176–5185 CrossRef.
- S. Indrawirawan, H. Sun, X. Duan and S. Wang, Appl. Catal., B, 2015, 179, 352–362 CrossRef.
- V. L. S. Costas Pelekani, Carbon, 2000, 38, 1423–1436 CrossRef.
- B. Hu, K. Wang, L. Wu, S. Yu, M. Antonietti and M. M. Titirici, Adv. Mater., 2010, 22, 813–828 CrossRef PubMed.
- L. Song, T. Wang, Y. Ma, H. Xue, H. Guo, X. Fan, W. Xia, H. Gong and J. He, Chem.–Eur. J., 2017, 23, 3398–3405 CrossRef PubMed.
- O. G. Apul and T. K. aranfil, Water Res., 2015, 68, 34–55 CrossRef PubMed.
- J. Yan, Y. Huang, Y. Miao, W. Tjiu and T. Liu, J. Hazard. Mater., 2015, 283, 730–739 CrossRef PubMed.
- P. Hu and M. Long, Appl. Catal., B, 2016, 181, 103–117 CrossRef.
- Y. Tian, B. Ju, S. Zhang and L. Hou, Carbohydr. Polym., 2016, 136, 1209–1217 CrossRef PubMed.
- S. Yang, X. Yang, X. Shao, R. Niu and L. Wang, J. Hazard. Mater., 2011, 186, 659–666 CrossRef PubMed.
- Z. Zhu, L. Zhong, Q. Zhang, H. Li, W. Shi, F. Cui and W. Wang, J. Mater. Chem. A, 2017, 5, 25266–25275 Search PubMed.
Footnote |
| † Electronic supplementary information (ESI) available: Synthesis of BA-a, FTIR and 1H NMR characterization of BA-a; FE-SEM images, TEM images, pore size distribution, XPS, BET and XRD analysis of relevant fibers; the degraded products of MeB. See DOI: 10.1039/c8ra02512f |
|
| This journal is © The Royal Society of Chemistry 2018 |
Click here to see how this site uses Cookies. View our privacy policy here. 
 Open Access Article
 This Open Access Article is licensed under a Creative Commons Attribution-Non Commercial 3.0 Unported Licence
 b and
Fuyi Cui
b and
Fuyi Cui