 Open Access Article
Phosphate adsorption onto thermally dehydrated aluminate cement granules
Zhenglin Zha a,
Yongxiang Ren*a,
Shaobin Wang
 *b,
Zhuang Qiana,
Lei Yanga,
Peng Chenga,
Yun Hana and
Man Wangc
aKey Laboratory of Northwestern Water Resource and Environment Ecology of Ministry of Education, Shaanxi Key Laboratory of Environmental Engineering, Xi'an University of Architecture and Technology, Xi'an 710055, China. E-mail: ryx@xauat.edu.cn
bDepartment of Chemical Engineering, Curtin University, GPO Box U1987, Perth, Western Australia 6845, Australia. E-mail: shaobin.wang@exchange.curtin.edu.au
cTianshui Soil and Water Conservation Scientific Experiment Station, The Yellow River Water Conservancy Commission, Tianshui 741000, Gansu, China
First published on 24th May 2018
Abstract
Phosphorus is the main element for eutrophication of water bodies. Aluminate cement is a cheap building material rich in aluminium and calcium which have significant effects on phosphate adsorption. This study aimed at the investigation of removal behavior of phosphate by thermally dehydrated aluminate cement granules, treated at different temperatures, and the adsorption mechanisms. It was found that 600 °C was the optimal temperature, producing excellent granules with a particle size of 0.6–1.5 mm (T600), giving a great adsorption capacity of phosphate of 49.1 mg P per g and presenting fast and high initial adsorption, reaching a capacity of 23.7 mg P per g within 30 min at 20 °C. The phosphate adsorption process was dominated by chemical adsorption, mainly through inner-sphere complexion and phosphate precipitation on the surface of the adsorbent. Compared with other phosphate adsorbents, T600 may be an economical and efficient adsorbent.
1 Introduction
Eutrophication has become a worldwide problem as a large number of nutrients are discharged into water bodies. Eutrophication can cause the degradation of ecological environment of water bodies, and blooms of red tide and blue-green algae, which cause the death of aquatic animals and many other environmental issues.1,2 Phosphorus is believed to be one of the main reasons for the eutrophication of water bodies. It is the limiting element of eutrophication and the nutrient presented in the lowest amount associated with phytoplankton requirements.3–5 Phosphorus emission from increased use of fertilizers into water causes about 30–50% of the eutrophication problem.6 Therefore, removal of phosphorus from water is important for controlling the eutrophication of water bodies.7There are various techniques for the removal of phosphorus, such as biological removal, chemical precipitation and adsorption.8,9 Among them, adsorption has attracted more and more attention due to its efficiency, simple operation and lack of secondary pollution compared to other methods. However, it suffers from some demerits, such as low removal capacity and high cost of adsorbents.10–12
In the past few years, great progress has been made in the development of high-capacity and low-cost adsorbents for phosphate adsorption. Previous research showed that aluminium, iron and calcium in a material have a positive effect on phosphate adsorption, and the materials rich in aluminium and calcium showed better adsorption capacities, such as hydrated Portland cement,13 activated aluminium oxide14 and red mud.15
Aluminate cement is a cementations material, mainly composed of calcium aluminate with 50% of alumina content, and thus has a great potential for adsorption of phosphorus. Aluminate cement has been produced in large quantities in China, being an economical and efficient phosphorus adsorbent. However, its adsorption behaviour in phosphate removal has not been well investigated. In this paper, the use of aluminate cement as an adsorbent for phosphate removal from wastewater was reported and the adsorption characteristics and mechanism were revealed.
2 Material and methods
2.1 Preparation of adsorbents
A commercially available aluminate cement (grade CA50-A700, Zhengzhou, China) was used to prepare hydrated aluminate cement granules (HAC), and the bulk chemical compositions are shown in Table 1. A slurry was firstly prepared by mixing distilled water with 500 g of aluminate cement at a water-cement ratio of 0.45. The slurry was kept sprinkling regularly for 3 days for hardening and 2 days for paste drying at room temperature. After the curing, the solid was crushed and then sieved to a particle size of 0.6–1.5 mm. The thermally dehydrated aluminate cement granules (THACs) were prepared by thermal activation at a temperature range of 100–900 °C for 2 h. The samples were named as HT, where T is the temperature.| Composition | Al2O3 | CaO | Fe2O3 | SiO2 | MgO | (K, Na)2O |
|---|---|---|---|---|---|---|
| Mass fraction (%) | 50.6 | 33.2 | 2.0 | 7.8 | 1.8 | 0.3 |
2.2 Characterization of adsorbents
The specific surface area of the samples was determined by N2 adsorption–desorption isotherms on a V-Sorb2800P at liquid N2 temperature (Gold APP Instrument Corporation, China). Thermogravimetric analysis (TGA/DSC1/1600, Switzerland) was used to determine the weight loss at a heating rate of 10 °C min−1. The morphology and zeta potentials of adsorbents before and after phosphate adsorption were determined by a Quanta 650 FEG scanning electron microscope (SEM, FEI Corporation, USA) and a zeta potential instrument (Malvern Instruments Ltd., UK), respectively. X-ray diffraction (XRD) was used to identify the mineral phases on a DMAX—2400X diffractometer (Rigaku Corporation, Japan) with CuKα radiation (44 kV, 100 mA) and Ni filter, from 10–80° at a scan speed of 4° min−1. Fourier transform infrared spectroscopy (FTIR, IRPrestige-21, Shimadzu Corporation, Japan) was applied to verify the functional groups in the 500–4000 cm−1 spectral range.The strength of adsorbents is represented by the loss rate of mass (Lorm). The Lorm was tested by mixing 5 g of the adsorbents into 50 mL distilled water and stirred at 160 rpm in a shaker for 12 h. Then the adsorbents were taken out, dried and weighed. The Lorm was calculated according to eqn (1):
 | (1) |
2.3 Phosphate adsorption experiments
Phosphate solutions were prepared by dissolving a certain amount of pure KH2PO4 in distilled water. All the phosphate adsorption experiments were carried out in 250 mL conical glass flasks with a fixed dose of adsorbents at 2 g L−1.Typically, the adsorbent of 0.4 g was mixed into a 200 mL phosphate solution with the initial P concentration of 100 mg L−1. The solutions were agitated at 160 rpm in a thermostatic shaker at temperature of 20 °C for 48 h. The phosphate adsorption capacity (q) was calculated from eqn (2).
 | (2) |
The phosphate adsorption kinetics was studied in batch experiments at an initial P concentration of 100 mg L−1 and temperatures of 4 and 20 °C. The residual phosphate in solution was measured at predetermined intervals, and the equilibrium time was obtained when the residual P concentrations remain constantly.
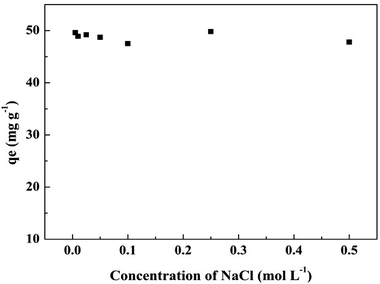
The adsorption isotherm experiments were carried out for 48 h at 4 and 20 °C with the initial P concentration ranged from 100 to 3000 mg L−1. For the study on the influence of initial solution pH, the pH of solution was adjusted from 3 to 11 with 0.1 mol L−1 NaOH or HCl solutions before adding the adsorbent. The initial P concentration was 100 mg L−1, the contact time was 48 h and the temperature was 20 °C. The effect of various anions on the phosphate adsorption behaviour was also examined at the conditions, the initial P concentration of 100 mg L−1, the concentrations of CO32−, SO42−, and NO3− in the form of their sodium salts at 3, 6 and 15 mmol L−1, equilibrium time of 48 h and temperature of 20 °C. The effect of ionic strength on phosphate adsorption was tested in NaCl solutions at concentrations of 0.005–0.5 mol L−1.
3 Results and discussion
3.1 Effect of thermal activation temperature
The specific surface area and pore volume of adsorbent materials have an important influence on the adsorption capacity. The specific surface area (S, m2 g−1) and pore volumes (V, m3 g−1) of the prepared materials are illustrated in Table 2. Generally, the surface area and pore volume increase with the increased temperature and reach the maximum at 600–700 °C. At activation temperatures of 600 and 700 °C, the V values are 0.21 cm3 g−1 and 0.24 cm3 g−1, respectively. The S values of samples T600 and T700 are 24.0 and 24.8 m2 g−1, respectively, which are about 5 times as high as that of HAC. The S and V decrease sharply at 900 °C, giving 7.2 m2 g−1 and 0.12 cm3 g−1, respectively. The results indicated that thermal treatment could increase the S and V of HAC.| Sample | BET surface area (S) (m2 g−1) | Pore volume (V) (cm3 g−1) | Loss rate of mass (Lorm) (%) | Adsorption capacities (mg P per g) |
|---|---|---|---|---|
| HAC | 5.4 | 0.14 | 4.2 | 16.2 |
| T100 | 7.0 | 0.14 | 5.6 | 18.8 |
| T200 | 17.6 | 0.15 | 10.6 | 24.6 |
| T300 | 19.6 | 0.19 | 11.7 | 34.7 |
| T400 | 19.9 | 0.21 | 6.9 | 22.7 |
| T500 | 20.1 | 0.14 | 6.4 | 25.8 |
| T600 | 24.0 | 0.24 | 6.6 | 49.1 |
| T700 | 24.8 | 0.21 | 11.4 | 50.1 |
| T800 | 11.7 | 0.16 | 19.6 | 36.0 |
| T900 | 7.2 | 0.12 | 34.6 | 34.6 |
Loss rate of mass (Lorm) of HAC and THACs are summarized in Table 2. The Lorm increased with the increasing temperature up to 300 °C; the Lorm changed little at 400–600 °C. Then the Lorm increased rapidly at the activation temperature higher than 600 °C. The Lorm of T900 reached 34.6%, which was about more than 6 times as high as that of T600.
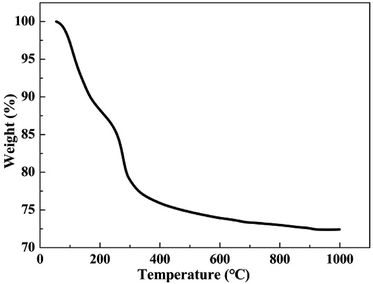
TGA curve of HAC is shown in Fig. 1. It can be observed that the weight of HAC sharply decreased by 21.2% between the ambient temperature to 300 °C. The weight loss of HAC decreased at about 2.9% between 300 °C to 400 °C and then 3.6% from 400 °C to 1000 °C. The HAC is mainly composed of 2CaO·Al2O3·8H2O (C2AH8) and Al(OH)3.16,17 At a temperature below 300 °C, the HAC is very sensitive to the temperature, and free water is lost by evaporation as well as C2AH8 converted to 3CaO·Al2O3·6H2O (C3AH6), leading to the increase of porosity and the decline of structural stability.18,19 After exposure to 400–600 °C, slowly excessive dehydration of C3AH6 and Al(OH)3 occurred, leading to the formation of 12CaO·7Al2O3 (C12A7).18,20 Previous reports showed that the decomposition of limestone and the collapse of the structure happened till 800–900 °C, inducing a rapid decline in the porosity and the structural stability.19,21 These may be the reasons for the least Lorm at 400–600 °C.
Table 2 also shows the phosphate adsorption capacities of HAC and THACs. Thermally treated THACs had different adsorption capacities of phosphate. The adsorption capacity of HAC is only 16.2 mg g−1. With the increase of temperature, the adsorption capacity of THACs fluctuated. The adsorption capacities of phosphate on T600 and T700 were 49.1 and 50.1 mg g−1, respectively, which are 3 times higher than that of HAC for phosphate adsorption. This may be attributed to the larger BET surface area and pore volume of T600 and T700. However, the adsorption capacity of T900 dropped to 33.6 mg g−1.
As it is seen, T600 and T700 had the similar adsorption capacity while the Lorm of T600 was far less than that of T700. Therefore, T600 was selected as a better adsorbent for further research.
3.2 Adsorption kinetics
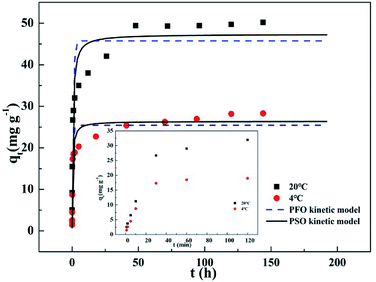
Fig. 2 presents dynamic adsorption of phosphate on T600 at 4 and 20 °C. The adsorption was initially fast and reached the equilibrium in 48 h. In addition, higher temperature significantly improved adsorption capacity. Both the pseudo-first-order (PFO) and pseudo-second-order (PSO) kinetic models were used for modelling the sorption kinetics. The PFO kinetic model could be expressed in eqn (3):| qt = qe(1 − e−k1t) | (3) |
The PSO kinetic model was represented by eqn (4):
| qt = k2qe2t/(1+k2qet) | (4) |
The fitting curves by the PFO and PSO kinetic models are demonstrated in Fig. 2. Table 3 lists the kinetic parameters and the correlation coefficients (R2). The R2 for the PSO kinetic model was higher than that for the PFO kinetic model, and the qe values calculated by the PSO kinetic model were much closer to the experimental qe values, verifying that the adsorption process could be better described by the PSO kinetic model. These indicated that the adsorption of phosphate onto T600 might a chemical adsorption dominated process.22–24 Moreover, the phosphate desorption in water was 1.7 mg g−1, only 3.5% of adsorbed phosphate, also demonstrating strong chemical bonding and a chemical adsorption dominated process.
| T (°C) | The PFO kinetic model | The PSO kinetic model | ||||
|---|---|---|---|---|---|---|
| qe.cal (mg g−1) | k1 (h−1) | R2 | qe.cal (mg g−1) | k2 (g (mg−1 h−1)) | R2 | |
| 4 | 25.4 | 1.84 | 0.906 | 26.4 | 0.10 | 0.953 |
| 20 | 45.8 | 1.18 | 0.885 | 47.3 | 0.040 | 0.943 |
Table 4 summarizes the adsorption capacities of some adsorbent materials in phosphate removal in literature. T600 exhibited a great adsorption capacity. Some adsorbents, such as synthesized Zn–Al LDH,25 zero valent iron,26 ZrO2 nanoparticle22 and lanthanum oxide,14 showed a large adsorption capacity. However, they were fine powders and there will be a lot of problems in practical engineering applications, such as difficult for separation and easily lost in operation. Moreover, the rare-earth metal Zr and La based materials are expensive. Meanwhile, the adsorption capacities of other cheaper materials, activated aluminium oxide,14 Fe–Mn oxide,12 Ca(OH)2 treated clinoptilolite27 and thermally treated red mud,28 were significantly less than T600. On the contrary, T600 has a wide source, low price and large particle size. Although its equilibrium period was relatively longer (Fig. 2), T600 presents fast and high initial adsorption, reaching a capacity of 23.7 mg g−1 within 30 min at 20 °C, which was 50% of the total adsorption capacity.
| Adsorbents | Adsorption capacity (mg P per g) | Initial P concentration (mg P per L) | Initial pH | Dosage (g L−1) | Equilibrium time (h) | Morphology |
|---|---|---|---|---|---|---|
| Synthesized Zn–Al LDH25 | 46.5 | 310 | 7 | 5 | 4 | Powder |
| Hydroxyl-aluminium pillared bentonite29 | 11.2 | 60 | 3 | 4 | 6 | Powder |
| Zero valent iron26 | 35.5 | 200 | 7.2 ± 0.2 | 2.5 | 4 | Powder |
| ZrO2 nanoparticle22 | 99.0 | 50 | 6.2 | 0.5 | 8 | Powder |
| Lanthanum oxide14 | 40 | 100 | 5 | 2.5 | 24 | Particle (1.18 mm) |
| Magnetic Fe–Zr oxide nanoparticle30 | 16.6 | 50 | 4 ± 0.2 | 2 | 24 | Powder |
| Activated aluminium oxide14 | 20 | 50 | 5 | 2.5 | 24 | Particle (1.18 mm) |
| Fe–Mn oxide12 | 11 | 40 | 7.0 | 2.5 | 5 | Particle (1–3 mm) |
| Ca(OH)2 treated clinoptilolite27 | 6 | 100 | 7 | 10 | 168 | Particle (1.2–2 mm) |
| Thermally treated red mud28 | 8.4 | 50 | 6.0 | 4 | 6 | Particle (1.5 mm) |
| T600 | 49.1 | 100 | 4.8 ± 0.1 | 2 | 48 | Particle (0.6–1.5 mm) |
3.3 Adsorption isotherms
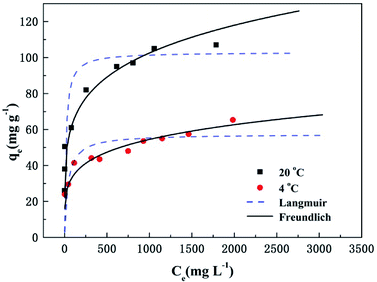
The relationship between amount of adsorbed phosphate onto T600 and its equilibrium concentration was established with both Langmuir and Freundlich isotherm models as given in eqn (5) and (6), respectively:| qe = qmKLCe/(1 + KLCe) | (5) |
 | (6) |
| T (°C) | Langmuir isotherm model | Freundlich isotherm model | ||||
|---|---|---|---|---|---|---|
| qm (mg g−1) | KL (L mg−1) | R2 | KF | 1/n | R2 | |
| 4 | 57.44 | 0.03 | 0.800 | 13.52 | 0.20 | 0.956 |
| 20 | 102.98 | 0.06 | 0.744 | 25.39 | 0.20 | 0.970 |
The low R2 (0.800 and 0.744) value from the Langmuir isotherm indicates that the model is not well suited to describe the adsorption of phosphate by T600. The R2 value (0.956 and 0.970) for the Freundlich isotherm is relatively higher than that of the Langmuir isotherm. Thus, these results suggest that the adsorption of phosphate onto T600 can be best described by the Freundlich isotherm model, which assumes multilayer adsorption on heterogeneous surfaces.31 In addition, the values of 1/n at two temperatures are less than one, indicating that the process of phosphate adsorption on T600 is favourable.25,32
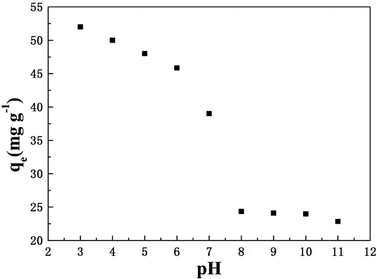
3.4 Effect of pH
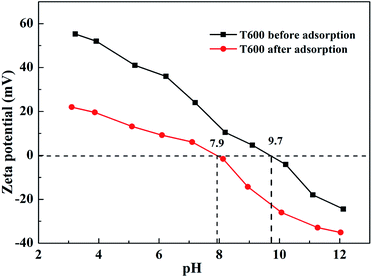
The influence of initial pH on the phosphate adsorption capacity of T600 is demonstrated in Fig. 4. The solution pH has an important impact on the adsorption process. With the increased pH, the adsorption capacity decreased significantly, which was probably due to the changes in surface charge of T600 and phosphate species.The low pH of solution is beneficial to the surface protonation of adsorbents, and the adsorption properties can be improved by the enhanced electrostatic attraction between phosphate anions and the surface of T600.22 With the increase of pH, the positive charge on the surface of the adsorbent reduced. Hence, fewer amounts of the negatively charged phosphate ions will be attracted to the surface of the adsorbent, which may cause a decreased phosphate adsorption capacity. Besides, according to the dissociation equilibrium of phosphate in aqueous solution (H3PO4 ⇌ H+ + H2PO4−, pKa1 = 2.12; H2PO4− ⇌ H+ + HPO42−, pKa2 = 7.21; HPO42− ⇌ H+ + PO43−, pKa3 = 12.33), HPO42− and H2PO4− were the major species of phosphate at pH 3–11, which were negatively charged.33 Phosphate adsorption decreased with the increase of pH due to the enlargement amount of HPO42−. The competitive effect of OH− and phosphate anions on the adsorption sites at high pH also caused the reduction of phosphate adsorption capacity.34 Moreover, the speciation of cations may be another reason, and aluminium forms cationic species at lower pH (such as Al–OH2+), which are easy to react with phosphate ions. However, at higher pH, a part of aluminium forms neutral species (such as Al–OH) and anionic species (such as AlO2− or Al(OH)4−), making them harder to react with phosphate.14,35 Hence, the phosphate adsorption on T600 was better under neutral and acidic conditions.
3.5 Effect of coexisting anions
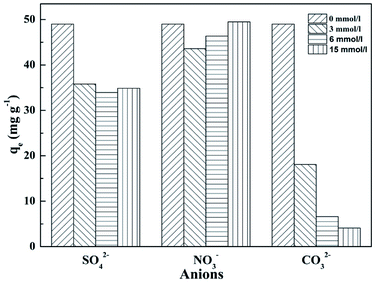
The compositions of natural aquatic ecosystems and actual wastewater are complex and contain many other anions, which might compete with phosphate for the adsorption on T600. Therefore, the effects of several anions (CO32−, SO42− and NO3−) on phosphate adsorption on T600 were examined (Fig. 5). The concentration of phosphate was 100 mg P per L (3.23 mmol L−1) and coexisting anions concentrations were varying at 3, 6 and 15 mmol L−1.NO3− had little effect on phosphate adsorption, suggesting no significant influence by monovalent anions. However, SO42− and CO32− had a great negative effect on phosphate adsorption, reflecting that polyvalent anions were easier to be adsorbed than monovalent anions.36 The effect of SO42− concentration at 3–15 mmol L−1 on phosphate adsorption remained the same while CO32− concentration generated a remarkable influence on phosphate adsorption. The adsorption capacity of phosphate decreased by 90% at CO32− concentration of 15 mmol L−1.
It has been reported that CO32− had strong competition for the adsorption sites on the adsorbent with phosphate ions.30 Moreover, the pH value of solution significantly increased with the addition of CO32−![[thin space (1/6-em)]](https://www.rsc.org/images/entities/char_2009.gif) 36 and the initial pH of solution was 10.7 at the concentration of 15 mmol L−1, which would cause a sharp decrease of phosphate adsorption capacity, as shown in Fig. 5.
36 and the initial pH of solution was 10.7 at the concentration of 15 mmol L−1, which would cause a sharp decrease of phosphate adsorption capacity, as shown in Fig. 5.
Thus, the result showed that T600 had a good selectivity for phosphate adsorption to monovalent anions, but polyvalent anions had a significantly negative influence on the adsorption, in particular, CO32−.
3.6 Discussion on phosphate adsorption mechanisms
ΔG = −RT![[thin space (1/6-em)]](https://www.rsc.org/images/entities/char_2009.gif) ln ln![[thin space (1/6-em)]](https://www.rsc.org/images/entities/char_2009.gif) KD KD
| (7) |
| ΔG = ΔH − TΔS | (8) |
 | (9) |
| T (°C) | ΔH (kJ mol−1) | ΔS (J mol−1) | ΔG (kJ mol−1) |
|---|---|---|---|
| 20 | 42.7 | 154.1 | −4.36 |
| 4 | −1.76 |
The positive value of ΔH (42.7 kJ mol−1) showed that phosphate adsorption on T600 was an endothermic reaction and chemisorption dominated process. The negative values of ΔG indicated that the phosphate adsorption process onto T600 was favourable and spontaneous.38 Also, the value of ΔG decreased (−1.76 to −4.36 kJ mol−1) with the increased temperature from 4 to 20 °C, which directly signified the enhanced feasibility of adsorption process at higher temperature. In addition, the positive value ofΔS indicated the increase in randomness during the adsorption process of phosphate ions on the active sites of T600.40
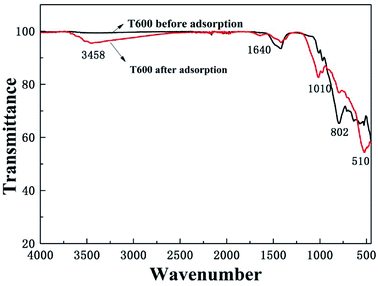
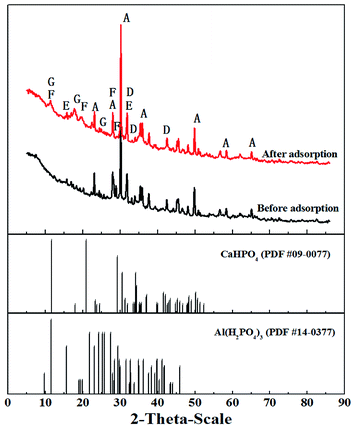
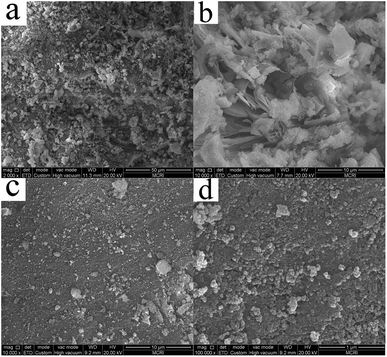
![[double bond, length as m-dash]](https://www.rsc.org/images/entities/char_e001.gif) O bond, proving that phosphate ions were successfully adsorbed onto the adsorbent surface.
O bond, proving that phosphate ions were successfully adsorbed onto the adsorbent surface.
4 Conclusion
Thermal activation of hydrated aluminate cement was investigated for improved phosphate adsorption in aqueous solution. At the optimum activation temperature of 600 °C, sample T600 can reach 23.7 mg P per g rapidly in 30 min and equilibrium adsorption capacity of 49.1 mg P per g at 20 °C and pH of 4.8. Moreover, T600 has a good selectivity for phosphate adsorption to several coexisting ions. The adsorption of phosphate onto T600 was dominated by chemical adsorption, mainly through inner-sphere complexion and phosphate precipitation on the surface. T600 is an economical and efficient phosphate adsorbent for its low cost, large adsorption capacity and engineering practicability for addressing eutrophication problem.Conflicts of interest
There are no conflicts to declare.Acknowledgements
This work was supported by a project from the Science and Technology Co-ordination Innovation Plan of Shaanxi Province, China (2015KTZDSF01-06).Notes and references
- S. P. Boeykens, M. N. Piol, L. Samudio Legal, A. B. Saralegui and C. Vázquez, J. Environ. Manage., 2017, 203, 888–895 CrossRef PubMed.
- P. M. Glibert, Mar. Pollut. Bull., 2017, 124, 591–606 CrossRef PubMed.
- O. F. Schoumans, W. J. Chardon, M. E. Bechmann, C. Gascuel-Odoux, G. Hofman, B. Kronvang, G. H. Rubæk, B. Ulén and J. M. Dorioz, Sci. Total Environ., 2014, 468–469, 1255–1266 CrossRef PubMed.
- J. Huang, C.-c. Xu, B. G. Ridoutt, X.-c. Wang and P.-a. Ren, J. Cleaner Prod., 2017, 159, 171–179 CrossRef.
- J. Liu, G. Wang, L. Lu, Y. Guo and L. Yang, RSC Adv., 2017, 7, 40965–40972 RSC.
- L. Fang, R. Liu, J. Li, C. Xu, L.-Z. Huang and D. Wang, Water Res., 2018, 130, 243–254 CrossRef PubMed.
- R. P. Kralchevska, R. Prucek, J. Kolařík, J. Tuček, L. Machala, J. Filip, V. K. Sharma and R. Zbořil, Water Res., 2016, 103, 83–91 CrossRef PubMed.
- L. Song, J. Huo, X. Wang, F. Yang, J. He and C. Li, Chem. Eng. J., 2016, 284, 182–193 CrossRef.
- W. Wang, C. Ma, Y. Zhang, S. Yang, Y. Shao and X. Wang, J. Environ. Sci., 2016, 45, 191–199 CrossRef PubMed.
- P. Zhang, T. Wang, G. Qian, D. Wu and R. L. Frost, J. Colloid Interface Sci., 2014, 426, 44–47 CrossRef PubMed.
- X. Cui, X. Dai, K. Y. Khan, T. Li, X. Yang and Z. He, Bioresour. Technol., 2016, 218, 1123–1132 CrossRef PubMed.
- X. Du, Q. Han, J. Li and H. Li, J. Taiwan Inst. Chem. Eng., 2017, 76, 167–175 CrossRef.
- J. Y. Park, H. J. Byun, W. H. Choi and W. H. Kang, Chemosphere, 2008, 70, 1429 CrossRef PubMed.
- J. Xie, Y. Lin, C. Li, D. Wu and H. Kong, Powder Technol., 2015, 269, 351–357 CrossRef.
- F. Ni, J. He, Y. Wang and Z. Luan, Journal of Water Process Engineering, 2015, 6, 158–165 CrossRef.
- K. L. Scrivener, J.-L. Cabiron and R. Letourneux, Cem. Concr. Res., 1999, 29, 1215–1223 CrossRef.
- N. Ukrainczyk and T. Matusinović, Cem. Concr. Res., 2010, 40, 128–136 CrossRef.
- V. Antonovič, J. Kerienė, R. Boris and M. Aleknevičius, Procedia Eng., 2013, 57, 99–106 CrossRef.
- W. Khaliq and H. A. Khan, Constr. Build. Mater., 2015, 94, 475–487 CrossRef.
- N. K. Lee, K. T. Koh, S. H. Park and G. S. Ryu, Cem. Concr. Res., 2017, 102, 109–118 CrossRef.
- A. Baradaran-Nasiri and M. Nematzadeh, Constr. Build. Mater., 2017, 147, 865–875 CrossRef.
- Y. Su, H. Cui, Q. Li, S. Gao and J. K. Shang, Water Res., 2013, 47, 5018–5026 CrossRef PubMed.
- J. Lin, Y. Zhan, H. Wang, M. Chu, C. Wang, Y. He and X. Wang, Chem. Eng. J., 2016, 309, 118–129 CrossRef.
- D. Xu, J. Lu, S. Yan and R. Xiao, RSC Adv., 2018, 8, 742–751 RSC.
- H. Hatami, A. Fotovat and A. Halajnia, Appl. Clay Sci., 2018, 152, 333–341 CrossRef.
- N. Sleiman, V. Deluchat, M. Wazne, M. Mallet, A. Courtin-Nomade, V. Kazpard and M. Baudu, Colloids Surf., A, 2017, 514, 1–10 CrossRef.
- D. Mitrogiannis, M. Psychoyou, I. Baziotis, V. J. Inglezakis, N. Koukouzas, N. Tsoukalas, D. Palles, E. Kamitsos, G. Oikonomou and G. Markou, Chem. Eng. J., 2017, 320, 510–522 CrossRef.
- Y. Zhao, Q. Yue, Q. Li, X. Xu, Z. Yang, X. Wang, B. Gao and H. Yu, Chem. Eng. J., 2012, 193–194, 161–168 CrossRef.
- L. G. Yan, Y. Y. Xu, H. Q. Yu, X. D. Xin, Q. Wei and B. Du, J. Hazard. Mater., 2010, 179, 244 CrossRef PubMed.
- C. Zhang, Y. Li, F. Wang, Z. Yu, J. Wei, Z. Yang, C. Ma, Z. Li, Z. Y. Xu and G. Zeng, Appl. Surf. Sci., 2017, 396 Search PubMed.
- H. Yin, M. Kong and C. Fan, Water Res., 2013, 47, 4247–4258 CrossRef PubMed.
- M. El Bouraie and A. A. Masoud, Appl. Clay Sci., 2017, 140, 157–164 CrossRef.
- L. G. Yan, K. Yang, R. R. Shan, T. Yan, J. Wei, S. J. Yu, H. Q. Yu and B. Du, J. Colloid Interface Sci., 2015, 448, 508–516 CrossRef PubMed.
- J. Das, B. S. Patra, N. Baliarsingh and K. M. Parida, Appl. Clay Sci., 2006, 32, 252–260 CrossRef.
- X. Yang, D. Wang, Z. Sun and H. Tang, Colloids Surf., A, 2007, 297, 84–90 CrossRef.
- Y. He, H. Lin, Y. Dong and L. Wang, Appl. Surf. Sci., 2017, 426 Search PubMed.
- W. Y. Huang, R. H. Zhu, F. He, D. Li, Y. Zhu and Y. M. Zhang, Chem. Eng. J., 2013, 228, 679–687 CrossRef.
- S. Yang, Y. Zhao, D. Ding, Y. Wang, C. Feng, Z. Lei, Y. Yang and Z. Zhang, Chem. Eng. J., 2013, 220, 367–374 CrossRef.
- D. Chen, S. Xie, C. Chen, H. Quan, L. Hua, X. Luo and L. Guo, RSC Adv., 2017, 7, 54969–54979 RSC.
- M. V. Subbaiah and D. S. Kim, Ecotoxicol. Environ. Saf., 2016, 128, 109 CrossRef PubMed.
- N. A. Oladoja and B. Helmreich, Journal of Water Process Engineering, 2016, 9, 58–66 CrossRef.
- N. I. Chubar, V. A. Kanibolotskyy, V. V. Strelko, G. G. Gallios, V. F. Samanidou, T. O. Shaposhnikova, V. G. Milgrandt and I. Z. Zhuravlev, Colloids Surf., A, 2005, 255, 55–63 CrossRef.
- T.-H. Hsia, S.-L. Lo, C.-F. Lin and D.-Y. Lee, Colloids Surf., A, 1994, 85, 1–7 CrossRef.
- J. Antelo, M. Avena, S. Fiol, R. López and F. Arce, J. Colloid Interface Sci., 2005, 285, 476–486 CrossRef PubMed.
- L. Reig, L. Soriano, M. V. Borrachero, J. Monzó and J. Payá, Cem. Concr. Compos., 2016, 65, 177–185 CrossRef.
| This journal is © The Royal Society of Chemistry 2018 |

