DOI:
10.1039/C8RA02406E
(Paper)
RSC Adv., 2018,
8, 19690-19700
Hydrothermal synthesis and characterization of novel yellow pigments based on V5+ doped BiPO4 with high near-infrared reflectance†
Received
19th March 2018
, Accepted 17th May 2018
First published on 29th May 2018
Abstract
In this study, a series of novel pigments based on V5+ doped BiPO4 have been prepared for the first time via a facile hydrothermal method and characterized using several analytical techniques, such as X-ray diffraction (XRD), field emission scanning electron microscopy (FE-SEM), ultraviolet-visible-near-infrared (UV-vis-NIR) spectrometry, the Commission International de l’Eclairage (CIE) L*a*b* color scales and thermogravimetry and differential thermal analysis (TG-DTA). The investigation demonstrated that the synthesized pigments of BiP1−xVxO4 (x = 0.00, 0.01, 0.05, 0.08, 0.10, 0.15) had a monazite-type phase structure and were about 0.25–2 μm in size. Meanwhile, the substitution of V5+ for P5+ in BiPO4 resulted in the band gap of the pigments varying from 3.657 to 3.244 eV and its mechanism was explained by charge-transfer and energy band theory, while the color changed from white to yellow. More importantly, the V5+ doped pigments possessed high NIR reflectance (>72%) and NIR solar reflectance (≥75.64%) in the range 700–2500 nm. Moreover, coatings colored with synthetic pigments have higher NIR solar reflectance (≥78.59%) than conventional pigments. Additionally, the pigments showed good thermal/chemical stabilities in high-temperature/acid/alkaline tests. In conclusion, the pigments have the potential to be applied as “cool pigments” to reduce energy consumption.
1. Introduction
The urban heat island phenomenon is increasing, which is mainly due to the replacement of natural vegetation by buildings, causing the temperature of metropolitan centers to rise 10 °C above that in the suburbs.1 There is no doubt that the phenomenon increases energy consumption, especially the demand for air conditioning in large buildings over past decades. To the best of our knowledge, one of the reasons is that buildings absorb radiant energy in the near-infrared region (NIR: 700–2500 nm) of the solar spectrum, which is precisely the region of heat generation over the entire solar spectrum. Therefore, to mitigate the urban heat island effect by reducing the heat build-up, scientists are looking for new smart materials, like NIR-reflective materials2,3 which have high NIR solar reflectance, and are usually bright white.4,5 For example, TiO2, an important NIR-reflective material used extensively in energy-efficient buildings because of its high visible (VIS: 400–700 nm) and NIR reflectance (>85%), is currently considered the best pigment among “cool pigments”.6 However, drawbacks to white pigments are poor esthetics, poor stain resistance, light pollution, etc. It is not always possible to cater to consumers' demands for different colors and functions.7 Hence, more and more attention is being paid to inorganic pigments that not only possess high NIR reflectance, but also high visible light absorbance.8
Rare earth compounds have been proposed as remarkable substitutes for conventional white pigments. For example, Raj et al.9 and Zhang et al.10 synthesized a series of colored inorganic pigments based on terbium-doped yttrium cerate and europium-doped strontium copper silicates and evaluated their color performance and NIR reflectance. Although their properties are good, one problem associated with these inorganic pigments is that their cost is quite high.
Phosphates have already become one of the most researched areas in materials science due to their novel properties.11,12 BiPO4 has been widely used as a photocatalyst13,14 and luminescence material.15 There are two main crystal structures: the hexagonal and monoclinic forms.16 Many researchers have reported the microstructures of BiPO4 and enhanced its optical properties, luminescence properties, and catalytic activity by using various cations as dopants or by complexing with other substances.17–22 In the recent period, studies have shown that some phosphates have a high NIR reflectance and can obtain various colors via doping with different ions. But to our knowledge, few reports have investigated the NIR reflective properties of BiPO4. Moreover, BiPO4 shows advantages of high-temperature chemical stability, oxidation resistance, and relative inexpensiveness compared to rare earth compounds.
In this paper, a series of V5+ doped BiPO4 pigments exhibiting high NIR reflectance were successfully synthesized by a facile hydrothermal method for the first time. The new yellow pigments, whose formula is BiP1−xVxO4 (x = 0.00, 0.01, 0.05, 0.08, 0.10, 0.15), were characterized with respect to crystal structure, morphology, chromaticity, and NIR reflective properties. What is more, we tested the NIR reflectance of coatings pigmented with the new synthetic pigments and conventional pigment and then made a comparison. At the same time, the thermal and chemical stability of these pigments were also evaluated in detail.
2. Experimental section
2.1. Materials
The chemical reagents of bismuth nitrate pentahydrate (Bi(NO3)3·5H2O), sodium dihydrogen phosphate dihydrate (NaH2PO4·2H2O), sodium orthovanadate dodecahydrate (Na3VO4·12H2O) and glycerol (C3H8O3) were of high grade (purity > 99%). All of the starting materials were used as received without further purification processes. Distilled water and absolute ethanol (C2H5OH) were used throughout the whole process.
2.2. Process for the preparation of BiP1−xVxO4 pigments
As a typical experimental process, all the pigments were synthesized by a facile hydrothermal method. According to the formula of BiP1−xVxO4 (x = 0.00, 0.01, 0.05, 0.08, 0.10, 0.15), stoichiometric proportions of the raw materials were added to 80 mL of glycerol/distilled water mixed-solvent (the volume ratio was 1![[thin space (1/6-em)]](https://www.rsc.org/images/entities/char_2009.gif) :19) under vigorous magnetic stirring. The amounts of raw materials for synthesis of BiP1−xVxO4 samples are listed in Table 1. Subsequently, an ultrasonic cleaner was utilized to dissolve the mixture quickly until the mixture was dispersed more evenly. Finally, the mixture was transferred into a Teflon-lined stainless autoclave and the autoclave was sealed and maintained at 160 °C for 24 h. Then, the reactor was cooled to room temperature in running water. The final product was collected, washed with deionized water and absolute alcohol four times, and then dried at 120 °C for 2 h.
:19) under vigorous magnetic stirring. The amounts of raw materials for synthesis of BiP1−xVxO4 samples are listed in Table 1. Subsequently, an ultrasonic cleaner was utilized to dissolve the mixture quickly until the mixture was dispersed more evenly. Finally, the mixture was transferred into a Teflon-lined stainless autoclave and the autoclave was sealed and maintained at 160 °C for 24 h. Then, the reactor was cooled to room temperature in running water. The final product was collected, washed with deionized water and absolute alcohol four times, and then dried at 120 °C for 2 h.
Table 1 Amounts of raw materials essential for preparation of BiP1−xVxO4 samples
| Pigment composition |
Bi(NO3)3·5H2O |
NaH2PO4·2H2O |
Na3VO4·12H2O |
| BiPO4 |
2 mmol |
2 mmol |
0 mmol |
| BiP0.99V0.01O4 |
2 mmol |
1.98 mmol |
0.02 mmol |
| BiP0.95V0.05O4 |
2 mmol |
1.9 mmol |
0.1 mmol |
| BiP0.92V0.08O4 |
2 mmol |
1.84 mmol |
0.16 mmol |
| BiP0.9V0.1O4 |
2 mmol |
1.8 mmol |
0.2 mmol |
| BiP0.85V0.15O4 |
2 mmol |
1.7 mmol |
0.3 mmol |
2.3. Characterization techniques
The crystalline character and phase purity of the synthesized pigments were characterized by powder X-ray diffraction (XRD) at room temperature with a Bruker D8 advance diffractometer using Ni-filtered Cu Kα radiation (1.5406 Å). The morphology of the pigments was observed in a field emission scanning electron microscope (HITACHI, S-4800IIFESEM) (FE-SEM) with an acceleration voltage of 15.0 kV. Energy-dispersive X-ray spectroscopy (EDX) as a qualitative and semi-quantitative analysis accessory was used for the elemental analysis or chemical characterization of a sample.23
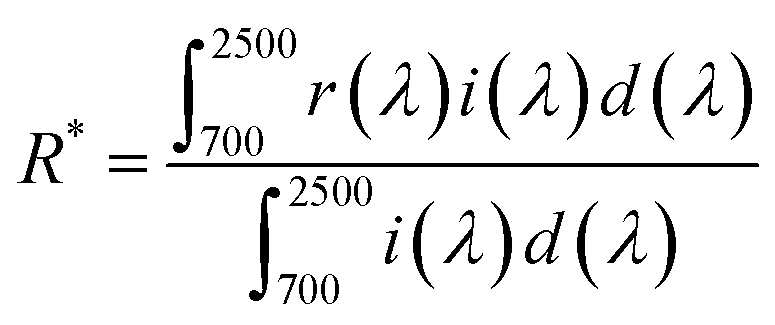
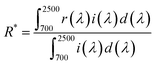
The diffuse reflectance of the samples was measured by an ultraviolet-visible-near-infrared (UV-vis-NIR) spectrophotometer (PerkinElmer Lambda 950 with an integrating sphere attachment), using barium sulfate as the white standard. The NIR solar reflectance (R*) of the pigments and their coatings in the wavelength range from 700 to 2500 nm was calculated in accordance with the American Society of Testing Materials (ASTM) standard number G159-98, as described elsewhere.24 The function R* is given as follows:
| |
 | (1) |
where
r(
λ) (W m
−2) is the spectral reflectance experimentally obtained by the UV-vis-NIR spectrophotometer and
i(
λ) (W m
−2 nm
−1) is the solar special irradiance obtained from the ASTM standard G159-98. The NIR solar reflectance value was used to quantify the solar radiation, evaluate the reflective performance and qualitatively analyze the effect of cooling energy saving. From the diffuse reflectance (
R) spectra achieved with the UV-vis-NIR spectrophotometer, the sample absorption edge and the corresponding value of the band gap can be calculated from the Kubelka–Munk (K–M) reemission function, as follows:
25
The color properties of the pigments were observed by a Konica Minolta (CM-2500d) spectrophotometer with an integrating sphere attachment, and in order to describe the materials' color properties, the color coordinates were established by using the CIE L*a*b* (1976) method which is recommended by the Commission International de l’Eclairage (CIE).26 According to the color coordinate system, a positive a* value is related to a red color; a negative value, to green. A positive b* value is related to a yellow color; a negative value, to blue.27 L* represents the lightness or darkness of the color (L* = 0 for black and L* = 100 for white). The color hue noted by the color coordinate h°, is in the range from 0° to 360° and is defined as h° = tan−1(b*/a*).28 For orange, h° is in the range of 35–70° and for yellow between 70° and 105°. The parameter C* (chroma) expresses the saturation of the color and is defined by using the follow formula:29
| |
 | (3) |
The difference in color between two samples (ΔE*) could be calculated using this formula:30
| |
 | (4) |
The thermal property of the pigments was tested by thermogravimetry and differential thermal analysis (TG-DTA) (HENVEN HCT-4). All experiments were carried out in a ceramic crucible with a heating rate of 5 °C min−1 from 25 °C to 1000 °C under nitrogen conditions.
3. Results and discussion
3.1. Powder XRD analysis
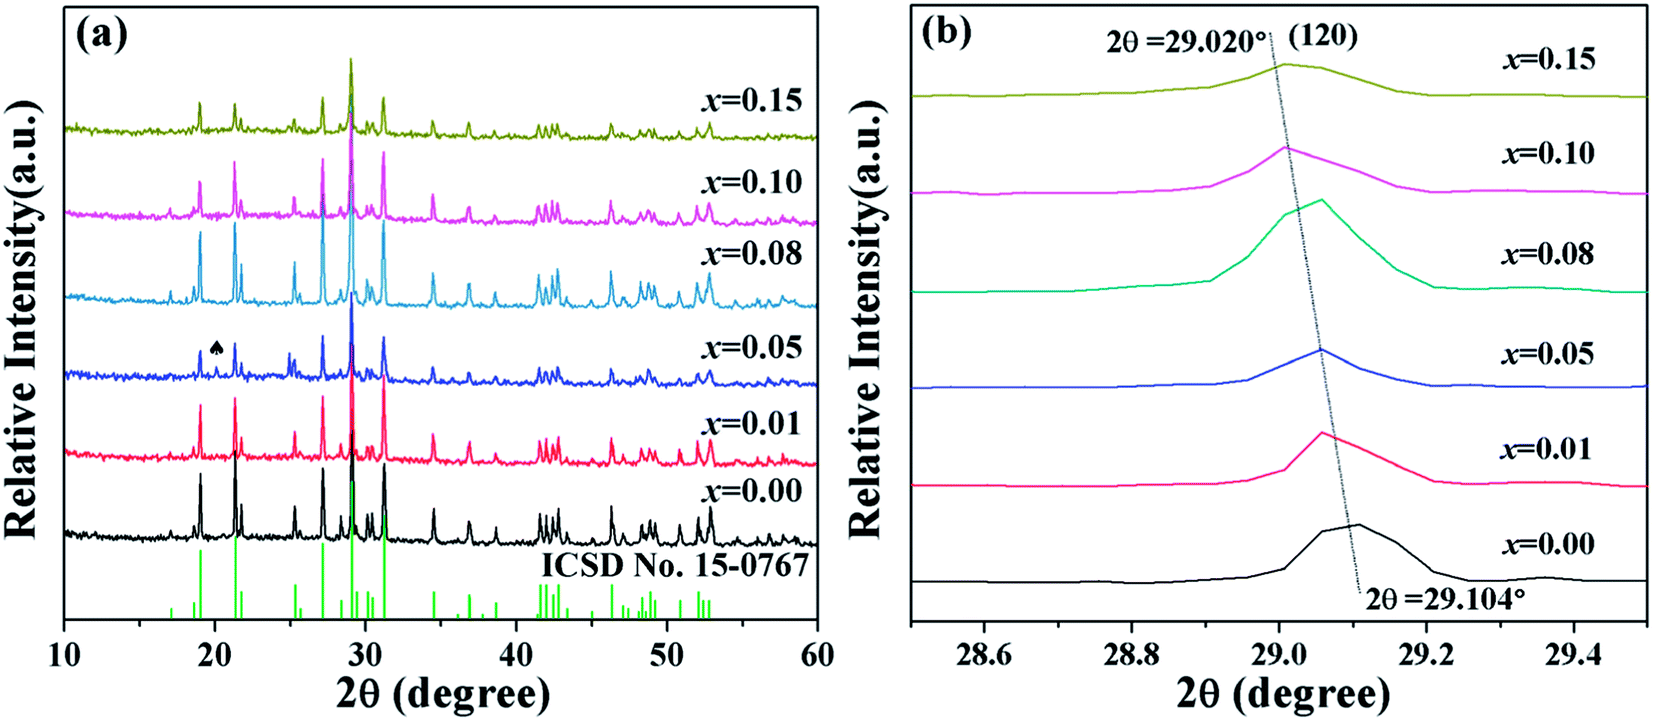
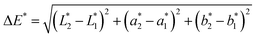
The crystal structure and the phase of pure BiPO4 and BiPO4 microparticles doped with different contents of vanadium were investigated by XRD. As shown in Fig. 1(a), for undoped BiPO4, all the prominent diffraction peaks in the XRD pattern can be well indexed to the pure monoclinic phase (space group P21/n) with lattice constants a = 6.7526, b = 6.9356, c = 6.4713 Å and β = 103.6966°, which is in good agreement with BiPO4 (The Inorganic Crystal Structure Database (ICSD) no. 15-0767), indicating the high purity and crystalline of the samples. For instance, the diffraction peaks at 2θ = 19.033°, 21.352°, 21.757°, 25.295°, 27.170°, 29.104°, 31.223°, 34.510° correspond to the crystal planes (011), (![[1 with combining macron]](https://www.rsc.org/images/entities/char_0031_0304.gif) 11), (101), (111), (200), (120), (012) of BiPO4. After vanadium-doping, although a negligible hexagonal phase is detected in the sample (x = 0.05) at 2θ = 20.066° (ICSD no. 15-0766), which can be put down to the fluctuation in temperature during the synthesis,31–34 with an increase in V-dopant concentration in BiP1−xVxO4, on the whole no conspicuous change in the XRD patterns can be observed. Thus, the structure of BiP1−xVxO4 was not changed, and the diffraction lines were successfully matched to the monazite-type phase.
11), (101), (111), (200), (120), (012) of BiPO4. After vanadium-doping, although a negligible hexagonal phase is detected in the sample (x = 0.05) at 2θ = 20.066° (ICSD no. 15-0766), which can be put down to the fluctuation in temperature during the synthesis,31–34 with an increase in V-dopant concentration in BiP1−xVxO4, on the whole no conspicuous change in the XRD patterns can be observed. Thus, the structure of BiP1−xVxO4 was not changed, and the diffraction lines were successfully matched to the monazite-type phase.
 |
| | Fig. 1 (a) XRD patterns of BiP1−xVxO4 powdered pigments; (b) shift of the Bragg reflections (120) of the doped BiP1−xVxO4 pigments. | |
For the sake of confirming that V5+ enters into the lattice structure of BiPO4 and forms a solid solution, the evolution of Bragg peaks in the XRD patterns was investigated. Fig. 1(b) describes the shift in the Bragg reflections (120) of the BiP1−xVxO4 (x = 0.00, 0.01, 0.05, 0.08, 0.10, 0.15) pigments. As shown in Fig. 1(b), it can clearly be seen that the (120) diffraction peaks shift towards a lower diffraction angle as the concentration of V5+ in the pigments increases (from 2θ = 29.104° to 29.020°). We can theoretically understand the shifting effect according to Bragg's law:
| | |
2dsinθ = nλ
| (5) |
where
d is the inner planar distance,
θ is the diffraction angle,
λ is the diffraction wavelength, and
n is the diffraction series.
35 The above shifting effect of the diffraction peak should be attributed to V
5+ (ionic radius = 0.355 Å; coordination number = 4) with larger ionic radius substituting for P
5+ (ionic radius = 0.170 Å; coordination number = 4) entering into the BiPO
4 lattice and causing lattice expansion.
36 Hence, a solid solution of vanadium in the BiPO
4 lattice is formed in all the prepared pigments.
The crystal structure parameters and the cell volume of the BiP1−xVxO4 samples were calculated with jade6.0 software. As can be seen in Table 2, the parameters were in the same range for different compositions, and no significant increase was observed, but the inner planar distance of the (120) lattice plane and cell volume came to increase in turn when the content of vanadium increased. This variation is relevant to the difference in ionic radius values of P5+ and V5+. Therefore, it can also demonstrate that vanadium is incorporated into the BiPO4 structure.
Table 2 The cell parameters of the BiP1−xVxO4 samples
| x |
D-spacing (120) (Å) |
a (Å) |
b (Å) |
c (Å) |
β (°) |
Volume (Å3) |
| 0.00 |
3.0657 |
6.7526 |
6.9356 |
6.4713 |
103.6966 |
294.46 |
| 0.01 |
3.0684 |
6.7517 |
6.9358 |
6.4732 |
103.7135 |
294.49 |
| 0.05 |
3.0705 |
6.7532 |
6.9362 |
6.4765 |
103.7201 |
294.71 |
| 0.08 |
3.0713 |
6.7505 |
6.9436 |
6.4735 |
103.6952 |
294.80 |
| 0.10 |
3.0740 |
6.7589 |
6.9297 |
6.4830 |
103.7346 |
294.96 |
| 0.15 |
3.0743 |
6.7591 |
6.9351 |
6.4842 |
103.7381 |
295.25 |
3.2. Particle size and morphological analysis
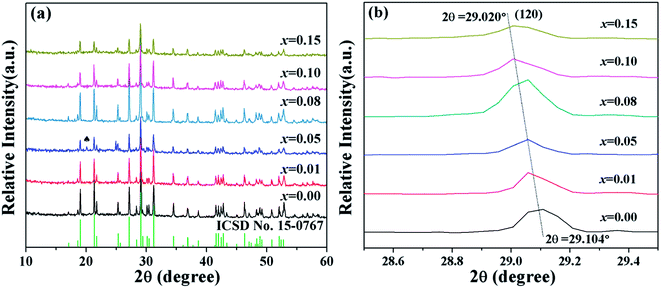
The dispersion and grain size of the pigment particles can be detected by SEM. All samples were granular in nature and presented homogeneous grain sizes. The grain sizes were distributed from 0.25 to 2 μm. The surface morphologies of the typical samples BiPO4 and BiP0.9V0.1O4 are depicted in Fig. 2. For undoped samples, the SEM image shown in Fig. 2(a) displays that the sample is composed of large scales of BiPO4 with an irregular prism-shaped structure. Careful observation reveals that the size of the particles typically ranges from 0.5 to 2 μm, as shown in Fig. 2(b). Fig. 2(c) and (d) show the SEM images of BiP0.9V0.1O4, which show that the sample consisted of irregular rod-like and prism-shaped particles of microscale magnitude, except for some small nanorods. The micrographs also reveal the presence of agglomeration in the samples. Moreover, all the doped samples had similar morphologies; in other words, the doping of V5+ does significantly affect the micro-morphology of the pigments. In addition, there is a tendency for the number of small-sized particles to increase as the doping content increases (some SEM images are shown in the ESI, Fig. S1†). According to K–M theory, the reflectance of materials increases with a decrease in particle size, and the obtained samples contribute to the reflectance of NIR light.
 |
| | Fig. 2 FE-SEM images of BiPO4 ((a) and (b)) and BiP0.9V0.1O4 ((c) and (d)) powdered pigments. EDX spectra of pure BiPO4 (e) and BiP0.9V0.1O4 (f) pigments. | |
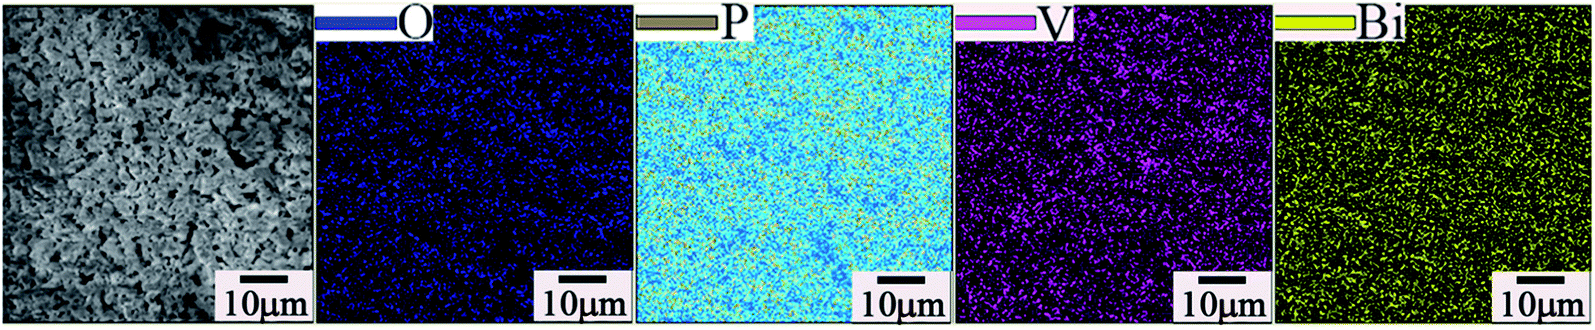
EDX was also used to determine the elemental composition. EDX spectroscopy and the surface elemental composition of the samples are presented in Fig. 2(e) and (f). For pure BiPO4, Fig. 2(e) identifies the presence of all the expected elements. The elemental composition of the doped sample (BiP0.9V0.1O4) was also confirmed by the EDX pattern (as shown in Fig. 2(f)). Besides the P, Bi and O peaks, the peak of element V is also observed, which indirectly indicates that ionic vanadium enters into the lattice structure of BiPO4 in the final samples. Moreover, in the EDX pattern, the corresponding mass ratios of P and V, are 5.01% and 1.61%, respectively, and these values are close to the expected values (9.11% and 1.67%). Additionally, the elemental mapping analysis of a typical BiP0.9V0.1O4 yellow pigment is shown in Fig. 3. This mapping shows that all the elements are uniformly distributed in the lattice. This result proves from another viewpoint that vanadium has doped into the lattice of BiPO4.
 |
| | Fig. 3 Elemental mapping of typical BiP0.9V0.1O4 yellow pigment which confirms that all the elements (O, P, V, Bi) are uniformly distributed in the lattice. | |
3.3. Diffuse reflectance and chromatic properties analysis
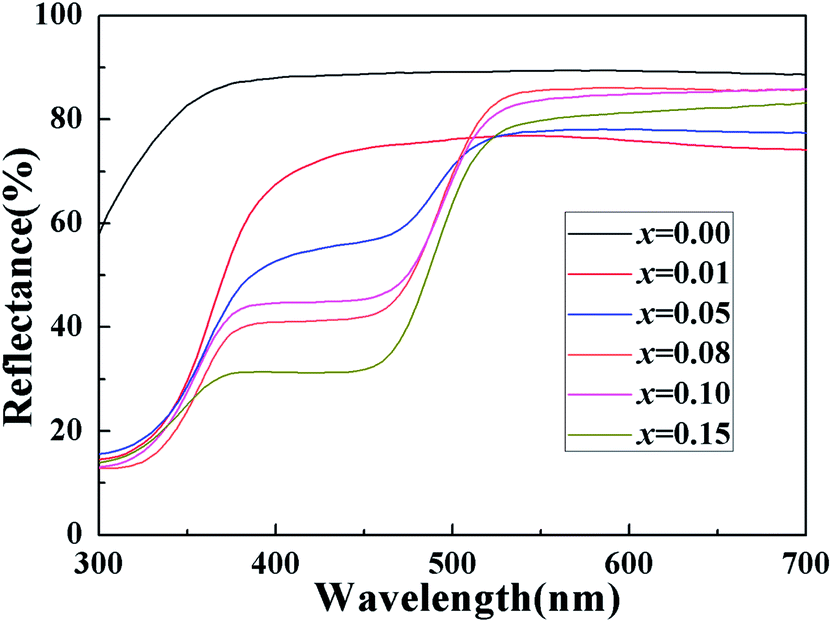
Fig. 4 shows the UV-vis diffuse reflectance curve of the BiP1−xVxO4 (x = 0.00, 0.01, 0.05, 0.08, 0.10, 0.15) powdered samples. As can be seen from the spectra, BiPO4 is almost totally reflective in the visible spectral region, and thus the color of BiPO4 presents as white. The UV-vis diffuse reflectance spectrum of BiPO4 mainly originates from indirect transitions. Compared with pure BiPO4, although the reflectivity of the doped samples in the UV-vis region is reduced, a chromatic color is given (as shown in Fig. 5). In addition, in the 525 to 700 nm waveband, the reflectivity appears to show an increasing trend as the doping amount increases. It is clearly shown that a moderate increase in doping amount is helpful to improve the reflectivity.
 |
| | Fig. 4 UV-vis diffuse reflectance spectrum of BiP1−xVxO4 powdered pigments. | |
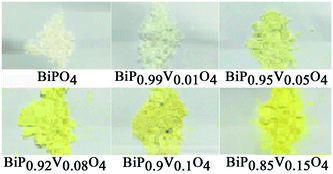 |
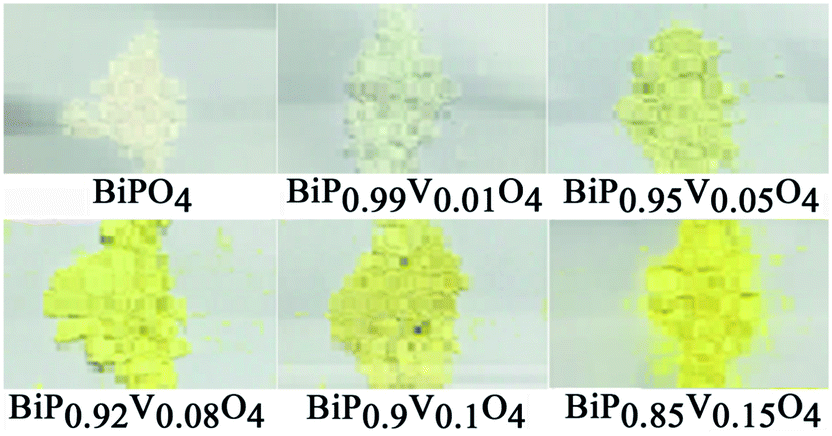
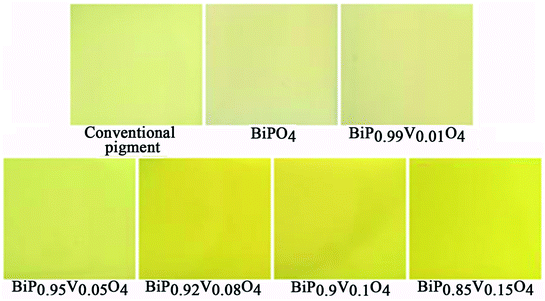
| | Fig. 5 Photographs of pigments of the BiP1−xVxO4 system. | |
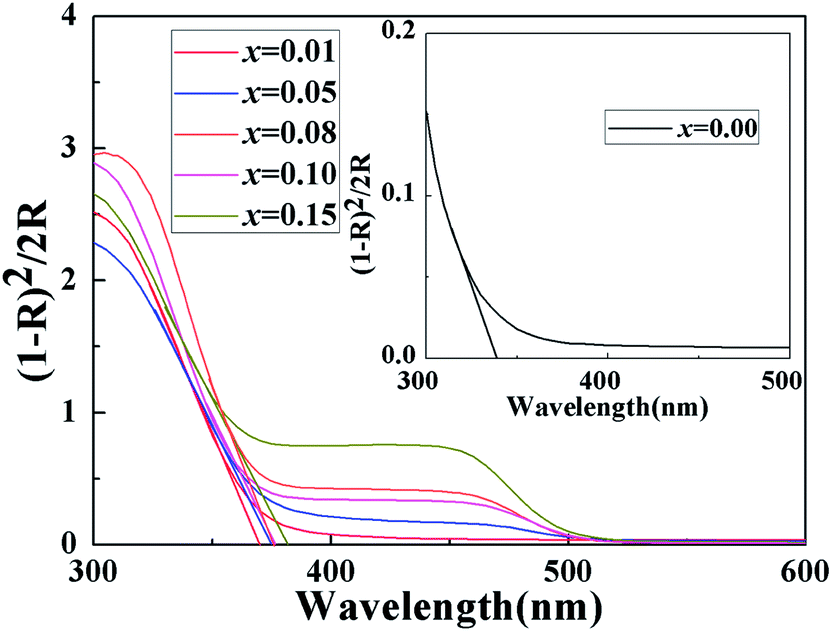
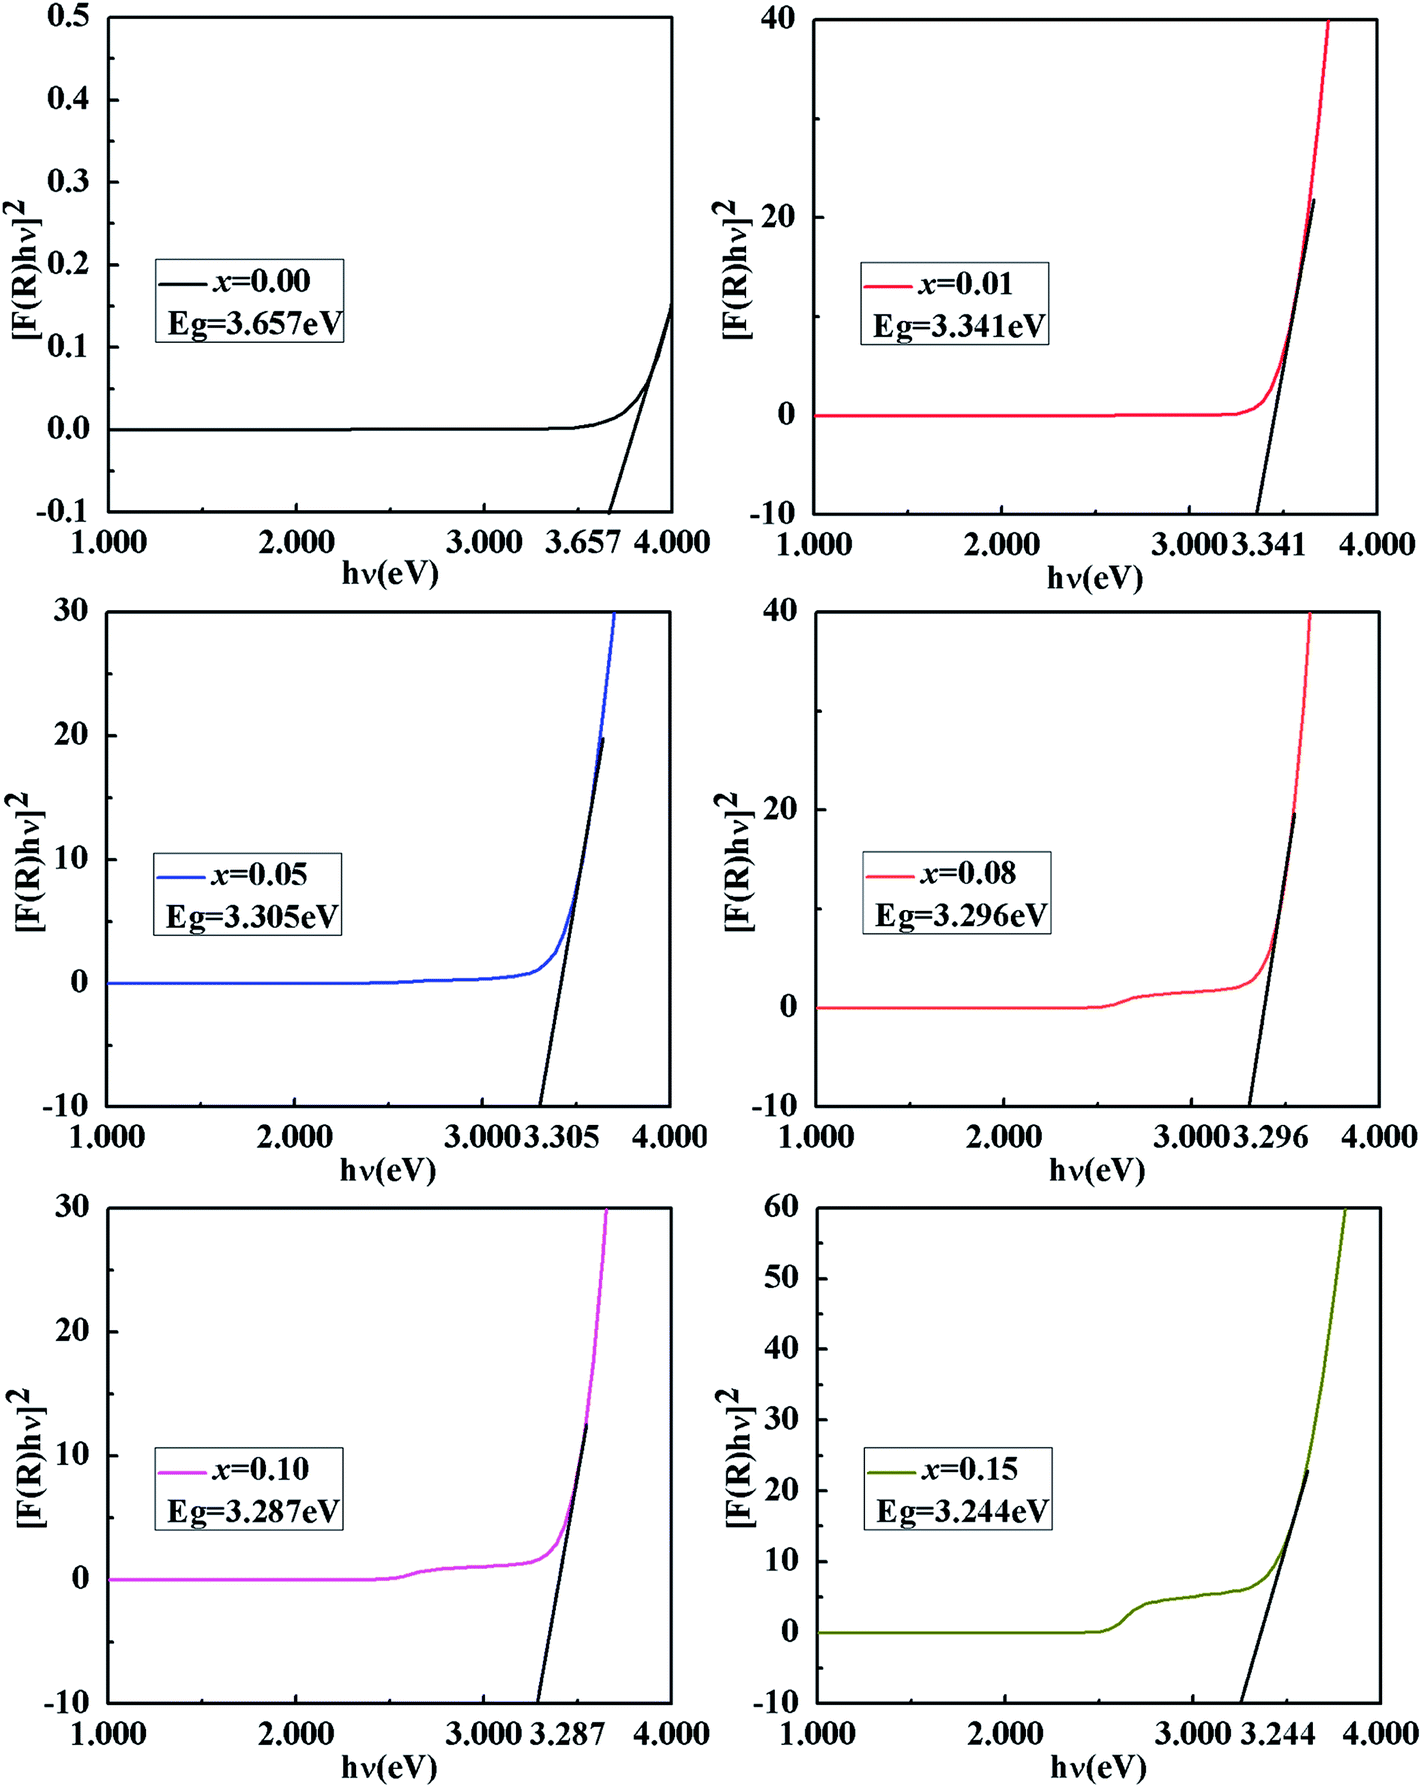
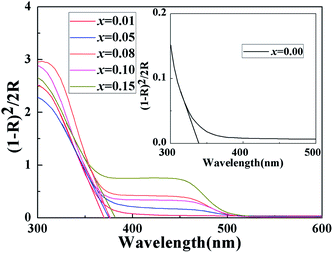
We usually use the K–M reemission function, which is used as a measurement of absorption via powder, to convert the reflectance spectrum to the corresponding absorption spectrum. As shown in Fig. 6, a curve of K–M and wavelength is drawn and the absorption edge is decided from the curve. With the increase in doped V5+, the absorption edge changes from 338 to 381 nm. It should be noted that only the material absorbs visible light, showing color; otherwise it is white or colorless. The absorption edge of BiPO4 occurs at about 338 nm, and it is almost completely reflective in the visible spectral region, so it is white. However, the absorption edge of the doped samples is mainly concentrated in the range of violet light (purple corresponding to the wavelength range of 350–455 nm), thus the color of the samples is yellow according to the principle of complementary colors (see Fig. 4 and 5). The energy band gap can be also obtained by using the K–M reemission function. And the value of the wavelength is replaced in the formula E (eV) = 1236/wavelength (nm). To be more specific, the energy coordinates of the dot on the low-energy side of the plot where the linear increase in the function ([F(R)hν]2) starts have been deemed to be the value of the band gap energy of the semiconductors.37 As shown in Fig. 7, the band gap of the pigments varies over the range from 3.657 to 3.244 eV as the incorporation of V5+ increases, so the color of the samples changes from white to yellow. The band gap of the samples is shown in Table 3. These results clearly confirm that the electronic structures of the BiP1−xVxO4 samples with different doping content are slightly different.
 |
| | Fig. 6 Absorption edge of BiP1−xVxO4 powdered samples measured with K–M theory. | |
 |
| | Fig. 7 K–M transformed reflectance spectra of BiP1−xVxO4 powdered samples. | |
Table 3 Color coordinates, absorption edges and band gaps of BiP1−xVxO4 pigments
| x |
CIE(x, y) |
Color coordinates |
Absorption edges (nm) |
Band gaps (eV) |
| L* |
a* |
b* |
c* |
h° |
| 0.00 |
(0.3145, 0.3323) |
96.85 |
−0.27 |
0.64 |
0.70 |
112.90 |
338 |
3.657 |
| 0.01 |
(0.3150, 0.3331) |
97.78 |
−0.48 |
1.09 |
1.20 |
113.77 |
370 |
3.341 |
| 0.05 |
(0.3369, 0.3630) |
93.59 |
−3.35 |
15.77 |
16.13 |
102.00 |
374 |
3.305 |
| 0.08 |
(0.3605, 0.3894) |
92.99 |
−3.20 |
29.89 |
30.07 |
96.11 |
375 |
3.296 |
| 0.10 |
(0.3564, 0.3845) |
91.33 |
−3.51 |
27.15 |
27.37 |
97.36 |
376 |
3.287 |
| 0.15 |
(0.3714, 0.4051) |
89.74 |
−5.80 |
36.31 |
36.77 |
99.07 |
381 |
3.244 |
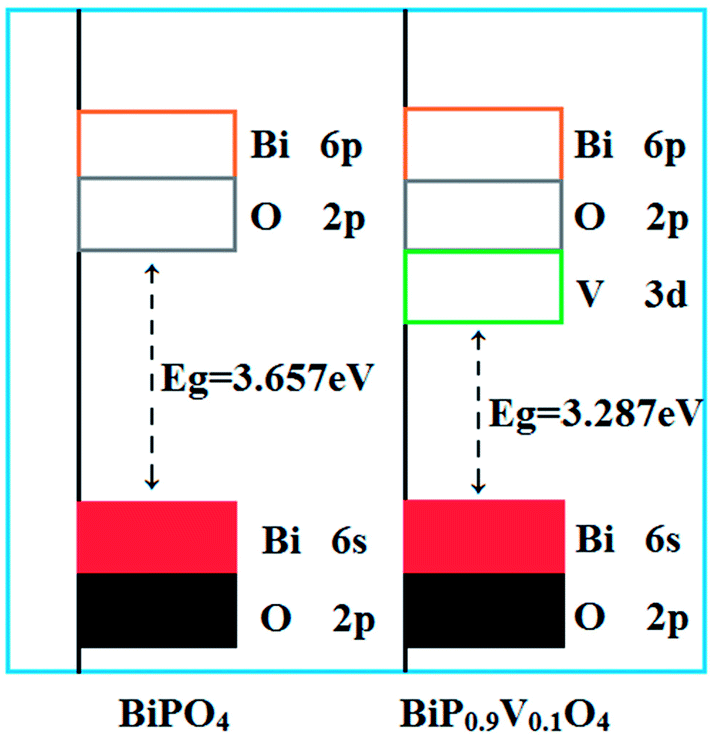
The introduction of vanadium caused a decrease in the band gap and the bathochromic shift of the absorption line can be assigned to the following reasons: (1) the incorporation of vanadium replaces phosphorus and produces vanadium oxy tetrahedra; therefore, one of the reasons could be attributed to the charge-transfer transitions of the [VO4]3− group; (2) for pure BiPO4, the conduction band minimum (CBM) and valence band maximum (VBM) consist of the bismuth 6p orbitals with a small contribution from the oxygen 2p orbitals and the oxygen 2p orbitals with a small contribution from the bismuth 6s orbitals, respectively.32 However, the doping samples have transitioned from the hybrid orbital of the bismuth 6s orbitals and oxygen 2p orbitals to the 3d orbitals of vanadium. That is, another reason is the doping with V5+ cations, resulting in an N-type semiconductor being formed and the bottom of the conduction band decreasing. The schematic band structures of BiPO4 and vanadium ion substituted BiPO4 are shown in Fig. 8. Thus, the energy band gap of the charge-transfer transition gradually decreased during the vanadium-doping process.
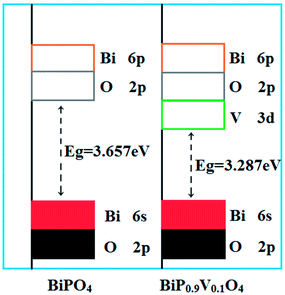 |
| | Fig. 8 Band structure models of BiPO4 and BiP0.9V0.1O4. | |
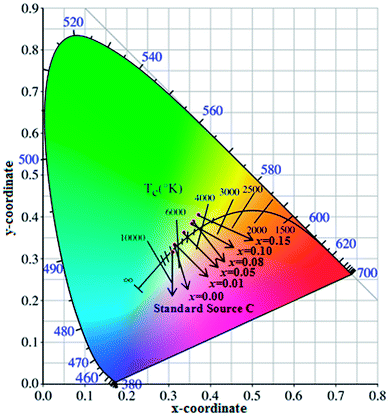
The CIE chromaticity diagram of BiP1−xVxO4 (x = 0.00, 0.01, 0.05, 0.08, 0.10, 0.15) powdered samples is shown in Fig. 9. The CIE chromaticity coordinates (x, y) are deduced on the basis of the following equations38 and the coordinate values are summarized in Table 3.
| |
 | (6) |
| |
 | (7) |
 |
| | Fig. 9 Chromaticity coordinates of BiP1−xVxO4 powdered pigments compared to the 1931CIE Standard Source C. | |
As can be seen from Fig. 9, the chromatic coordinates of BiPO4 and BiP0.99V0.01O4 are near the Standard Source C (illuminant C (0.3101, 0.3162)), and the color of the other samples gets gradually closer to the yellow area as the doping content increases from 0.05 to 0.15, which corresponds with the fact that the color of the samples varies from white to yellow (as shown in Fig. 5), which can be attributed to the substitution of V5+ for P5+ in the BiPO4 crystal lattice, causing the absorption edge of the pigment samples to shift to longer wavelength (338 to 381 nm). In addition, the color temperature marks the different spectral components that pigments contain. As shown in Fig. 9, the spectral components of the samples are mainly concentrated in the yellow part.
The chromatic properties of BiP1−xVxO4 (x = 0.00, 0.01, 0.05, 0.08, 0.10, 0.15) powdered pigments were evaluated by CIE 1976 L*a*b* color coordinates, which are listed in Table 3. On the one hand, the progressive doping of V5+ into BiPO4 results in a continuous increase in the yellow component (b* increases from 0.64 to 36.31) and chroma (C* increases from 0.70 to 36.77) values of the pigments. On the other hand, the substitution of V5+ for P5+ in BiPO4 brings about a small decrease in the green component (a* decreases from −0.27 to −5.80). As a result, the color of the pigments changes from white to yellow. Meanwhile, the changes in color result in a decrease of lightness (L*) from 96.85 to 89.74, which shows that the samples become darker, but this is still higher than the value found by Sandhya Kumari et al.39 who prepared P substituted BiVO4 pigments (L* around 77). Moreover, doping does not have a prominent effect on the hue angle (h°). The hue angles (h°) of vanadium doped BiPO4 pigments (from x = 0.05 to x = 0.15) were found to be in the yellow area about the cylindrical color space (h° = 70–105 for yellow). In a word, these results make this pigment a potential candidate for an environmental yellow pigment.
3.4. NIR reflectance analysis of the powdered pigments
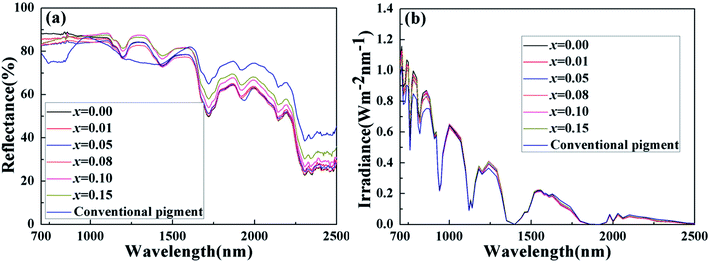
Solar radiation is composed of 5% UV radiation, 43% VIS radiation and 52% NIR radiation. Pigments have colors due to absorbing a lot of visible radiation and reflecting little radiation. Therefore, we concentrate on their NIR reflectance, and the main NIR radiation region ranging from 700 to 1400 nm, within which most solar energy lies.40 The NIR reflectance spectra of the powdered samples BiP1−xVxO4 (x = 0.00, 0.01, 0.05, 0.08, 0.10, 0.15) and a conventional pigment with a similar color, were recorded in the range from 700 to 2500 nm using barium sulfate as a reference, as exemplified in Fig. 10(a). The result according to Fig. 10(a) illustrates that the V5+ doped pigment possesses a high NIR reflectance (>72%) in the range 700–2500 nm with a yellow color and the reflectance of white BiPO4 is more than 80% throughout the NIR spectrum. Among these, when the doping concentration is between 0.08 and 0.15, the NIR reflectance is as high as about 90% and has higher brightness (L* > 89) than the P substituted BiVO4 pigments prepared by Sandhya Kumari et al. (L* around 77).39 At the same time, compared with the currently commercially available nickel antimony titanium yellow rutile pigments (TiNiY), the pigments we have prepared possess a higher NIR reflectance while having similar colors (the TiNiY NIR reflectance is about 72%).41 It is worth noting that we have determined the optimal doping amount to be about 0.1. It can be seen from Fig. 10(a) that when the doping amount reaches 0.1, the reflectivity is the highest. More importantly, the NIR reflectance of the synthesized yellow pigments is higher than that of conventional pigment. Moreover, the NIR reflectance of the BiP0.9V0.1O4 is over 15% higher than that of conventional pigment in the range 700–1500 nm. Some reports indicated that the changes in reflectance of materials can be caused by a combination of various factors, such as electronic structure, particle size, particle size distribution, phase structure, chemical composition, particle morphology and smoothness, density, etc.39,42
 |
| | Fig. 10 (a) NIR reflectance and (b) solar radiation energy distribution of BiP1−xVxO4 powdered pigments. | |
Fig. 10(b) exemplifies the solar radiation energy distribution of the BiP1−xVxO4 system. This clearly confirms that the energy distribution of solar radiation mainly lies in the shortwave range. Table 4 shows the NIR solar reflectance of the samples and of conventional yellow pigment calculated according to ASTM standard number G159-98. It can be clearly seen from Table 4 that the NIR solar reflectance of conventional yellow pigment (R* = 72.43%) is lower than that of all vanadium-doped BiPO4 samples (R* ≥ 75.64%). The NIR solar reflectance of the synthesized pigments evidently increases from 75.64% to 90.16% (from x = 0.01 to x = 0.15). Thus, the BiP1−xVxO4 (x = 0.00, 0.01, 0.05, 0.08, 0.10, 0.15) pigments have potential as “cool pigments” with energy saving performance due to their comparatively high solar reflectance.
Table 4 The values of NIR solar reflectance of powdered samples
| Pigment composition |
NIR solar reflectance |
| Conventional pigment |
72.43% |
| BiPO4 |
86.40% |
| BiP0.99V0.01O4 |
75.64% |
| BiP0.95V0.05O4 |
79.61% |
| BiP0.92V0.08O4 |
87.61% |
| BiP0.9V0.1O4 |
90.16% |
| BiP0.85V0.15O4 |
88.52% |
3.5. NIR solar reflectance analysis of the pigmented coatings
To keep indoors cool in a hot summer, energy saving materials with high solar reflectance are in great demand, especially for nonwhite materials that absorb less NIR radiation. In order to evaluate the performance of the materials as “cool pigments” for cutting down heat build-up, we painted the synthetic pigments onto an aluminum sheet substrate. The preparation method was as follows:43 Firstly, the synthesized pigments or conventional yellow pigment and alkyd resin with a mass ratio of 1:1 were mixed uniformly. Secondly, the homogeneous mixture was painted onto the aluminum sheet substrate (20 mm × 20 mm × 3 mm) and dried in air for about seven days. Fig. 11 presents photographs of the pigmented coatings. Finally, the NIR reflectance of these coatings was assessed with a UV-vis-NIR spectrophotometer.
 |
| | Fig. 11 Photographs of pigments coated onto the aluminum sheet substrate. | |
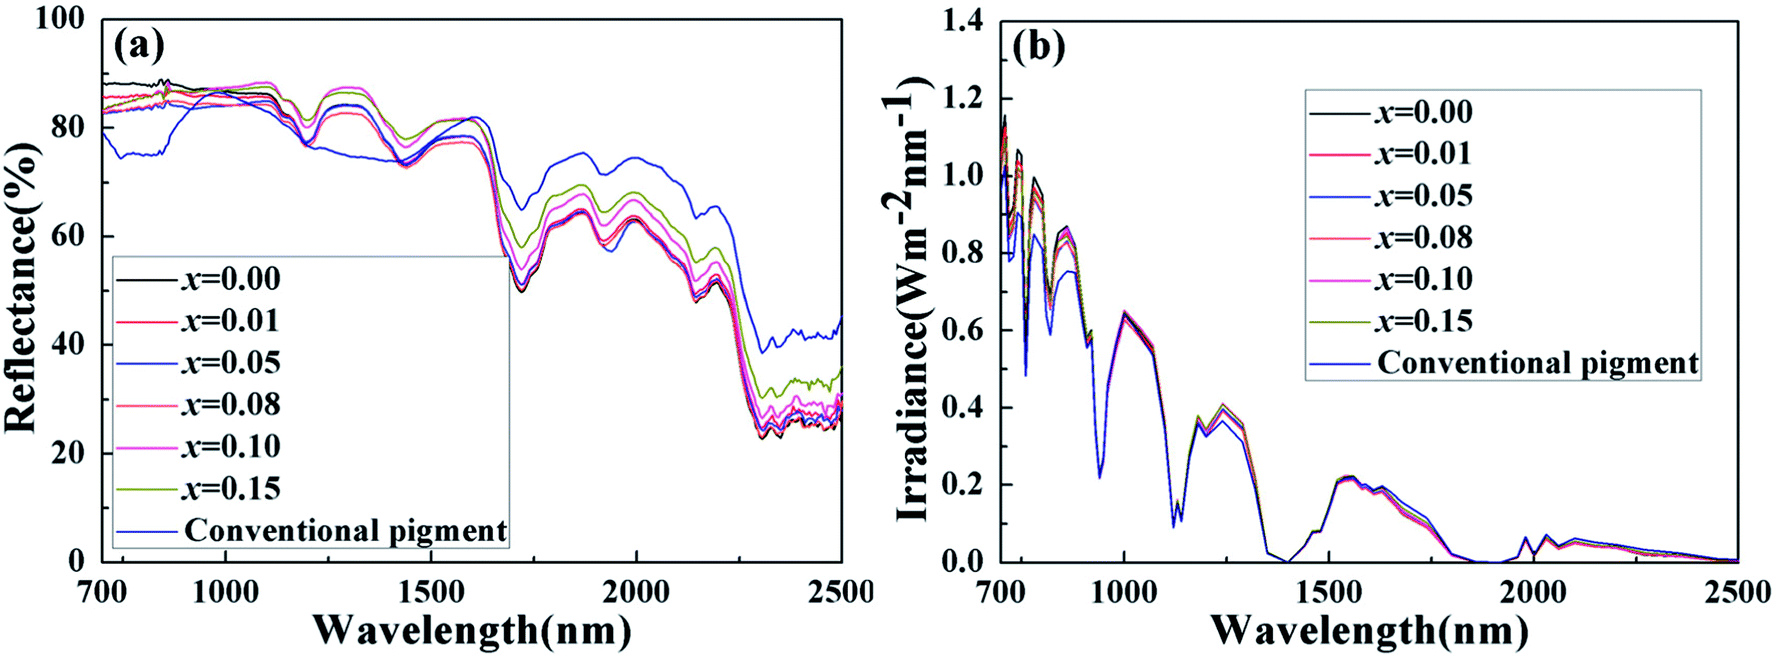
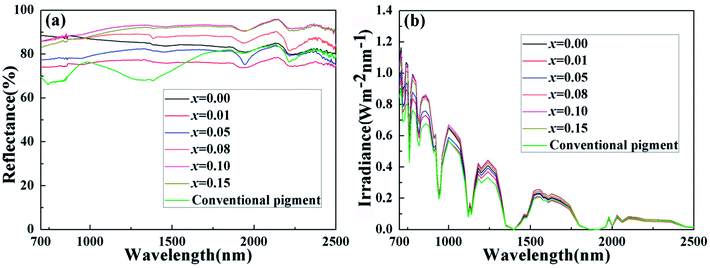
Fig. 12(a) and (b) show the NIR reflectance spectra and the corresponding solar radiation energy distribution of the pigmented coatings, respectively. The curves clearly illustrate that the conventional coating has a lower NIR reflectance than the BiP1−xVxO4 system coatings in the 700–1500 nm region (as shown in Fig. 12(a)). And the NIR solar reflectance values of the pigmented coatings are shown in Table 5. Therefore, although the NIR reflectance of the conventional coating is higher than the BiP1−xVxO4 system pigmented coatings between 1500 nm and 2500 nm, the total NIR solar reflectance is still lower than that of the pigmented coatings we prepared. All of these results indicate that the doped samples we synthesized could be used as potential cool materials, reducing energy consumption for cooling in future.
 |
| | Fig. 12 (a) NIR reflectance and (b) solar radiation energy distribution of the pigmented coatings. | |
Table 5 The detailed values of NIR solar reflectance of the pigmented coatings
| Pigment composition |
NIR solar reflectance |
| Conventional pigment |
77.40% |
| BiPO4 |
81.09% |
| BiP0.99V0.01O4 |
80.24% |
| BiP0.95V0.05O4 |
78.80% |
| BiP0.92V0.08O4 |
78.59% |
| BiP0.9V0.1O4 |
81.50% |
| BiP0.85V0.15O4 |
81.74% |
3.6. Thermal and chemical stability analysis
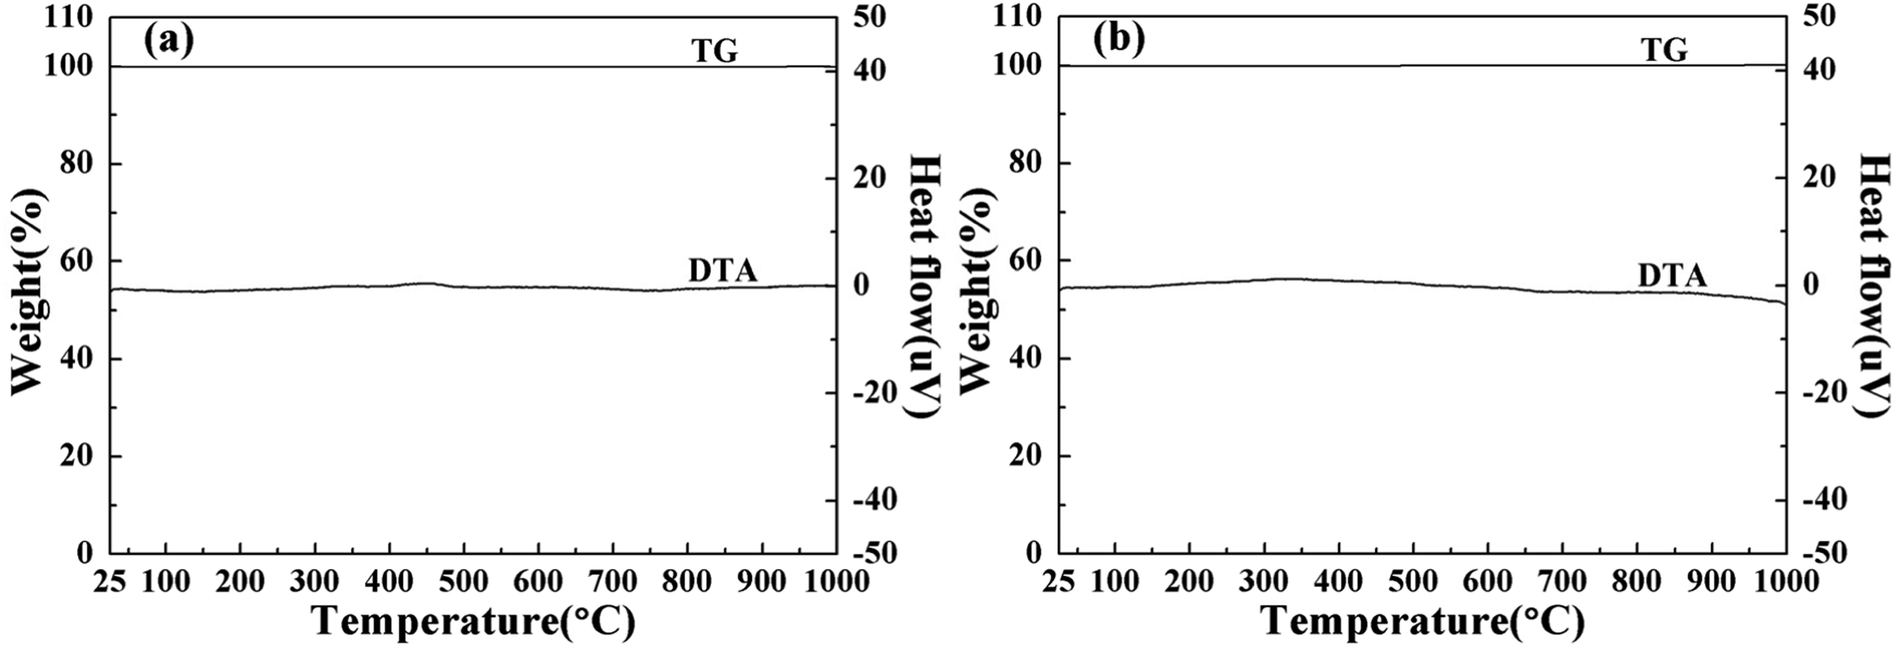
To investigate the thermal performance of the powdered pigments, TG–DTA plots of the typical synthesized pigments BiPO4 and BiP0.9V0.1O4 are depicted in Fig. 13. The thermal behaviour of the samples was followed from room temperature to 1000 °C. The TG curves clearly illustrate that even if the temperature is as high as 1000 °C the pigments undergo no variation in mass. Moreover, the DTA profile indicates no exothermic or endothermic effect whatsoever, which suggests the absence of any physico-chemical transformation in the investigated temperature interval. These results show that the pigments have good thermal stability.
 |
| | Fig. 13 TG–DTA curves of (a) BiPO4 and (b) BiP0.9V0.1O4 powdered samples. | |
Chemical stability is very crucial to the performance of pigments. And in order to evaluate the chemical stability of the typical synthesized samples, the water and acid/alkali resistance of the typical pigment BiP0.9V0.1O4, was investigated using 10%H2SO4, 10%HNO3, 10%NaOH solution and H2O, respectively. And the concentration of the solution was five times higher than that of the standard (GB/T 5211.5-2008). A pre-weighed quantity of a typical pigment was treated with water, acid/alkali and soaked for ten minutes with constant stirring via a magnetic stirrer. Then the powdered sample was filtered, washed with deionized water several times, dried and weighed again. The results indicated that the weight loss of the pigment sample can be ignored after testing in acid, alkali and water. Table 6 shows the color coordinates of the pigment after the water, acid and alkali treatment. For industrial application of inorganic pigments, high color durability (ΔE* values less than 2 or 3) is required.44 Compared with the untreated sample, the small values of ΔE* confirm that the chemical stability of the pigment is better. They also indicated that the water and acid resistances of the samples are very good.
Table 6 The color coordinates of the treated BiP0.9V0.1O4 pigments
| No. |
L* |
a* |
b* |
ΔE* |
| In air |
91.33 |
−3.51 |
27.15 |
— |
| H2O |
91.45 |
−3.37 |
26.94 |
0.28 |
| NaOH |
90.91 |
−4.12 |
29.28 |
1.98 |
| H2SO4 |
90.40 |
−3.75 |
26.90 |
0.99 |
| HNO3 |
90.61 |
−3.21 |
26.77 |
0.87 |
4. Conclusions
In this paper, we have employed a facile hydrothermal method to synthesize a series of inorganic pigments BiP1−xVxO4 (x = 0.00, 0.01, 0.05, 0.08, 0.10, 0.15) for the first time, which display a range of colors from white to yellow, which can be attributed to the substitution of V5+ for P5+ in the BiPO4 crystal lattice, causing the absorption edge of the pigment samples to shift to longer wavelength (338 to 381 nm). The doped samples are similar in morphology and their sizes are in the range of 0.25 to 2 μm. More importantly, these pigments exhibited high NIR reflectance (>72%) in the range 700–2500 nm, and possessed higher NIR solar reflectance than a conventional pigment with a similar color, whether they are in powder (R* ≥ 75.64%) or coating form (R* ≥ 78.59%). Moreover, the pigments presented excellent coloring performance when coated on an aluminum sheet substrate and showed good thermal/chemical stability. To sum up, our results suggest that these vanadium doped BiPO4 pigments could be used as novel cool color pigments in future. For example, they could be used as roofing materials to reduce heat build-up.
Conflicts of interest
There are no conflicts of interest to declare.
Acknowledgements
This project was funded by the Priority Academic Program Development of Jiangsu Higher Education Institutions.
References
- R. Oka and T. Masui, RSC Adv., 2016, 6, 90952–90957 RSC.
- W. Zheng and J. Zou, RSC Adv., 2015, 5, 87932–87939 RSC.
- E. S. Cozza, M. Alloisio, A. Comite, G. Di Tanna and S. Vicini, Sol. Energy, 2015, 116, 108–116 CrossRef.
- R. Levinson, P. Berdahl and H. Akbari, Sol. Energy Mater. Sol. Cells, 2005, 89, 319–349 CrossRef.
- R. Levinson, P. Berdahl and H. Akbari, Sol. Energy Mater. Sol. Cells, 2005, 89, 351–389 CrossRef.
- L. Yuan, X. Weng, M. Zhou, Q. Zhang and L. Deng, Nanoscale Res. Lett., 2017, 12, 597 CrossRef PubMed.
- Y. Shi, M. Zhong, Z. Zhang and D. Wang, Ceram. Int., 2017, 43, 5979–5983 CrossRef.
- L. Yuan, A. Han, M. Ye, X. Chen, C. Ding and L. Yao, Ceram. Int., 2017, 43, 16488–16494 CrossRef.
- A. K. V. Raj, P. Prabhakar Rao, S. Sameera and S. Divya, Dyes Pigm., 2015, 122, 116–125 CrossRef.
- Y. Zhang, Y. Zhang, X. Zhao and Y. Zhang, Dyes Pigm., 2016, 131, 154–159 CrossRef.
- Z. Wu, R. R. Huang, H. Yu, Y. C. Xie, X. Y. Lv, J. Su, Y. F. Long and Y. X. Wen, Materials, 2017, 10, 134 CrossRef PubMed.
- P. Dong, G. Hou, C. Liu, X. Zhang, H. Tian, F. Xu, X. Xi and R. Shao, Materials, 2016, 9, 968 CrossRef PubMed.
- Y. Li, Y. Wang, Y. Huang, J. Cao, W. Ho, S. Lee and C. Fan, RSC Adv., 2015, 5, 99712–99721 RSC.
- H. Lv, J. Guang, Y. Liu, H. Tang, P. Zhang, Y. Lu and J. Wang, RSC Adv., 2015, 5, 100625–100632 RSC.
- A. I. Becerro, J. Criado, L. C. Gontard, S. Obregón, A. Fernández, G. Colón and M. Ocaña, Cryst. Growth Des., 2014, 14, 3319–3326 Search PubMed.
- J. Wang, J. Li, H. Li, S. Duan, S. Meng, X. Fu and S. Chen, Chem. Eng. J., 2017, 330, 433–441 CrossRef.
- J. Zhang, Z. Yu, J. Guo, W. Yan and W. Xue, J. Alloys Compd., 2017, 703, 156–162 CrossRef.
- X. Shi, Y. Liu, J. Zhang, K. Zhang, J. Li, H. Zuo and P. Li, Ceram. Int., 2015, 41, 6683–6686 CrossRef.
- M. H. Fulekar, A. Singh, D. P. Dutta, M. Roy, A. Ballal and A. K. Tyagi, RSC Adv., 2014, 4, 10097–10107 RSC.
- J. Cao, B. Xu, H. Lin and S. Chen, Chem. Eng. J., 2013, 228, 482–488 CrossRef.
- Y. Zhu, Q. Ling, Y. Liu, H. Wang and Y. Zhu, Appl. Catal., B, 2016, 187, 204–211 CrossRef.
- H. Dong, Z. Cao, R. Shao, Y. Xiao, W. He, Y. Gao and J. Liu, RSC Adv., 2015, 5, 63930–63935 RSC.
- R. Yang, A. Han, M. Ye, X. Chen and L. Yuan, Sol. Energy Mater. Sol. Cells, 2017, 160, 307–318 CrossRef.
- ASTM G159-98, American Society for Testing and Materials, West Conshohocken, PA, USA, 1998.
- Y. A. Alsabah, M. S. AlSalhi, A. A. Elbadawi and E. M. Mustafa, Materials, 2017, 10, 469 CrossRef PubMed.
- C. I. de l'Eclairage, Recommendations on Uniform Colour Spaces, Colour Difference Equations, Psychometrics Colour Terms, Paris: CIE, 1978 Search PubMed.
- S. Jose and M. L. Reddy, Dyes Pigm., 2013, 98, 540–546 CrossRef.
- R. Oka, Y. Shobu, F. Aoyama, T. Tsukimori and T. Masui, RSC Adv., 2017, 7, 55081–55087 RSC.
- T. Tsukimori, Y. Shobu, R. Oka and T. Masui, RSC Adv., 2018, 8, 9017–9022 RSC.
- K. Mokhtari and S. Salem, RSC Adv., 2017, 7, 29899–29908 RSC.
- B. S. Naidu, B. Vishwanadh, V. Sudarsan and R. K. Vatsa, Dalton Trans., 2012, 41, 3194–3203 RSC.
- C. Pan and Y. Zhu, Catal. Sci. Technol., 2015, 5, 3071–3083 Search PubMed.
- S. N. Achary, D. Errandonea, A. Munoz, P. Rodriguez-Hernandez, F. J. Manjon, P. S. Krishna, S. J. Patwe, V. Grover and A. K. Tyagi, Dalton Trans., 2013, 42, 14999–15015 RSC.
- Y. Wang, X. Guan, L. Li and G. Li, CrystEngComm, 2012, 14, 7907–7914 RSC.
- Y. Liu, Y. Lv, Y. Zhu, D. Liu, R. Zong and Y. Zhu, Appl. Catal., B, 2014, 147, 851–857 CrossRef.
- R. D. Shannon, Acta Crystallogr., Sect. A: Cryst. Phys., Diffr., Theor. Gen. Crystallogr., 1976, 32, 751–767 CrossRef.
- S. Wang, M. Jiang, L. Gao, Z. Ma and F. Wang, Materials, 2016, 9, 55 CrossRef PubMed.
- A. Tücks and H. P. Beck, J. Solid State Chem., 2005, 178, 1145–1156 CrossRef.
- L. Sandhya Kumari, P. Prabhakar Rao, A. Narayana Pillai Radhakrishnan, V. James, S. Sameera and P. Koshy, Sol. Energy Mater. Sol. Cells, 2013, 112, 134–143 CrossRef.
- A. Han, M. Ye, M. Zhao, J. Liao and T. Wu, Dyes Pigm., 2013, 99, 527–530 CrossRef.
- G. Zeng, J. Yang, R. Hong, Z. Li, Y. Chen, F. Li, Q. Wu, L. Liu and X. Jiang, Ceram. Int., 2018 Search PubMed.
- L. Gao, Z. Ma, S. Wang, F. Wang and C. Yang, Materials, 2014, 7, 4982–4993 CrossRef PubMed.
- L. Yuan, A. Han, M. Ye, X. Chen, L. Yao and C. Ding, Dyes Pigm., 2018, 148, 137–146 CrossRef.
- B. Bae, N. Takeuchi, S. Tamura and N. Imanaka, Dyes Pigm., 2017, 147, 523–528 CrossRef.
Footnote |
| † Electronic supplementary information (ESI) available. See DOI: 10.1039/c8ra02406e |
|
| This journal is © The Royal Society of Chemistry 2018 |
Click here to see how this site uses Cookies. View our privacy policy here. 
 Open Access Article
 This Open Access Article is licensed under a Creative Commons Attribution-Non Commercial 3.0 Unported Licence
 *,
Mingquan Ye,
Yu Zhang,
Lingyun Yao and
Jiling Yang
*,
Mingquan Ye,
Yu Zhang,
Lingyun Yao and
Jiling Yang