 Open Access Article
Creative Commons Attribution 3.0 Unported Licence
Dense, uniform, smooth SiO2/TiO2 hard coatings derived from a single precursor source of tetra-n-butyl titanate modified perhydropolysilazane
Zongbo Zhang *a,
Dan Wangab,
Fengyan Xiaoa,
Qianying Liangab,
Yongming Luo*a and
Caihong Xu*ab
aResearch/Education Centre for Excellence in Molecular Sciences, Institute of Chemistry, Chinese Academy of Sciences, Beijing 100190, China. E-mail: zongbo@iccas.ac.cn; luoym@iccas.ac.cn; caihong@iccas.ac.cn
bSchool of Chemistry and Chemical Engineering, University of Chinese Academy of Sciences, 100049, China
First published on 8th May 2018
Abstract
SiO2/TiO2 composite coatings are of great interest due to their optical, photocatalytic, electrical and mechanical properties. There are many methods for preparing SiO2/TiO2 composite coatings. Among these, the sol–gel process is eco-friendly and easily implementable for industrial applications. However, it is still a great challenge to prepare dense, uniform and smooth SiO2/TiO2 composite coatings with a sol–gel process. In this work, we show a modified sol–gel process for achieving dense, uniform and smooth SiO2/TiO2 coatings with tetra-n-butyl titanate modified perhydropolysilazane (PHPS) as a single precursor source, in which PHPS acts as the source for SiO2 instead of a traditional alkoxylsilane compound. The micro-morphology and composition evolution during the preparation process have been investigated; a smooth surface with a roughness average (Sa) below 4.5 nm and a uniform distribution of Ti elements over the entire coating are shown. These dense, uniform SiO2/TiO2 coatings exhibit excellent mechanical robustness, with hardness values as high as 9.45 GPa, excellent optical transparency and hydrophilic properties.
1. Introduction
SiO2/TiO2 coatings and their multilayer packing have being widely investigated and applied in the fields of optical waveguiding, antireflection coatings, thermal protection systems, self-cleaning coatings, and semiconductor devices, due to their excellent optical, photocatalytic, superhydrophilic, electrical, and mechanical properties.1–8 Therefore, various methods have been developed to prepare SiO2/TiO2 coatings, such as electron-beam evaporation, chemical vapor deposition (CVD), and the sol–gel process. Among these, the sol–gel method is simple and inexpensive, which makes it especially suitable for the preparation of coatings on components with complex surfaces or large dimensions. Thus, there are numerous reports on the preparation of SiO2/TiO2 coatings using the sol–gel method.Generally, alkoxylsilane and tetra-alkyl orthotitanate are the main raw materials for the sol–gel route, which involves hydrolysis, condensation, and sintering processes. Due to the faster hydrolysis rate of Ti precursors, the co-hydrolysis of alkoxylsilane and tetra-alkyl orthotitanate usually leads to an inhomogeneous dispersion of SiO2 and TiO2 sols, which results in aggregates, cavities, and rough surfaces in the formed SiO2/TiO2 coating.9,10 Actually, the inhomogeneous status will seriously affect the optical properties and mechanical robustness of the achieved coatings.4 Thus, some efforts have been made to solve this problem, such as carrying out pre-hydrolysis of the Si precursor,11 adopting organic stabilizers to control the hydrolysis,9,12 altering the alkoxyl groups in the Ti and Si precursors,10,13 and using a non-hydrolytic sol–gel process.14 Unfortunately, these methods still produce SiO2/TiO2 coatings with high roughness. Recently, HS Chen reported that the co-hydrolysis-condensation of acac-stabilized Ti and an activated Si precursor achieved a homogeneous SiO2/TiO2 coating with a uniform dispersion of Ti atoms in all directions of the coating.10 Apparently, complicated steps must be undertaken in advance to ensure efficient preparation. Therefore, it is still challenging to prepare uniform SiO2/TiO2 coatings using a more convenient method.
Recently, perhydropolysilazane (PHPS) has drawn more and more attention as a precursor for dense, uniform and scratch-resistant SiO2 coatings. By exposing as-deposited PHPS coatings to high temperatures, moistening atmospheres, aqueous ammonia vapor, hydrogen peroxide solutions, or deep vacuum ultraviolet (DUV) irradiation at room temperature, SiO2 coatings can be easily prepared that exhibit good adhesion to different substrates, and excellent thermal and mechanical stability, as well as high optical quality.15–23 In addition, the Si–H and N–H groups in PHPS are highly reactive toward hydroxyl, alkoxyl, and epoxy groups, and halogen ions, which provides the possibility to modify PHPS with other reactive compounds.24,25 Based on this, novel types of silicon-based multicomponent ceramics or organic-silica nanocomposites endowed with new properties have been developed.26–33 Moreover, the Si–N bonds in PHPS are easily hydrolysed to form Si–OH,18 which implies that when using PHPS as a source of SiO2 in the preparation of SiO2/TiO2 coatings, the trickiest problem existing in the traditional sol–gel route may be avoided: namely the slower hydrolysis reaction rate of alkoxylsilane as a source of SiO2 compared to the Ti precursor for TiO2. However, to our knowledge, there is still no report on the preparation of SiO2/TiO2 coatings where PHPS is adopted as the source of SiO2.
In this work, SiO2/TiO2 coatings have been successfully fabricated from a single source polymeric precursor, polytitanosilazane (PTSZ), which is synthesized via modifying PHPS with tetra n-butyl titanate (TBT) at room temperature. The obtained coating is dense and smooth, and the distribution of all elements is uniform. Besides, due to the homogeneity and densification, the coating exhibits excellent optical transparency and mechanical properties. The synthesis of PTSZ has been described and the correlation between the coating properties and the fabrication process has been investigated. This work provides a novel and easily implemented method to prepare dense, uniform TiO2/SiO2 coatings.
2. Experimental
2.1 Materials
Liquid PHPS was synthesized via the ammonolysis of dichlorosilane (H2SiCl2) according to the literature.27 TBT was purchased from Sinopharm Chemical Reagent Co., Ltd (Beijing, China) and used as received. Xylene was purchased from Beijing Chemical Factory (Beijing, China) and distilled from calcium hydride prior to use. Si (100) and Si (111) single-crystal wafers with an area of 10 mm × 10 mm were purchased from Shanghai Boshuo Sealing Technology Co., Ltd (Shanghai, China). Quartz glass with dimensions of 30 mm × 10 mm × 1 mm was purchased from Jinzhou east quartz material Co., Ltd (Liaoning, China). Prior to coating, the Si (100), Si (111) single-crystal and silica glass substrates were cleaned ultrasonically in acetone, ethanol, and distilled water in sequence, and then dried under nitrogen.2.2 Synthesis of PTSZ
TBT-modified PHPS (PTSZ) was prepared via the following procedure. A solution of PHPS in CH2Cl2 with a concentration of 50 wt% was vacuum-suction filtrated to remove the solvent. Then, liquid PHPS (1 g) and 21 mL of dry xylene were injected into a 50 mL two-necked flask under flowing nitrogen. After PHPS dissolved in the xylene to form a homogeneous solution, TBT (1 g) was added dropwise into the solution. Then the mixture was stirred under a nitrogen atmosphere at room temperature for 24 h to yield a light yellow solution of PTSZ. The obtained PTSZ solution with a 10% concentration was directly used to prepare the SiO2/TiO2 coatings.2.3 Preparation of SiO2/TiO2 coatings
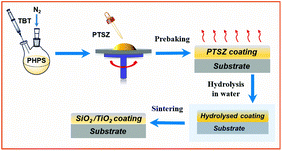
PTSZ solution was coated on the pre-treated Si single-crystal and quartz glass substrates via spin-coating at 2000 rpm. The coated substrates were prebaked in an oven at 100 °C for 1 h to remove the solvent (prebaked film) and then hydrolysed in distilled water for 4 h (hydrolysed film). Finally, the hydrolysed samples were annealed at different temperatures in the range of 100 to 900 °C for 1 h under flowing air (Fig. 1).2.4 Characterization
1H-NMR spectra were recorded in CDCl3 solution using a Bruker AVANCE 400 spectrometer. Fourier transform infrared (FT-IR) spectra of the coatings deposited on Si (100) substrates were recorded using a Bruker Tensor-27 FT-IR spectrometer over the wavenumber range of 400–4000 cm−1, using bare Si (100) as a reference. X-ray photoelectron spectroscopy (XPS) data was obtained using an ESCALab220i-XL electron spectrometer from VG Scientific (East Grinstead, UK) using 300 W Al-Kα radiation. X-ray diffraction (XRD) measurements were carried out using a Rigaku D/M4X 2500 diffractometer with Cu-Kα radiation. The surface morphologies and titanium element mapping distributions of the coatings were studied using a Hitachi S-4800 scanning electron microscope (SEM) equipped with an energy dispersive spectroscopy (EDS) system. The surface roughness data for the coatings was obtained using a SOHIO white-light interfering profilometer. The transmittance spectra of the coatings on quartz glass substrates were recorded using a Hitachi U-3210 UV-VIS spectrophotometer over the wavelength range of 300–800 nm. The refractive indices and thicknesses of the coatings deposited on Si (111) substrates were measured using a Sentech-SE800 ellipsometer. The surface hardness and elastic modulus values of the coatings were measured using an MTS XP nano-indenter with a Berkovich diamond indenter. The reported data are average values of five measurements performed on different areas of the samples, with a contact depth ranging from 50 to 100 nm. Considering the fact that the surface hardness and elastic modulus of a coating are easily affected by the substrate, the displacement depth is less than 20% of the thickness of the coating. Coatings with a final thickness of over 1.2 μm, which were prepared by repeating the process of spin-coating and annealing eight times, were used for measurements. The hydrophilic properties of the coatings were evaluated by examining the water contact angle using a DSA100 contact angle meter with a droplet volume of 2 μL.3. Results and discussion
3.1 Chemical structure of PTSZ
FT-IR spectra of PHPS and PTSZ are shown in Fig. 2. For PHPS, the absorption at 2160 cm−1 can be assigned to Si–H vibrations, and the absorption bands at 3400 cm−1 and 1180 cm−1 indicate the presence of N–H groups.24,25,34,35 Meanwhile, the strong broad bands at 820–1020 cm−1 are assigned to Si–N–Si vibrations. In the FT-IR spectra of PTSZ, the intensities of the N–H and Si–H absorption peaks obviously decrease, and stretching vibrations of CH3 and CH2 groups at 2960 cm−1 and 2910 cm−1, deformation vibrations of CH3 groups at 1400 cm−1, and absorption by a Si–O group at 1066 cm−1 have been observed. Si–O–Ti or Si–N–Ti bonds form via reactions between PHPS and TBT, as shown in eqn (1)–(4)36,37 in Fig. 2(c). However, both the absorptions of Si–N–Ti at 1030 cm−1 and Si–O–Ti at 935 cm−1, formed during reactions between PHPS and TBT, are overlapped by the strong Si–N–Si absorption band at 820–1020 cm−1. Thus, it is difficult to separate bands attributed to Si–N–Ti and Si–O–Ti bonds from that of the Si–N–Si bond.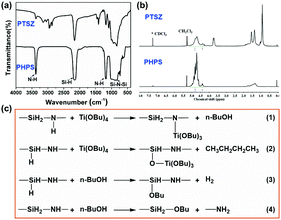 | ||
| Fig. 2 The chemical structures of PHPS and PTSZ: (a) FT-IR spectra; and (b) 1H-NMR spectra. (c) Possible reactions between PHPS and TBT. | ||
In the 1H-NMR spectra of PHPS (Fig. 2(b)), the peak at 4.80 ppm is attributed to SiH/SiH2 groups, while the peak at 4.34 ppm is assigned to SiH3 groups, and the broad peak at 1.8–1.2 ppm belongs to NH groups.36 The peak at 5.51 ppm corresponds to residual CH2Cl2 in PHPS. Compared to the spectrum of PHPS, the 1H-NMR spectrum of PTSZ exhibits new peaks at 4.28 ppm and 3.7 ppm, which are assigned to CH2O groups. Meanwhile, CH2 and CH3 peaks in PTSZ have also been observed, although these are overlapped by the peaks from NH groups between 2.0 and 0.5 ppm. All these data from FT-IR and NMR studies imply that reactions happened between PHPS and TBT, which also indicates that a single polymeric precursor containing Si–N and Si–O–Ti structures has been obtained.
3.2 Chemical composition of PTSZ based coatings
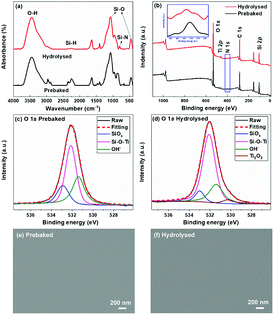
The chemical structure evolution of PTSZ based coatings was studied after the hydrolysis and pyrolysis processes, respectively. As shown in Fig. 3(a), for the hydrolysed coating, the intensities of the absorptions at 2160 cm−1, attributed to the Si–H bond, and 820–1020 cm−1, assigned to Si–N–Si bonds, show an obvious reduction compared with those of the prebaked PTSZ coating, while the bands assigned to a Si–O–Si asymmetric stretching vibration at 1066 cm−1 and a Si–O–Si rocking vibration at 440 cm−1 become broader, which can be attributed to hydrolysis reactions of Si–N and Si–H groups in PTSZ, as well as subsequent condensation and cross-linking reactions during the treatment of PTSZ in distilled water. XPS surveys show that the surface of the hydrolysed coating contains unnoticeable N elements. For the prebaked coating, the O 1s XPS spectrum has been deconvoluted to three components, which are assigned to Si–O bonds of SiOx, centred at 532.9 eV, Si–O–Ti bonds, centred at 532.1 eV, and OH−, for the peak at 531.4 eV, respectively (Fig. 3(c)).38–40 For the hydrolysed coating, it can be seen that the relative peak area of Si–O–Ti increases from 49.9% to 66.7%, and the Ti–O bonds in Ti2O3 appear in the peak centred at 530.8 eV. These data suggest that the hydrolysis process has promoted the conversion of PTSZ and formed a relative dense coating, as shown in Fig. 3(e) and (f). It should be mentioned that a reduction in thickness from 352 nm for the prebaked film to 345 nm for the hydrolysed film has been detected, which may also imply that a densification process occurred after the hydrolysis process, by soaking the film in water.After treatment at 400 °C for 1 h under flowing air, the Si–N–Si group bands disappear, while the absorption by the Si–H groups at 2160 cm−1 completely disappears, as shown in Fig. 4(a). With an increase in pyrolytic temperature from 400 to 900 °C, the intensities of the Si–O–Si (1066 and 440 cm−1) absorption bands in the PTSZ based coatings gradually increased, while the intensity of Si–O–Ti absorption band at 935 cm−1 decreased with increasing temperature, which implies that the pyrolysis process accelerates the conversion of the Si–O–Ti phase to SiO2 and TiO2 phases above 400 °C.
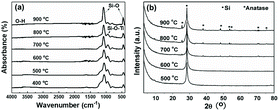 | ||
| Fig. 4 PTSZ based coatings pyrolysed at different temperatures: (a) FT-IR spectra and (b) XRD patterns. | ||
XRD diffraction patterns of the PTSZ based coatings on Si (111) treated at different pyrolytic temperatures (500–900 °C) under an air atmosphere are shown in Fig. 4(b). There is only one diffraction peak at 28°, deriving from the Si (111) substrate, found in coatings obtained below 700 °C, which indicates the coatings are fully amorphous. After annealing at 700 °C, diffraction peaks at 25.48, 37.98, 48.24, 54.14, 55.28, 70.66, and 75.52°, assigned to the anatase phase of TiO2, are observed.41 Moreover, the intensities of the diffraction peaks belonging to the anatase phase are enhanced with a rise in pyrolytic temperature, which demonstrates that the crystallization degree of the ceramic coatings has been increased. It should be noted that the diffraction intensities from the anatase phase of TiO2 are depressed due to the strong diffraction peak from the Si (111) substrate, which results in the weak TiO2 peaks shown in Fig. 4(b).42
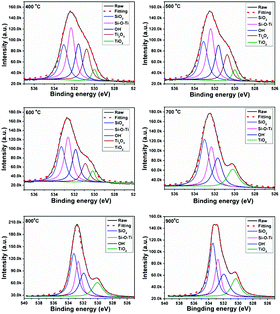
The compositions of the PTSZ based coatings obtained at different temperatures were further analysed via XPS. XPS spectra of the O 1s region are shown in Fig. 5, and the O 1s peak for PTSZ based coatings has been deconvoluted to five components, which are assigned to: Ti–O bonds in Ti2O3 for the peak centred at 530.8 eV; Ti–O bonds in TiO2 for the peak centred at 531.0 eV; OH− for the peak at 531.7 eV; Si–O–Ti for the peak centred at 532.3 eV; and Si–O bonds for the peak centred at 533.2 eV.2,40,43,44 As shown in Fig. 5, the peak from Ti–O bonds in Ti2O3 disappears when the PTSZ based coatings are pyrolysed above 600 °C. The chemical compositions of the coatings, calculated from the deconvoluted O1s spectra, are summarized in Table 1. It can be found that with a rise in pyrolytic temperature, the Si–O–Ti and Ti2O3 content decreases, while that of SiO2 and TiO2 increases. This is mainly attributed to the cleavage of the Si–O–Ti bonds, which then transform into SiO2 and TiO2 phases during the ceramization process. Meanwhile, the Ti2O3 phase tends to form a TiO2 phase at high temperatures.43 These data from XPS are consistent with the results from the FT-IR spectra of PTSZ based coatings. The existence of OH− in the SiO2/TiO2 composite coatings is attributed to H2O chemically and physically adsorbed by SiO2 and TiO2. The content of adsorbed H2O increased with an increase in the SiO2 and TiO2 content in the coatings, and hence resulted in a higher OH− content for coatings obtained at higher temperatures.40
| Sample | SiO2 | Si–O–Ti | OH− | Ti2O3 | TiO2 | |
|---|---|---|---|---|---|---|
| a The ratio Ai/ΣAi (Ai is the area of each deconvoluted peak). | ||||||
| 400 °C | Eb (eV) | 533.0 | 532.3 | 531.6 | 530.7 | 530.0 |
| ri (%)a | 23.02 | 31.55 | 20.76 | 19.40 | 5.27 | |
| 500 °C | Eb (eV) | 533.1 | 532.4 | 531.6 | 530.8 | 530.0 |
| ri (%) | 25.90 | 31.43 | 20.97 | 16.32 | 5.39 | |
| 600 °C | Eb (eV) | 533.25 | 532.62 | 531.87 | 530.9 | 530.14 |
| ri (%) | 27.03 | 31.26 | 22.34 | 13.24 | 6.13 | |
| 700 °C | Eb (eV) | 533 | 532.33 | 531.70 | 530.14 | |
| ri (%) | 35.32 | 24.69 | 22.80 | 14.81 | ||
| 800 °C | Eb (eV) | 533.25 | 532.64 | 531.90 | 530.12 | |
| ri (%) | 36.52 | 23.23 | 23.05 | 17.20 | ||
| 900 °C | Eb (eV) | 533.43 | 532.74 | 531.92 | 530.32 | |
| ri (%) | 36.92 | 22.03 | 23.54 | 17.51 | ||
3.3 Surface morphologies of PTSZ based coatings
Surface morphologies and EDS maps of PTSZ based coatings on Si (111) treated at different temperatures are presented in Fig. 6. It can be seen that all samples show a uniform, smooth and dense surface without cracks, and the distribution of the element Ti in the coatings is homogeneous. No obvious Ti element enrichment has been observed. Two- and three-dimensional images of PTSZ based coatings annealed at different temperatures are displayed in Fig. 7. It can be clearly seen that all the obtained coatings exhibit smooth morphologies. The surface roughness of the coatings treated at different temperatures is in the scale of several nanometers, which increases with a rise in the annealing temperature. As revealed via XRD and XPS, crystalline TiO2 was observed above 600 °C, thus destroying the uniformity of the coating. Nevertheless, the roughness is still below 4.5 nm, which is ultra-low and not usually found in previous works involving the traditional sol–gel method. Hence, SiO2/TiO2 coatings prepared via this method are very dense, smooth and homogeneous.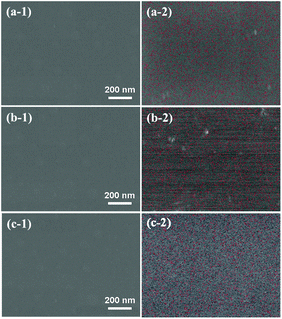 | ||
| Fig. 6 Surface morphologies and EDS maps of PTSZ based coatings treated at: (a) 400 °C; (b) 700 °C; and (c) 900 °C. | ||
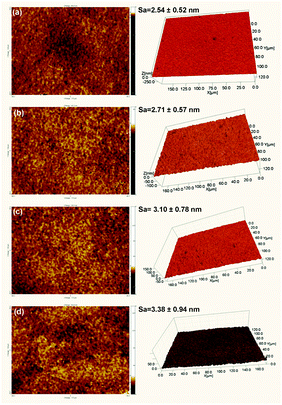 | ||
| Fig. 7 Two- and three-dimensional images of PTSZ based coatings treated at: (a) 400 °C; (b) 600 °C; (c) 700 °C; and (d) 900 °C. | ||
3.4 Optical, mechanical and hydrophilic properties of PTSZ based coatings
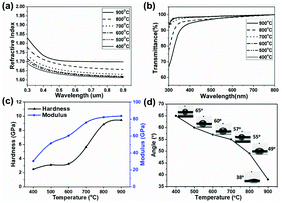
The refractive indices of the composite coatings prepared at different temperatures (400–900 °C) with respect to wavelength are shown in Fig. 8(a). The refractive index decreases as the wavelength increases from 300 to 900 nm, which is coincident with the phenomenon of dispersion for transparent materials in the visible range. The thicknesses and refractive indices at 630 nm of the coatings, obtained from ellipsometry, are summarized in Table 2. The coating treated at 400 °C has a refractive index of about 1.62, while that of the coating treated at 900 °C is 1.70. The enhancement of the refractive index with increasing temperature is due to the formation of a denser structure for the composite coatings at high temperatures. In addition, with the increase in pyrolytic temperature, more TiO2 formed from the cleavage of Si–O–Ti and transformation from Ti2O3, as discussed in relation to the XPS measurements. The thicknesses of the coatings slightly decrease with an increase in the pyrolytic temperature, due to improved densification at higher temperatures.10| Sample | Thickness (nm) | Refractive index |
|---|---|---|
| 400 °C | 142 | 1.62 |
| 500 °C | 131 | 1.63 |
| 600 °C | 124 | 1.63 |
| 700 °C | 118 | 1.64 |
| 800 °C | 106 | 1.67 |
| 900 °C | 100 | 1.70 |
Fig. 8(b) shows transmittance spectra of the coatings deposited on quartz glass substrates in the wavelength range of 300–800 nm. It can be seen that the transmittance of the coatings prepared at various temperatures is above 90% in the visible region, indicating that the coatings derived from PTSZ are highly transparent. In addition, for the coatings treated below 700 °C, the transmittance is almost independent of the pyrolytic temperature, owing to the amorphous matrix with a rather homogeneous structure, while the composite coatings treated over 700 °C show a slight decline in transmittance with increasing temperature. An increase in annealing temperature leads to a rougher coating structure, which probably results in an increase in light scattering intensity, hence causing a decrease in transparency.
Fig. 8(c) displays the surface hardness and elastic modulus values of the composite coatings as a function of the pyrolytic temperature. With an increase in temperature, an obvious enhancement in the surface hardness and elastic modulus values of the coatings is observed. The surface hardness and elastic modulus of coatings treated at 400 °C are 2.49 GPa and 30.42 GPa, while the hardness and elastic modulus of coatings treated at 900 °C increase up to 9.45 GPa and 83.66 GPa. These are at the same level as SiO2–TiO2 multilayers prepared via a reactive radio frequency (RF) magnetron sputtering method, a vapor deposition method producing mechanically robust film. For example, the hardness and modulus of a SiO2–TiO2 multilayer coating reported by M. Mazur et al. are 8.3 GPa and 73.0 GPa, which are considered higher than glass,45 while the hardness and modulus of a SiO2–TiO2 coating reported by I. Pana et al. are 7.18 GPa and 88.31 GPa, respectively.46 These results demonstrate that the SiO2/TiO2 film is dense and mechanically robust. The enhancement in the hardness and elastic modulus with an increase in pyrolytic temperature is correlated with the denser structure of the coating obtained at higher temperatures.
The hydrophilic properties of the coatings were evaluated by examining their water contact angles (Fig. 8(d)). It can be seen that the water contact angles of the coatings obviously decrease with an increase in pyrolytic temperature, and that of the sample annealed at 900 °C is only 38°. The reduction in the contact angle with an increase in treatment temperature can be explained as follows: on the one hand, the higher roughness of the coatings obtained at higher temperatures leads to an enhancement in the contact area between H2O and the surfaces of the coatings; on the other hand, according to the XPS analysis, the OH− content is enhanced with an increase in pyrolytic temperature. A higher OH− content causes an enhancement of van der Waals forces and hydrogen bonding interactions between H2O and OH−.40
4. Conclusions
Dense, smooth SiO2/TiO2 coatings with a uniform distribution of Ti element have been successfully prepared with a modified sol–gel method via the hydrolysis and subsequent pyrolysis of a single precursor source of TBT-modified PHPS under air flow. The pyrolytic temperature has a significant effect on the compositions and microstructures of the ceramic coatings, and thereby greatly affects their optical, mechanical, and hydrophilic properties. A high Si–O–Ti bond content has been achieved with this single precursor source for SiO2 and TiO2, which thus ensures homogeneity in the final coating. A dense amorphous silica matrix from PHPS plays an important role in dispersing the Ti moieties and gives the obtained coatings a smooth surface. Therefore, the coatings prepared at various temperatures have a high transparency of over 90% in the visible region, and a refractive index in the range of 1.62 to 1.70 at a wavelength of 630 nm. With an increase in the pyrolytic temperature from 400 to 900 °C, the surface hardness of the coatings drastically increased from 2.49 to 9.45 GPa, and the elastic modulus of the coatings increased from 30.42 to 83.66 GPa. In summary, this work has demonstrated an effective strategy to prepare dense, smooth, homogeneous SiO2/TiO2 coatings, which have high potential for industrial applications.Conflicts of interest
There are no conflicts to declare.Acknowledgements
The authors are grateful for the support of the Young Elite Scientist Sponsorship Program by CAST.References
- E. R. Klobukowski, W. E. Tenhaeff, J. W. McCamy, C. S. Harris and C. K. Narula, J. Mater. Chem. C, 2013, 1, 6188–6190 RSC.
- M. J. Powell, R. Quesada Cabrera, A. Taylor, D. Teixeira, I. Papakonstantinou, R. G. Palgrave, G. Sankar and I. P. Parkin, Chem. Mater., 2016, 28, 1369–1376 CrossRef CAS.
- M. Vishwas, K. N. Rao, K. V. A. Gowda and R. P. S. Chakradhar, Spectrochim. Acta, Part A, 2011, 83, 614–617 CrossRef CAS PubMed.
- S. Islam, N. Bidin, S. Riaz, S. Naseem and F. M. Marsin, Sens. Actuators, B, 2016, 225, 66–73 CrossRef CAS.
- R. Fateh, R. Dillert and D. Bahnemann, Langmuir, 2013, 29, 3730–3739 CrossRef CAS PubMed.
- S. Guldin, P. Kohn, M. Stefik, J. Song, G. Divitini, F. Ecarla, C. Ducati, U. Wiesner and U. Steiner, Nano Lett., 2013, 13, 5329–5335 CrossRef CAS PubMed.
- S. W. Kim, K. Nguyen Tri, T. Doan Van, E. J. Kim and S. H. Hahn, RSC Adv., 2015, 5, 94332–94337 RSC.
- X. Yang, J. Ma, J. Ling, N. Li, D. Wang, F. Yue and S. Xu, Appl. Surf. Sci., 2018, 435, 609–616 CrossRef CAS.
- Y. F. G. Biglu and E. Taheri Nassaj, Ceram. Int., 2013, 39, 2511–2518 CrossRef.
- H. S. Chen, S. H. Huang and T. P. Perng, ACS Appl. Mater. Interfaces, 2012, 4, 5188–5195 CAS.
- B. E. Yoldas, J. Non-Cryst. Solids, 1980, 38–39, 81–86 CrossRef CAS.
- M. W. Jung, Int. J. Inorg. Mater., 2001, 3, 471–478 CrossRef CAS.
- M. Yamane, S. Inoue and K. Nakazawa, J. Non-Cryst. Solids, 1982, 48, 153–159 CrossRef CAS.
- M. Andrianainarivelo, R. Corriu, D. Leclercq, P. H. Mutin and A. Vioux, J. Mater. Chem., 1996, 6, 1665–1671 RSC.
- D. Hishitani, M. Horita, Y. Ishikawa, H. Ikenoue and Y. Uraoka, Jpn. J. Appl. Phys., 2017, 56, 056503 CrossRef.
- H. J. Seul, H. G. Kim, M. Y. Park and J. K. Jeong, J. Mater. Chem. C, 2016, 4, 10486–10493 RSC.
- L. Blankenburg and M. Schrödner, Surf. Coat. Technol., 2015, 275, 193–206 CrossRef CAS.
- Z. B. Zhang, Z. H. Shao, Y. M. Luo, P. Y. An, M. Y. Zhang and C. H. Xu, Polym. Int., 2015, 64, 971–978 CrossRef CAS.
- Y. Jeong, C. Pearson, H. G. Kim, M. Y. Park, H. Kim, L. M. Do and M. C. Petty, RSC Adv., 2015, 5, 36083–36087 RSC.
- L. Prager, U. Helmstedt, H. Herrnberger, O. Kahle, F. Kita, M. Münch, A. Pender, A. Prager, J. W. Gerlach and M. Stasiak, Thin Solid Films, 2014, 570, 87–95 CrossRef CAS.
- T. Kubo, E. Tadaoka and H. Kozuka, J. Mater. Res., 2004, 19, 635–642 CrossRef CAS.
- T. Kubo, E. Tadaoka and H. Kozuka, J. Sol-Gel Sci. Technol., 2004, 31, 257–261 CrossRef CAS.
- H. Kozuka, K. Nakajima and H. Uchiyama, ACS Appl. Mater. Interfaces, 2013, 5, 8329–8336 CAS.
- Y. Iwamoto, K. Kikuta and S. Hirano, J. Ceram. Soc. Jpn., 2000, 108, 1072–1078 CrossRef CAS.
- O. Funayama, T. Kato, Y. Tashiro and T. Isoda, J. Am. Ceram. Soc., 1993, 76, 717–723 CrossRef CAS.
- M. N. M. Sokri, Y. Daiko, S. Honda and Y. Iwamoto, J. Ceram. Soc. Jpn., 2015, 123, 292–297 CrossRef CAS.
- C. Zhou, X. Gao, Y. Xu, G. Buntkowsky, Y. Ikuhara, R. Riedel and E. Ionescu, J. Eur. Ceram. Soc., 2015, 35, 2007–2015 CrossRef CAS.
- M. N. M. Sokri, T. Onishi, Y. Daiko, S. Honda and Y. Iwamoto, Microporous Mesoporous Mater., 2015, 215, 183–190 CrossRef.
- J. Y. Lee and R. Saito, Polymer, 2018, 135, 251–260 CrossRef CAS.
- J. Y. Lee and R. Saito, J. Appl. Polym. Sci., 2016, 133, 44238–44244 Search PubMed.
- A. Yamano and H. Kozuka, J. Phys. Chem. B, 2009, 113, 5769–5776 CrossRef CAS PubMed.
- A. Yamano and H. Kozuka, Thin Solid Films, 2011, 519, 1772–1779 CrossRef CAS.
- H. Kozuka, M. Fujita and S. Tamoto, J. Sol-Gel Sci. Technol., 2008, 48, 148–155 CrossRef CAS.
- F. Bauer, U. Decker, A. Dierdorf, H. Ernst, R. Heller, H. Liebe and R. Mehnert, Prog. Org. Coat., 2005, 53, 183–190 CrossRef CAS.
- K. Nakajima, H. Uchiyama, T. Kitano and H. Kozuka, J. Am. Ceram. Soc., 2013, 96, 2806–2816 CrossRef CAS.
- R. Toyoda, S. Kitaoka and Y. Sugahara, J. Eur. Ceram. Soc., 2008, 28, 271–277 CrossRef CAS.
- Y. Iwamoto, K. Kikuta and S. Hirano, J. Mater. Res., 1999, 14, 4294–4301 CrossRef CAS.
- S. Y. Je, B. G. Son, H. G. Kim, M. Y. Park, L. M. Do, R. Choi and J. K. Jeong, ACS Appl. Mater. Interfaces, 2014, 6, 18693–18703 CAS.
- Y. H. Kim, D. K. Lee, H. G. Cha, C. W. Kim, Y. C. Kang and Y. S. Kang, J. Phys. Chem. B, 2006, 110, 24923–24928 CrossRef CAS PubMed.
- J. G. Yu, X. J. Zhao, Q. N. Zhao and G. Wang, Mater. Chem. Phys., 2001, 68, 253–259 CrossRef CAS.
- H. Yaghoubi, N. Taghavinia and E. K. Alamdari, Surf. Coat. Technol., 2010, 204, 1562–1568 CrossRef CAS.
- B. Louis, N. Krins, M. Faustini and D. Grosso, J. Phys. Chem. C, 2011, 115, 3115–3122 CAS.
- C. Ren, W. Qiu and Y. Chen, Sep. Purif. Technol., 2013, 107, 264–272 CrossRef CAS.
- A. Matsuda, Y. Kotani, T. Kogure, M. Tatsumisago and T. Minami, J. Am. Ceram. Soc., 2000, 83, 229–231 CrossRef CAS.
- M. Mazur, D. Wojcieszak, D. Kaczmarek, J. Domaradzki, S. Song, D. Gibson, F. Placido, P. Mazur, M. Kalisz and A. Poniedzialek, Appl. Surf. Sci., 2016, 380, 165–171 CrossRef CAS.
- I. Pana, C. Vitelaru, A. Kiss, N. C. Zoita, M. Dinu and M. Braic, Mater. Des., 2017, 130, 275–284 CrossRef CAS.
| This journal is © The Royal Society of Chemistry 2018 |

