 Open Access Article
Simple, selective and fast detection of acrylamide based on glutathione S-transferase
Madalina-Petruta Bucur ,
Bogdan Bucur
 * and
Gabriel-Lucian Radu
National Institute of Research and Development for Biological Sciences, Centre of Bioanalysis, 296, Splaiul Independentei, 060031 Bucharest, Romania. E-mail: bucurica@yahoo.com; Fax: +(40)212200900; Tel: +(40)212200900
First published on 2nd July 2018
Abstract
Acrylamide (AA) is a toxic compound formed in thermally prepared foods by Maillard reaction. Besides foods, AA may be found in cosmetic products as an impurity of the widely-used non-toxic polyacrylamide. We present a novel, fast and selective detection method based on the amperometric monitoring of the coupling reaction between reduced glutathione (GSH) and AA catalyzed by glutathione S-transferase (GST) to produce an electrochemically inactive compound. We have used electrodes modified with cobalt-phthalocyanine to monitor the decrease of GHS concentration at +300 mV. Our system is simple, does not require supplementary substrates such as 1-chloro-2,4-dinitrobenzene (CDNB) nor have disadvantageous competitive kinetics characteristic to inhibition like signals. Using the optimum concentration of 100 μM GSH we have obtained a linear calibration graph from 7 to 50 μM AA and a limit of detection of 5 μM AA. The method is not affected by interfering compounds usually found in foods and was applied for real sample analysis.
1. Introduction
Acrylamide (AA) is a toxic and potential cancerogenic compound that is absorbed in the body where it forms adducts with haemoglobin, DNA or other macromolecules and is detoxified through reaction with glutathione (GSH) catalysed by glutathione-S-transferases (GST).1 AA is formed in foods by Maillard reaction between the amino group of the amino acid asparagine and carbonyl groups of glucose and fructose during frying/baking in low moisture conditions.2 The Panel on Contaminants in the Food Chain of the European Food Safety Authority (EFSA) has conducted a thorough review of AA risk in foods and found that the margins of exposure indicate a concern for neoplastic effects based on animal evidence, but the epidemiological associations have not demonstrated that AA is a human carcinogen.3 There are food products such as dry coffee substitutes, coffee, potato crisps, fried potatoes, toast bread with important variation depending on ‘darkness level’ and origin that have AA concentrations at ppm levels.3 Besides foods, AA is found in numerous other products as an impurity of the widely used, non-toxic polyacrylamide and thus the AA levels raise concerns and are regulated, e.g. AA maximum levels in cosmetics are set at 5 ppm for the Australian market.4 Plastic surgery involving polyacrylamide based implants leads to serious health issues.5 AA leaking from various polyacrylamide products raises important environmental6 and agricultural7 issues and thus the AA must be analysed in a variety of samples besides foods.There is an important interest in food industry to monitor and reduce the AA concentrations in thermally prepared products using optimized preparation techniques.8 The performances of the analytical techniques based on chromatographic or electrophoretic separations coupled with mass spectrometry detectors are remarkable,9 but these techniques require expensive equipment and complicated sample pre-treatment steps that are not suitable for small and medium food producers. There are alternative analytical techniques such as enzyme-linked immunosorbent assay (ELISA) kits that are able to detect AA after sample clean-up using solid phase extraction (SPE),10 but covalent alkylation takes place during the immunoreaction of AA with its specific antibody mainly through the cysteine and histidine from the surface of the antibody.11 Biosensors based on detection mechanisms that mimic toxicological mechanism in vitro for detection of AA have been reported: DNA12 or haemoglobin13 form adducts with AA and change their electrochemical properties. However, the formed adducts are irreversible, which limits the biosensor design to disposable devices. Amidase could also be employed for development of biosensors based on the fact that this enzyme catalyses also the hydrolysis of AA among other substrates.14
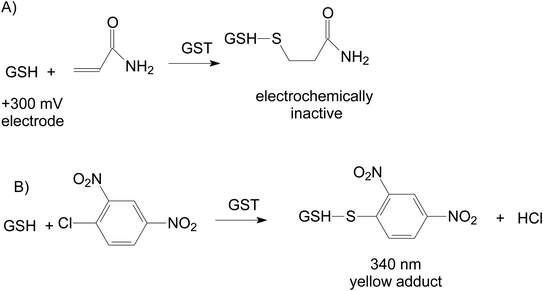
Our proposed strategy for development of bioanalytical methods for AA detection is based on the use of the natural detoxification mechanism catalysed by GST (EC number 2.5.1.18): the reaction between the GSH and xenobiotic AA15 (Fig. 1A). Biosensors based on GST were previously developed for the analysis of anticancer drugs based on the competition between cisplatin and 1-chloro-2,4-dinitrobenzene (CDNB) for the same active site of the enzyme in their parallel reactions with GSH,16 CDNB being a reagent used for spectrometric measurement of GST activity (Fig. 1B). The GST inhibition by insecticides was used for detection of malathion17 or molinate,18 compounds that should not be present in thermally prepared foods. To the best of our knowledge, this paper presents the first developed electrochemical enzymatic method for the analysis of AA from food samples based on analyte reaction with GSH catalysed by GST. We have used screen-printed electrodes modified with cobalt phthalocyanine for the amperometric quantification of GSH that reacts with AA to produce electrochemically inactive compounds. The decrease of the analytical signal depends on the concentration of AA and activity of GST.
2. Materials and methods
2.1. Reagents
Glutathione S-transferase (GST, EC number 2.5.1.18) from equine liver (25 UI/mg solid) was provided by Sigma-Aldrich (Germany), dissolved in phosphate buffer and stored at −20 °C in the freezer for long term or at +4 °C for a few days. Analytical grade cysteine, cysteamine, sodium phosphate dibasic, potassium phosphate monobasic, potassium chloride and starch, gluten, glucose, fructose, sucrose, sugar, citric acid, sodium benzoate and ammonium bicarbonate were purchased from Sigma-Aldrich. Standard stock solution of 50 mM reduced glutathione (GSH), 100 mM acrylamide (AA) and 100 mM 1-chloro-2,4-dinitrobenzene (CDNB) all from Sigma-Aldrich, Germany were prepared daily in phosphate buffer. The phosphate buffer solution 0.05 M (PBS) with pH 6.6 (optimum value according to the enzyme producer) was supplemented with KCl 0.1 M for electrochemical measurements.2.2. Apparatus
The amperometric and cyclic voltammetry measurements were performed with a galvanostat/potentiostat Autolab PGSTAT302N (Metrohm-Autolab) controlled by a PC with the software Nova 1.8. The screen-printed electrodes were produced by BAE Laboratory, Université de Perpignan Via Domitia (France) on a plastic substrate and have a round working electrode with a diameter of ∼4 mm produced using a cobalt–phthalocyanine modified paste as electrochemical mediator purchased from Gwent Electronic Materials (Gwent, UK), an auxiliary electrode made with carbon based ink and a Ag/AgCl pseudo-reference electrode both produced with pastes from Acheson (Plymouth, UK).19 The electromagnetic noise produced by magnetic stirring was reduced with the filter from the extreme low currents module (ECD) set to 1 s.2.3. AA spectrometric analysis
The AA spectrometric analysis was made at 340 nm in a quartz cuvette. The used concentrations were: 100 μM GSH, 100 μM GSH and variable concentrations of AA. The reaction was started by injection of 0.25 IU of GST and the reaction was followed for 10 min. The analytical signal is the variation of the absorbance per minute from the linear part and was correlated with the AA concentration. From the analytical signals were subtracted the blank values determined for measurements without enzyme.2.4. AA amperometric analysis
The amperometric measurements of the enzymatic activity were made at +300 mV in 5 mL PBS under magnetic stirring. The current intensity was recorded and, after current stabilization, 100 μM GSH (final concentration in the cell) was injected. The time necessary to reach the plateau was less than one minute. Various concentrations of AA from standard solutions or real samples were injected. The current intensity in the presence of GSH and AA without enzyme is the baseline signal. The reaction was started by the injection of 0.25 IU of GST. The measured current intensity decreases due to the reaction of AA with GSH in the presence of the enzyme. The analytical signal is the linear current decrease in time (nA min−1) and is correlated with AA concentration (or GSH/GST during optimization studies). From the analytical signals were subtracted the blank valued determined for measurements without enzyme.2.5. Real sample analysis
AA was determined in various food samples from a local store: bread, potato chips and homemade boiled potatoes. First, the food samples were crushed in a mortar and 5 g of food sample was mixed with 25 mL of ethanol for one hour. Then the ethanol was filtered and evaporated. The analytes were recovered in 10 mL in PBS and defatted with 2 mL of hexane to avoid electrode surface fouling. The real samples were analysed directly or spiked with known concentrations of AA (added before extraction).3. Results and discussions
3.1. Spectrometric determinations
Preliminary tests were carried out using spectrometric measurements for the detection of AA. The activity of GST is measured spectrometrically at 340 nm using CDNB that reacts with GSH to produce a coloured compound: 2,4-dinitrophenyl-S-glutathione (Fig. 1B). This system can be modified to include AA to be in competition with the chromogenic substrate CDNB for the enzymatic reaction with GSH: both reactions indicated in Fig. 1A and B take place simultaneously. The measured absorbance is reduced in the presence of AA (inhibition-like signals). For known GSH and CDNB concentrations, the variation of the measured absorbance is dependent on the AA concentration from the sample. The decrease of absorbance can be considered an inhibition and a inhibition constant can be calculated.20 This is based on the fact that the kinetics of the irreversible enzymatic reactions that have two or more substrates in competition can be mathematically described using the equations of the competitive inhibition kinetics by substituting the inhibition constants KI with the respective ratio of the KM values for each competing substrates21 as follows:
 | (1) |
The spectrometric system based on CDNB is suitable for biological investigations of the AA toxicity and metabolism,20 but is not suitable for analytical purposes to reach low limits of detection. The limitation for analytical applications is due to the kinetics of the competitive reactions that result in very little competition when the concentrations of the two substrates are far below the KM, while the competition can be significant at substrate concentrations above KM.21 The KM values for both AA and CDNB are relatively high (∼mM) and in consequence the achievable limits of detection are unsatisfactory. This kinetic limitation is not encountered in the case of spectrometric measurements with specific enzymatic inhibitors such as dieldrin and spiromesifen insecticides22 or anticancer drugs such as cisplatin and oxoplatin that are well recognized by GST and detected by the competitive mechanism.16 Our results have demonstrated that AA is not detectable at micromolar concentrations, significant signal decrease being obtained starting from 0.5 mM AA. Thus, the spectrometric measurements are not adapted for AA analysis at low concentrations. In consequence, we have used electrochemical measurements of the GSH that do not imply a competition for the substrate.
3.2. Electrochemical detection of GSH
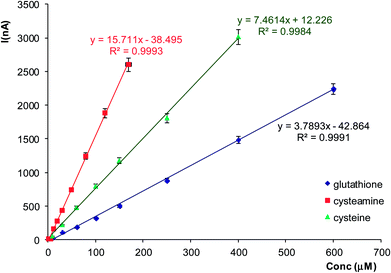
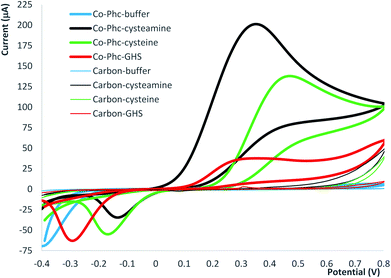
There are numerous electrodes modified with various electrochemical mediators reported for GSH detection.23 Prussian blue is a mediator suitable for food analysis24 that was reported to have a good sensitivity for the detection of GSH.25 Thorough electrochemical studies have demonstrate that Prussian blue is an effective mediator for several thiolic compounds such as cysteamine or thiocholine, but ineffective for GSH.26 We have tested screen-printed electrodes modified with Prussian blue for GSH and found that the sensitivity was insufficient for detection at low concentrations (data not shown). In consequence, we have used screen-printed electrodes modified with cobalt–phthalocyanine for amperometric detection of GSH. We have compared the amperometric signals obtained for GSH with two other low mass natural thiolic compounds (cysteamine and cysteine) in order to investigate the electrocatalytic properties of the mediator towards thiols and asses the sensitivity differences that prevent the use of Prussian blue. The initial investigations were carried out by cyclic voltammetry and the screen-printed electrodes modified with cobalt–phthalocyanine were compared with similar carbon screen-printed electrodes without mediator. For the electrodes with cobalt–phthalocyanine we have obtained a large oxidation peak for cysteamine and cysteine with maximum ∼350 mV and a wide but smaller peak for GSH with maxima starting at 300 mV (Fig. 2). In order to demonstrate the effectiveness of the cobalt–phthalocyanine mediator, we have carried out blank test using electrodes made with a carbon paste without mediator and we have obtained only a very small oxidation peak at potentials higher than 650 mV for cysteamine and cysteine (Fig. 2).We have observed that the electrodes with cobalt–phthalocyanine allow the amperometric detection at 300 mV of all three investigated thiolic compounds and the measurement sensitivity decreases in the following order: cysteamine, cysteine and GSH (see equations of the calibration graphs in Fig. 3). The calibration graph for GSH was linear from 5 to 900 μM with a measurement sensitivity of ∼3.8 nA μM−1 GSH and a detection limit of 1 μM calculated as 3 × signal/noise. The reproducibility of the measurements was tested by injecting 100 μM GSH and the recorded analytical signal was 316 ± 11 nA, corresponding to a relative deviation standard RSD = 3.5% (n = 9). These analytical figures of merit allow an amperometric detection of GSH with satisfactory performances in terms of concentration range and magnitude of analytical signals for development of enzymatic detection of AA based on GST and electrochemical quantification of enzymatic substrate GSH using mediated amperometric measurements.
 | ||
| Fig. 3 The calibration curves obtained with screen-printed electrodes modified with cobalt–phthalocyanine at 300 mV for cysteamine, cysteine and GSH. The experiments were carried out in triplicate. | ||
3.3. Determination of AA using GST
The main parameter to be optimized is the substrate concentration. The proposed amperometric detection of AA is based on the irreversible reaction between AA and GSH that is catalysed by GST. The enzymatic kinetic for a two-substrate reaction depends on the concentration of both substrates27 according to the eqn (2):
 | (2) |
 | (3) |
 and
and  depend on GSH concentration.
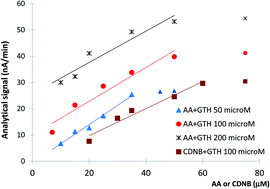
In consequence, one important factor for the analytical performances is the concentration of GSH. A higher GSH concentration implies an increase reaction rate with AA, but also higher currents and an increased base-line. Moreover, GSH is expensive and an optimization of GSH concentration has to be done by taking into consideration also this aspect. We have tested three concentrations of GSH for AA detection: 50 μM, 100 μM and 200 μM. The calibration graph and limit of detection (LOD) were determined for AA for each of the tested GSH concentrations. The analytical signals (represented by the current reduction in time measured in nA min−1) have an increased magnitude for higher GSH concentrations (Fig. 4), but this is accompanied by an increase of the baseline (proportional with GSH concentration) and noise. For 50 μM GSH we have obtained a linear calibration graph between 10 and 35 μM AA (ΔI (nA min−1) = 0.5215 × conc (μM) + 3.2144; R2 = 0.93; n = 5) with a LOD of 7 μM AA (calculated as 3 × signal/noise). In the case of 100 μM GSH we have achieved a wider calibration graph linear from 7 to 50 μM AA (ΔI (nA min−1) = 0.643 × conc (μM) + 9.9435; R2 = 0.94; n = 5) and a LOD of 5 μM AA. For the highest tested concentration of 200 μM we have obtained a calibration graph linear in the 10 to 50 μM AA range (ΔI (nA min−1) = 0.5968 × conc (μM) + 25.663; R2 = 0.92; n = 5) with a corresponding LOD of 7 μM AA. The values of the correlation coefficient R2 are higher than 0.92, were calculated for n = 5 experimental points that were linear before the plateau (Fig. 4). The differences between the LOD and linear ranges of the calibration curves are caused by a combination of factors manly due to enzymatic kinetic and amperometric detection. Based on these results, we have chosen 100 μM GSH as the optimum concentration for AA detection and used it for the rest of the paper. Similar optimization of the substrate concentration based on a compromise between the magnitude of the measured currents and the specific enzymatic kinetic conditions was previously reported for β-carbolines analysis using inhibition of monoaminoxidases,28 while in case of irreversible inhibition a high substrate concentration is used for maximum analytical signals.29 The reproducibility of the enzymatic measurements of AA using the optimum concentration of 100 μM GSH was tested for 25 μM AA and the variation of the current was 28.6 ± 2.1 nA min−1, corresponding to a relative deviation standard RSD = 7.3% (n = 7). The calibration graphs reported in literature for other biological analytical methods ranges from 0.4–200 μM AA obtained by investigation of DNA–AA interactions,12 0.04–10 μM AA for electrodes based on haemoglobin13 to 0.14–14 μM AA for an immunological assay.10
We have carried out a comparison of AA detection with CDNB as a well-known substrate for spectrometric measurement of GST activity. Using the optimum concentration of 100 μM GSH we have obtained a calibration graph linear from 20 to 60 μM CDNB (ΔI (nA min−1) = 0.5148 × conc (μM) + 0.5574; R2 = 0.96) and a LOD of 18 μM CDNB (calculated as noise/3 × signal). These results demonstrate the validity of our proposed detection mechanism based on amperometric quantification of GSH, the system being able to quantify the usually used spectrometric substrate and confirming the possibility to detect any GST substrate. The amperometric detection has the advantage of being useful for analysis of coloured solutions were CDNB is not applicable.
3.4. Interference study and real samples analysis
Interferences can affect the amperometric detection or interact with the enzyme. Several potentially interfering substances were investigated based on their possible presence in foods: starch, gluten, glucose, fructose, sucrose, sugar, citric acid, sodium benzoate and ammonium bicarbonate. The initial study was carried out without GST to measure the electrochemical interferences. After the baseline stabilization, the interfering substances were injected at a 10 mM final concentration in the cell and no significant current variation was registered. Subsequently, it was injected 100 μM GSH and the recorded current was similar with the one obtained in the absence of the interferent. The substances that are known to interact with the enzyme (some anticancer drugs and the insecticides mentioned in the introduction) are not found in foods prepared by long thermal treatments.Real food samples were analysed using the developed amperometric method based on GST. Thermally prepared foods were tested: bread and potato chips (from a local store as potentially contaminated products) and homemade boiled potato (as a blank sample because AA is usually formed by frying or baking). The samples were analysed directly or spiked with 1.5 μg AA/g sample before the extraction steps. We did not detect AA in the real samples. The recovery percentages of the spiked AA were between 92 and 105% (see Table 1).
| Sample | AA found (μg g−1) | Recovery (%) |
|---|---|---|
| Bread | <LOD | — |
| Bread spiked with 1.5 μg AA/g | 1.42 ± 0.12 | 95 |
| Potato chips | <LOD | — |
| Potato chips spiked with 1.5 μg AA/g | 1.38 ± 0.14 | 92 |
| Boiled potato | <LOD | — |
| Boiled potato spiked with 1.5 μg AA/g | 1.57 ± 0.15 | 105 |
4. Conclusions
We have developed a simple and effective enzymatic method for AA based on GST and a direct coupling enzymatic reaction that mimic the natural detoxification mechanism. Interestingly, our system is simple and does not require the presence of both CDNB and GSH to measure inhibition like signals as other reported GSH based electrochemical biosensors for detection of molinate18 or anticancer drugs16 and therefore benefit from an optimized enzymatic kinetics as detailed above. The choice of different enzymes extracted from various sources organisms with higher catalytic activity or even genetically engineered variants17 should allow a further improvement of the analytical figures of merit. The proposed enzymatic method can be used for the screening of AA in thermally prepared food samples or cosmetics with high AA content,4 is simple, easy to use and can be implemented in medium equipment laboratory (only a potentiostat and a freezer for reagent storage is required).Conflicts of interest
There are no conflicts to declare.Acknowledgements
We are grateful to prof. Jean Louis Marty from BAE Laboratory, Université de Perpignan Via Domitia (France) for the screen-printed electrodes with cobalt–phthalocyanine mediator. Paper revision by Dr Alina Vasilescu is gratefully acknowledged. This work was financed by the program Partnership in priority areas – PN II, supported by the Romanian Department of Education and Research (MEN-UEFISCDI) projects no. PN-III-P2-2.1-PED-2016-0367 and PN-III-P2-2.1-PED-2016-0503.References
- N. Duale, T. Bjellaas, J. Alexander, G. Becher, M. Haugen, J. E. Paulsen, H. Frandsen, P. T. Olesen and G. Brunborg, Toxicol. Sci., 2009, 108, 90–99 CrossRef PubMed.
- Y. Yuan, Z. Huanjie, D. Jie, M. Yutian, C. Fang and H. Xiaosong, RSC Adv., 2014, 4, 6608 RSC.
- EFSA Panel on Contaminants in the Food Chain (CONTAM), EFSA J., 2015, 13, 4104 CrossRef.
- Cosmetic Ingredient Review Expert Panel, Int. J. Toxicol., 2005, 24(suppl. 2), 21–50 Search PubMed.
- A. Manafi, A.-H. Emami, A. H. Pooli, M. Habibi and L. Saidian, Aesthetic Plast. Surg., 2010, 34, 413–422 CrossRef PubMed.
- A. G. Guezennec, C. Michel, K. Bru, S. Touze, N. Desroche, I. Mnif and M. Motelica-Heino, Environ. Sci. Pollut. Res., 2015, 22, 6390–6406 CrossRef PubMed.
- E. Mroczek, T. Kleiber, P. Konieczny and A. Waśkiewicz, Food Addit. Contam., Part A, 2015, 1–7 Search PubMed.
- Y. Yuan, Z. Huanjie, M. Yutian and Z. Hong, RSC Adv., 2014, 4, 1004–1009 RSC.
- I. Pugajeva, J. Jaunbergs and V. Bartkevics, Food Addit. Contam., Part A, 2015, 32, 170–179 CrossRef PubMed.
- M. Franek, D. Rubio, I. Diblikova and F. Rubio, Talanta, 2014, 123, 146–150 CrossRef PubMed.
- S. Zhou, D. Wang, C. Zhang, Y. Zhao, M. Zhao and Y. Wu, J. Immunoassay Immunochem., 2015, 36, 295–311 CrossRef PubMed.
- S. Huang, S. Lu, C. Huang, J. Sheng, L. Zhang, W. Su and Q. Xiao, Sens. Actuators, B, 2016, 224, 22–30 CrossRef.
- S. Garabagiu and G. Mihailescu, J. Electroanal. Chem., 2011, 659, 196–200 CrossRef.
- S. Martins, A. Karmali and M. L. Serralheiro, Anal. Biochem., 2006, 355, 232–239 CrossRef PubMed.
- R. N. Armstrong, Chem. Res. Toxicol., 1991, 4, 131–140 Search PubMed.
- E. M. Materon, P.-J. Jimmy Huang, A. Wong, A. A. Pupim Ferreira, M. D. P. T. Sotomayor and J. Liu, Biosens. Bioelectron., 2014, 58, 232–236 CrossRef PubMed.
- P. Kapoli, I. A. Axarli, D. Platis, M. Fragoulaki, M. Paine, J. Hemingway, J. Vontas and N. E. Labrou, Biosens. Bioelectron., 2008, 24, 498–503 CrossRef PubMed.
- T. I. S. Oliveira, M. Oliveira, S. Viswanathan, M. Fátima Barroso, L. Barreiros, O. C. Nunes, J. A. Rodrigues, P. de Lima-Neto, S. E. Mazzetto, S. Morais and C. Delerue-Matos, Talanta, 2013, 106, 249–254 CrossRef PubMed.
- Z.-H. Li, H. Guedri, B. Viguier, S.-G. Sun and J.-L. Marty, Sensors, 2013, 13, 5028–5039 CrossRef PubMed.
- R. Dixit, H. Mukhtar, P. K. Seth and C. R. Krishna Murti, Biochem. Pharmacol., 1981, 30, 1739–1744 CrossRef PubMed.
- S. Schäuble, A. K. Stavrum, P. Puntervoll, S. Schuster and I. Heiland, FEBS Lett., 2013, 587, 2818–2824 CrossRef PubMed.
- E. G. Chronopoulou, A. C. Papageorgiou, A. Markoglou and N. E. Labrou, J. Mol. Catal. B: Enzym., 2012, 81, 43–51 CrossRef.
- J. C. Harfield, C. Batchelor-McAuley and R. G. Compton, Analyst, 2012, 137, 2285 RSC.
- M.-P. Bucur, M.-C. Radulescu, B. Bucur and G. L. Radu, Anal. Sci., 2016, 32, 135–140 CrossRef PubMed.
- A. Fagan-Murphy, M. C. Allen and B. A. Patel, Electrochim. Acta, 2015, 152, 249–254 CrossRef.
- F. Ricci, F. Arduini, A. Amine, D. Moscone and G. Palleschi, J. Electroanal. Chem., 2004, 563, 229–237 CrossRef.
- R. L. Stein, Kinetics of Enzyme Action, John Wiley & Sons, Inc., Hoboken, NJ, USA, 2011, pp. 141–168 Search PubMed.
- M.-C. Radulescu, M.-P. Bucur, B. Bucur and G. L. Radu, Talanta, 2015, 137, 94–99 CrossRef PubMed.
- J.-S. Do and K.-H. Lin, J. Taiwan Inst. Chem. Eng., 2016, 63, 25–32 CrossRef.
| This journal is © The Royal Society of Chemistry 2018 |


