
 Open Access Article
 This Open Access Article is licensed under a Creative Commons Attribution-Non Commercial 3.0 Unported Licence
Potentiation effect on accelerating diabetic wound healing using 2-N,6-O-sulfated chitosan-doped PLGA scaffold
Xiaohui Zhang ab,
Yang Liuab,
Shuang Zhangab,
Tong Shenab,
Jing Wang*ab and
Changsheng Liu*abc
ab,
Yang Liuab,
Shuang Zhangab,
Tong Shenab,
Jing Wang*ab and
Changsheng Liu*abc
aKey Laboratory for Ultrafine Materials of Ministry of Education, East China University of Science and Technology, Shanghai 200237, PR China. E-mail: biomatwj@163.com; liucs@ecust.edu.cn
bEngineering Research Center for Biomedical Materials of Ministry of Education, East China University of Science and Technology, Shanghai 200237, PR China
cThe State Key Laboratory of Bioreactor Engineering, East China University of Science and Technology, Shanghai 200237, PR China
First published on 23rd May 2018
Abstract
Accelerating the wound healing of diabetes-impaired cutaneous tissue is still a challenge due to the aberrant cellular behavior, poor angiogenesis, and pathological micro-environment. Activation with growth factors and modulation of the redox micro-environment of the diabetic wound are considered to be effective strategies. Herein, we have described a highly sulfated heparin-like polysaccharide 2-N, 6-O-sulfated chitosan (26SCS)-doped poly(lactic-co-glycolic acid) scaffold (S-PLGA), which can achieve controlled and sustained release of heparin-binding epidermal growth factor (HB-EGF) owing to its affinity for heparin-binding growth factors. Interestingly, the antioxidant effect of 26SCS was confirmed and it was shown to have a strong scavenging activity towards superoxide radicals, a moderate scavenging activity towards hydroxyl radicals and a lower scavenging activity towards hydrogen peroxide. It also exhibited stronger protective effects in a human keratinocyte cell line (Ha-cat) against H2O2-induced oxidative damage. The Ha-cat cells cultured in the presence of the S-PLGA scaffold were significantly protected against oxidative stress during proliferation. In a full thickness excisional wound model of a diabetic rat, the wound treated with the HB-EGF-loaded S-PLGA scaffold was basically healed after 28 days. Conversely, the wounds in the other diabetic groups were not closed. The migration effect of the keratinocytes was enhanced by the 26SCS-induced sustainable release of HB-EGF and the scavenging of ROS which led to rapid re-epithelialization. Furthermore, histopathological evaluation demonstrated the positive effects on wound contraction, epithelial regeneration, and collagen deposition when treated with the HB-EGF loaded S-PLGA scaffold. These findings highlight that 26SCS may serve as a promising coagent for both controlled release of growth factors and alleviation of excessive ROS production, thus leading to increased regeneration of the diabetic wounds.
1. Introduction
It is estimated that 285 million people worldwide are affected by diabetes, and 15% of these patients suffer from chronic ulcers. This figure is expected to rise to 439 million by 2030.1 Despite the danger posed by poor healing, very few specific therapies exist, leaving patients at risk of hospitalization, amputation, and further decline in overall health. The underlying mechanism for the formation of diabetic chronic wounds is still unclear. Diabetic chronic wounds are multi-factorial in origin. They are characterised by impaired granulocytic, chemotaxis and macrophage functions, as well as prolonged inflammation and deregulation of the neovascularization phase.2,3 There may also be nitric oxide abnormalcy, collagen accumulation, abnormal function of fibroblasts and keratinocytes, as well as accumulation of ECM ingredients and their remodeling by matrix metalloproteinases (MMPs).4–6The treatment of diabetic wounds is mainly limited to standard wound care practices, including surgical debridement, antibiotic therapy, moisture dressing, and pressure off loading, as well as close control of blood glucose levels.7 Various approaches, such as the use of growth factors, stem cells, gene therapy, proteins and natural products have been used to promote diabetic chronic wound healing. To accelerate the wound healing process, plenty of dressings are used to protect long-range healing from contamination/infection, to afford an ideal moist environment to stimulate wound healing, to offer controlled and sustained release of the bioactive substances, and to prevent their fast degeneration during the repair process.8 Unfortunately, until now, there has been no effective treatment or application method that can adequately ensure chronic wound healing.
At the wound site, reactive oxygen species (ROS), such as H2O2, are generated as by-products along with pro-inflammatory mediators, which play an important role in managing normal wound healing by accelerating hemostasis, inflammation, wound closure, and formation of the extracellular matrix (ECM).9 During diabetic wound healing, normal redox signaling is disrupted resulting in raised ROS levels in a variety of tissues, due to the overproduction of ROS by macrophages and neutrophils, and a damaged antioxidant defense ability caused by hyperglycemia.10 Excessive ROS production leads to oxidative stress, which can cause impaired dermal fibroblast and keratinocyte function.11,12 Some studies have also reported that ROS can stimulate the degradation of hypoxia-inducible factor 1 (HIF-1), which reduces the expression of HIF-1α-dependent genes such as vascular endothelium-derived growth factor, hemoxygenase-1 (HO-1), and endothelial and inducible nitric oxide synthase.13,14 The increased production of vascular superoxide (O2−) in diabetic patients may inactivate nitric oxide (NO), which is detrimental to wound repair.15 Furthermore, ROS can enhance the expression of MMPs. An increased ECM degradation rate, resulting from the high level of MMPs, can impair cell attachment, migration and cell signaling.16
Notably, modulation of the redox environment of the diabetic wound has proven to be an effective strategy. A number of mechanisms for targeted ROS-generation have been well defined. For example, the topical application of siRNA targeting in xanthine dehydrogenase (XDH) in db/db diabetic mice decreased the activity of xanthine oxidase (XO), and significantly improved the healing rate.17 Increasing the antioxidant ability has proven to be a valid strategy. The in vivo transfer of siRNA targeted against Keap1, to restore Nrf2 antioxidant function, was shown to accelerate diabetic tissue regeneration.18 Non-specific therapy for decreasing ROS has also been probed recently. Antioxidants such as vitamin C, bilirubin ointment and SkO1 help to maintain a balance by reducing ROS levels at the wound site and promoting wound healing.19–21
Chitosan (CS) or chitooligosaccharide (COS), a natural polysaccharide, can combine with superoxide free radicals, acting as a natural antioxidant, due to the abundance of free hydroxyl and amino groups.22 It was reported that CS, acting as a protective agent against H2O2/FeSO4-induced cell death in the NT2 neural cell line, could show potential for the prevention and treatment of some central nervous system (CNS) diseases.23 It was also reported that low molecular weight COS exhibits anti-antioxidant effects in β-cells by scavenging radicals in vitro and can improve insulin secretion due to high glucose levels.24 Of particular interest are some chitosan derivatives, such as sulfated chitosan (SCS), which could enhance antioxidant activity. Ronge Xing et al. reported the disparate antioxidant ability of various sulfated chitosans. When comparing chitosan and sulfated chitosan with the same molecular weight, the scavenging activity of sulfated chitosan towards superoxide and hydroxyl radicals was better than that of chitosan.25 Moreover, many sulfated polysaccharides have recently been shown to have ambiguous results in preventing oxidative stress. For example, the sulfated derivatives of Artemisia sphaerocephala polysaccharide were found to have a stronger antioxidant activity when compared to the native polysaccharide in vitro.26 The sulfated polysaccharides also exhibited better protective effects in RAW264.7 against H2O2-induced oxidative damage, when compared to the native polysaccharide.27 Most of these studies focused on the antioxidative effects of the polysacchrides. However, until now, the precise antioxidative mechanism of sulfated polysaccharides has remained unclear, especially at the cellular level.28 The antioxidant activity of 26SCS in diabetic chronic wounds has also not been reported so far.
HB-EGF is a potent stimulator of keratinocyte proliferation and migration during wound healing. Many studies have demonstrated that the application of EGF would accelerate wound healing by shortening the healing time.29 However, it must be applied in a sustained and localized way to be efficient due to its short half-life. In a previous work by our group, we showed that a 26SCS-modified carrier could achieve controlled release of HB-EGF with a steady release rate when compared with neat PLGA nanofibers and it also has a synergistic effect on the migration of keratinocytes, which leads to rapid re-epithelialization.30–33 However, the application of antioxidative 26SCS in regenerative medicine has not been reported, especially for the treatment of diabetic chronic wounds.
In view of this, we focused on developing a scaffold that would promote the collective migration of keratinocytes and the enhanced formation of granulation tissue. We hypothesize that 26SCS could promote keratinocyte survival and migration and accelerate diabetic wound healing. The effect of 26SCS, serving as a synergetic coagent, on both the controlled release of HB-EGF and the survival of normal human keratinocytes upon oxidative stress was investigated. Moreover, the survival upon oxidative stress of the keratinocytes was assessed in the case of the 26SCS-doped PLGA scaffold. Finally, a wound repair examination was implemented to verify the in vivo promotion potency of the 26SCS-doped scaffold using a full-thickness excisional wound model in STZ-diabetic rats.
2. Experimental
2.1 Fabrication of the 26SCS-doped PLGA scaffold
2.2 Characterizations of scaffolds
2.3 In vitro antioxidant activity
2.4 In vitro cell culture studies
2.5 In vivo assessment using diabetic rat models
| Group | Rat | Scaffold | HB-EGF |
|---|---|---|---|
| Non-DM blank group | Normal | — | — |
| DM blank group | Diabetic | — | — |
| DM P+0 group | Diabetic | PLGA | — |
| DM S+0 group | Diabetic | S-PLGA | — |
| DM P+4 group | Diabetic | PLGA | 4 μg |
| DM S+4 group | Diabetic | S-PLGA | 4 μg |
where Amax = area of the original wound and Ad = area of the actual wound.
![[thin space (1/6-em)]](https://www.rsc.org/images/entities/char_2009.gif) :100, Abcam) and mouse monoclonal anti-integrin b4 (1:100, Abcam), followed by goat anti-rabbit IgG Alexa Fluor 594 (1:200, Abcam) and goat anti-mouse IgG FITC secondary antibodies (1:200, Abcam), and counterstained with DAPI.
:100, Abcam) and mouse monoclonal anti-integrin b4 (1:100, Abcam), followed by goat anti-rabbit IgG Alexa Fluor 594 (1:200, Abcam) and goat anti-mouse IgG FITC secondary antibodies (1:200, Abcam), and counterstained with DAPI.3. Results
3.1 Characterization of the scaffold
The PLGA scaffold showed a well-defined fiber structure with an average fiber diameter of 686 nm (Fig. 1). After two steps of ammonification and sulfonation, the S-PLGA scaffold showed edge dissolution, and the S-PLGA scaffold showed conglutination and ruptured. The average fiber diameter of the S-PLGA scaffold was 678 nm. The tensile strength of the PLGA scaffold and the S-PLGA scaffold was 5.6 and 3.1 MPa, respectively. Typical skin tensile strength ranges from 2 to 16 MPa.40 Before and after modification, the tensile strength of the scaffolds was like normal skin. The water contact angle on the S-PLGA scaffold (46.50°) was smaller than that on the PLGA scaffold (128.99°). The hydrophilicity of the scaffold after modification was enhanced.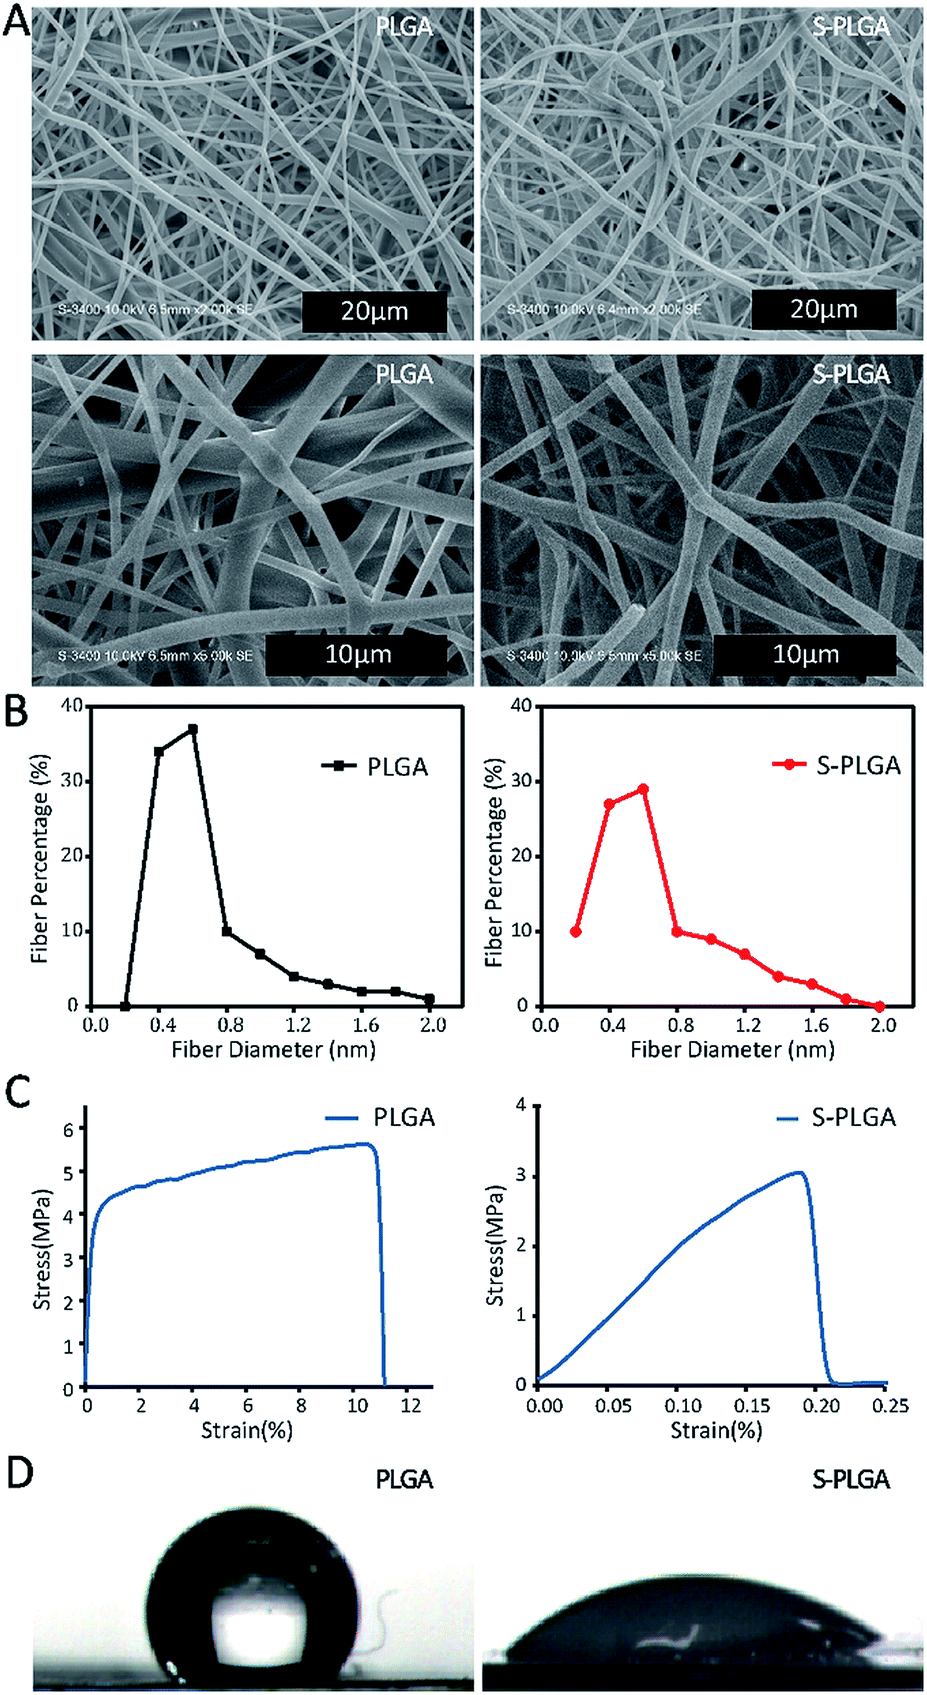 | ||
| Fig. 1 (A) SEM micrographs of the PLGA and S-PLGA scaffolds. (B) The fiber diameter of the PLGA and S-PLGA scaffold. (C) The tensile strength of the PLGA and S-PLGA scaffold. (D) The hydrophilicity of the PLGA and S-PLGA scaffold. | ||
XPS analysis revealed the successful immobilization of 26SCS (Fig. 2A). In the spectra, the N1s peak was fitted and deconvoluted to help to identify the contribution of the N element in different chemical environments. The peaks at 401.8 and 399.6 eV are assigned to –NHSO3−, protonated amines (C–NH3+/C–N+) and amides (N–C–O), respectively. The N-PLGA scaffold showed a peak at 399.6 eV, which is caused by the aminolysis of the PLGA molecular chain, which could produce the amide (N–C–O).49 After 26SCS grafting, the scaffold showed a new peak at 401.8, which was caused by the presence of –NHSO3− in 26SCS.41 The nitrogen content of the peak at 399.6 eV increased from 0.63% to 1.04%, which is caused by the interaction of –SO3− with –NH3+. Further characterization of the negative charge on the surface helped to characterize the surface modification of 26SCS directly. When compared with PLGA, the surface modified with 26SCS shows an obvious distribution of fluorescent charge (Fig. 2B). The presence of 26SCS molecules after covalent immobilization was quantitatively determined using the toluidine blue assay. The PLGA scaffold exhibited a very pale purple color due to the trace physical adsorption of toluidine blue, whereas the 26SCS-grafted PLGA scaffold showed a strong purple color (Fig. 2C). The results of the surface charge and toluidine blue staining analysis show that 26SCS was distributed evenly on the surface of the scaffold. The amount of 26SCS grafted onto the PLGA scaffold was measured as 3.66 μg cm−2 (Fig. 2D).
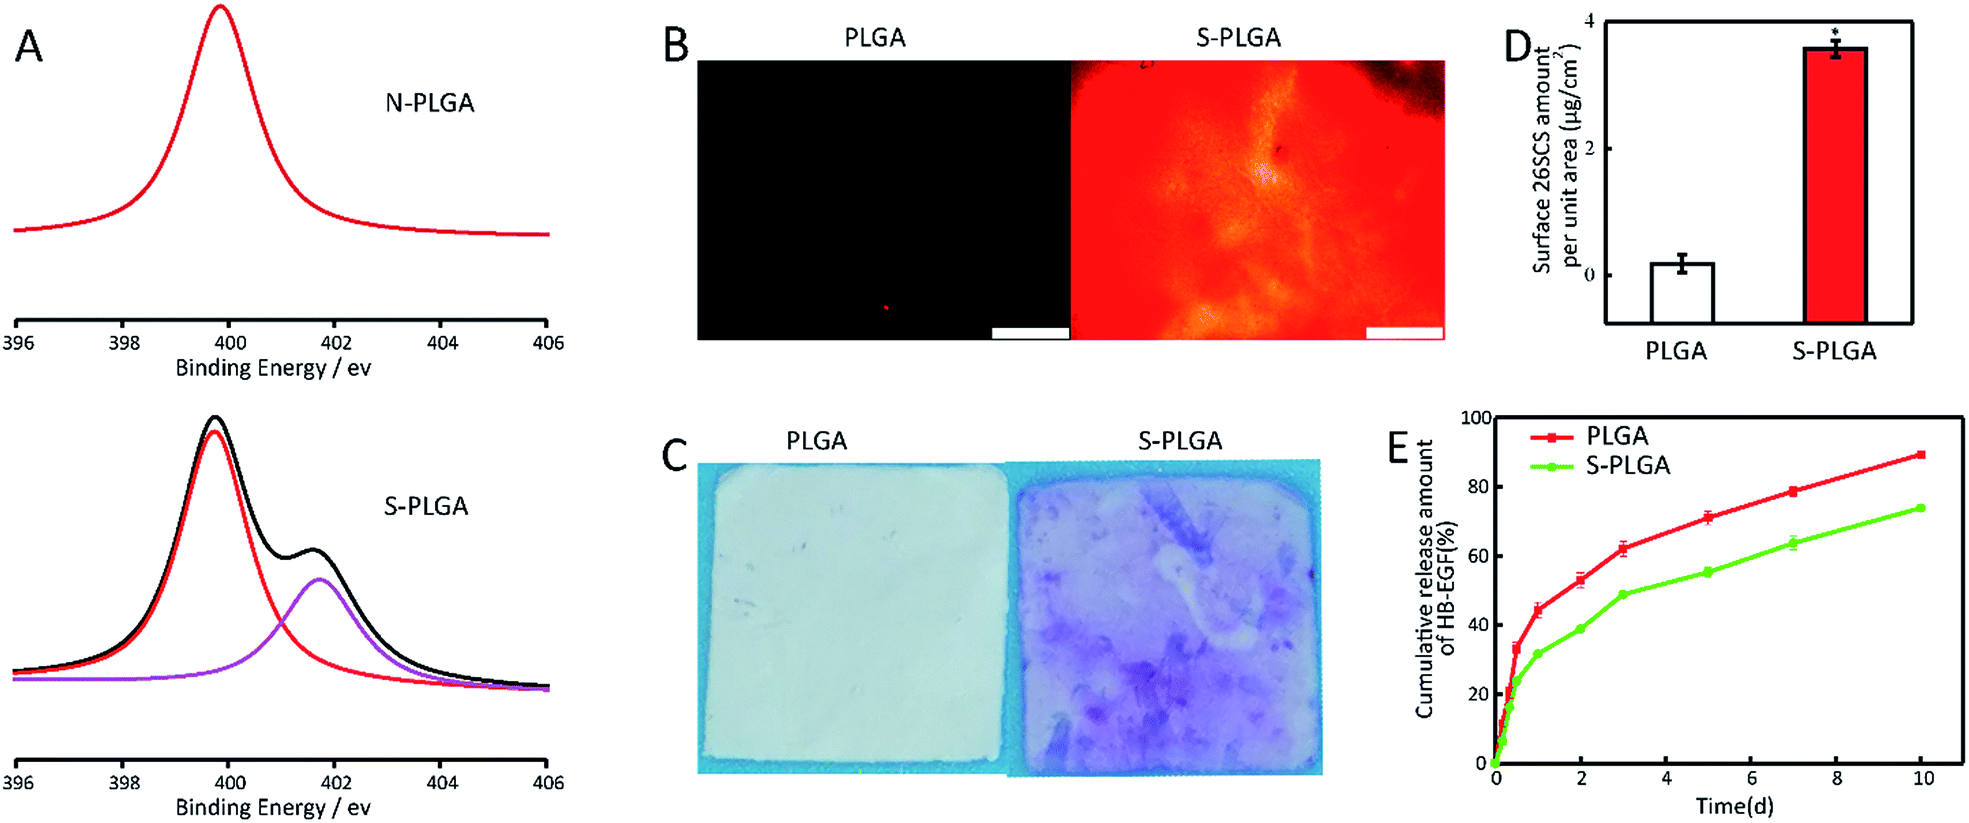 | ||
| Fig. 2 (A) XPS analysis. The N1s high resolution spectra of the PLGA and S-PLGA scaffold. (B) Characterization of the negative charge on the surface of the PLGA and S-PLGA dressing, scale bar = 500 nm. (C) Appearance of the PLGA and S-PLGA scaffold. (D) The 26SCS-grafting amount on the S-PLGA scaffold, *p < 0.05. (E) The release kinetics of HB-EGF from the PLGA and S-PLGA scaffolds. | ||
3.2 Release kinetics of HB-EGF
The release of HB-EGF was almost linear and was sustained throughout the 10 day experiment. At day 10, a cumulative release of 73.8% was observed for the S-PLGA scaffold, compared with 89.3% for the PLGA scaffold, indicating that the sustained release effect of HB-EGF is enhanced after modification (Fig. 2E).3.3 In vitro antioxidant activity
The scavenging of the superoxide radical (19.7–69.6%) at all of the concentrations (0.05–0.5 mg mL−1) of 26SCS exhibited values between those of Vc and TP and this was concentration dependent (Fig. 3A). The scavenging effect of 26SCS towards the hydroxyl radical at different concentrations (1–10 mg mL−1) was between 13.7 and 72.9%. More significant inhibition was observed at high concentrations (7–10 mg mL−1) of 26SCS when compared to Vc (Fig. 3B). However, the hydroxyl radical scavenging activity of Vc was stronger than that of 26SCS at low concentrations (1–5 mg mL−1). In the range of 0.05–1 mg mL−1, the scavenging rate of 26SCS towards H2O2 ranged from 17.7% to 22.9%. For Vc, the rate was 99.7% at 1 mg mL−1, which is higher than that of 26SCS. There were no significant changes in the range of 0.05–1 mg mL−1 (Fig. 3C). | ||
| Fig. 3 (A) The scavenging activity towards the superoxide radical, (B) the hydroxyl radical scavenging activity and (C) the H2O2 scavenging activity. | ||
3.4 Assessment of cell viability in vitro
The protective effect of 26SCS on the viability of H2O2-induced Ha-cat cells was identified using the MTT assay. As shown in Fig. 4A, the viability of the Ha-cat cells in the control group decreased significantly after cultivation with 500 μM H2O2. However, the relative viability of the Ha-cat cells pre-protected with 26SCS for 2 h was significantly increased. We then investigated the effect of the S-PLGA scaffold on Ha-cat cell survival following treatment with 100 μM H2O2. The cck8 assay showed an increased percentage of viable Ha-cat cells in the presence of the S-PLGA scaffold (Fig. 4B).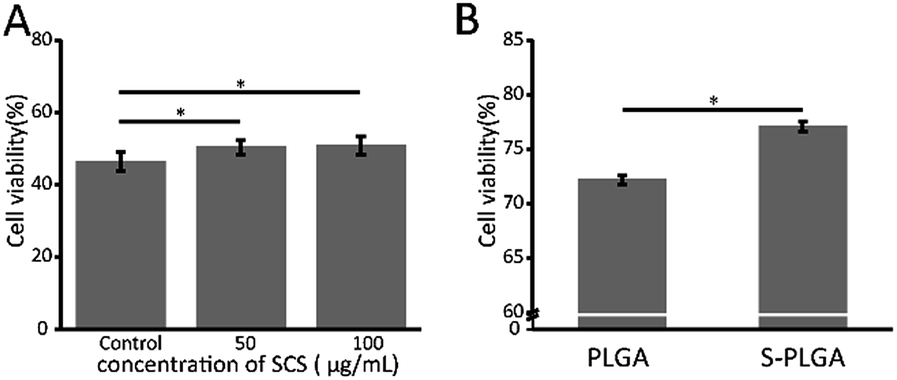 | ||
| Fig. 4 (A) H2O2 treatment regimen for the Ha-cat cells in the presence or absence of 26SCS. (B) H2O2 treatment regimen for the Ha-cat cells in the presence of the PLGA scaffold and S-PLGA scaffold, *p < 0.05. | ||
3.5 Wound closure measurement
The effect of HB-EGF loading on wound closure was determined by measuring the area around a wound over 28 days. As displayed in Fig. 5B, at day 7, the HB-EGF-loaded S-PLGA scaffold (DM S+4) group had the vast advantage of quick wound healing when compared with the other DM groups and this was maintained throughout the trial. A dramatic decrease in the wound area was observed in the case of the DM S+4 group with 71% healing occurring in 7 days. During the same time interval, the wound closure of the other DM groups was no more than 70%. At day 14, the wounds in the DM S+4 group had healed by about 90%. This still holds the advantage for speeding up wound healing when compared with the other DM groups and it is like the non-DM blank group. Furthermore, epithelialization appeared to have been nearly completed by day 28. However, the wounds were not completely closed in the other DM groups. In addition, the DM S+0 group showed significantly improved wound closure when compared with the DM blank group and the DM P+0 group.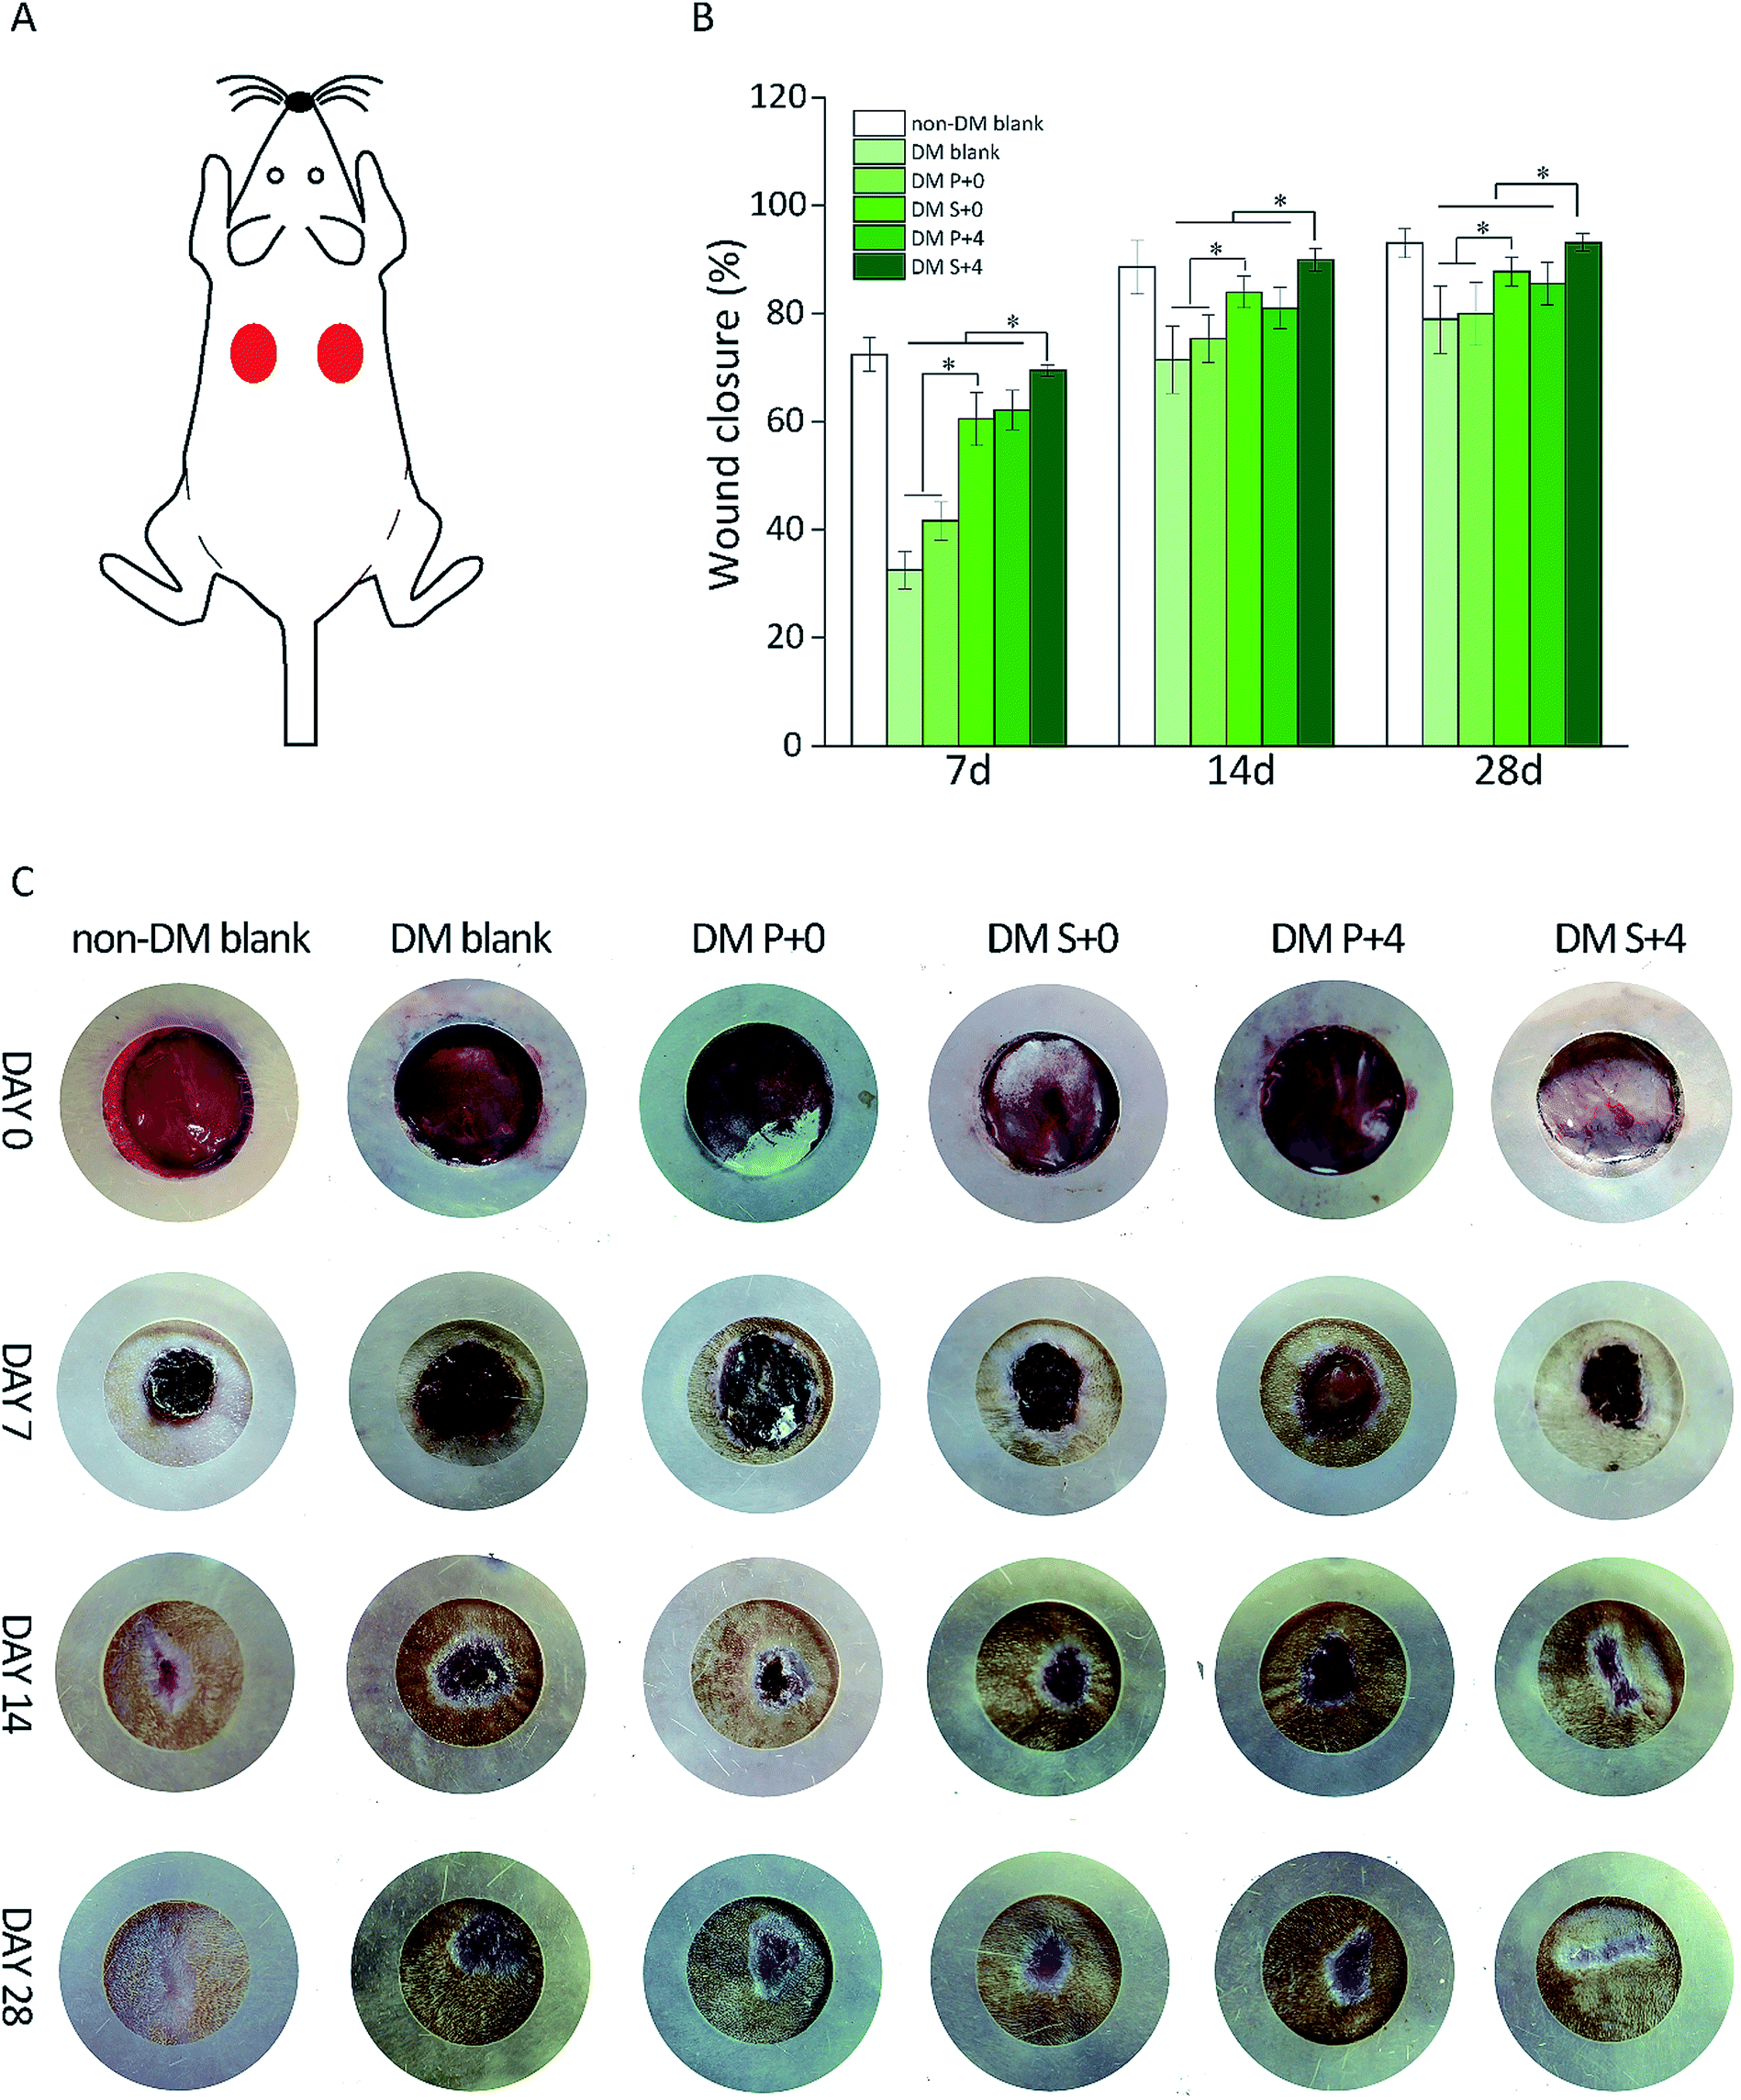 | ||
| Fig. 5 (A) The full-thickness cutaneous wound model; wounds with a diameter of 18 mm were created on the back of each rat. (B) Time-dependent changes in the wound closure determined using image analysis software, *p < 0.05. (C) Representative images of the wounds were tracked at day 7, day 14, and day 28. | ||
3.6 Oxidative stress at the wound site
In order to further confirm the protective role of the S-PLGA scaffold from the oxidative stress generated at the wound site, the levels of the ROS were determined at day 7 (Fig. 6). The levels of the ROS were significantly higher in the DM blank group and the PLGA scaffold treated (DM P+0) group when compared to the S-PLGA scaffold treated (DM S+0) group. Additionally, decreased ROS levels were found in the HB-EGF treated (DM P+4, DM S+4) group wounds when compared to the non-HB-EGF treated (DM blank, DM P+0, DM S+0) group wounds.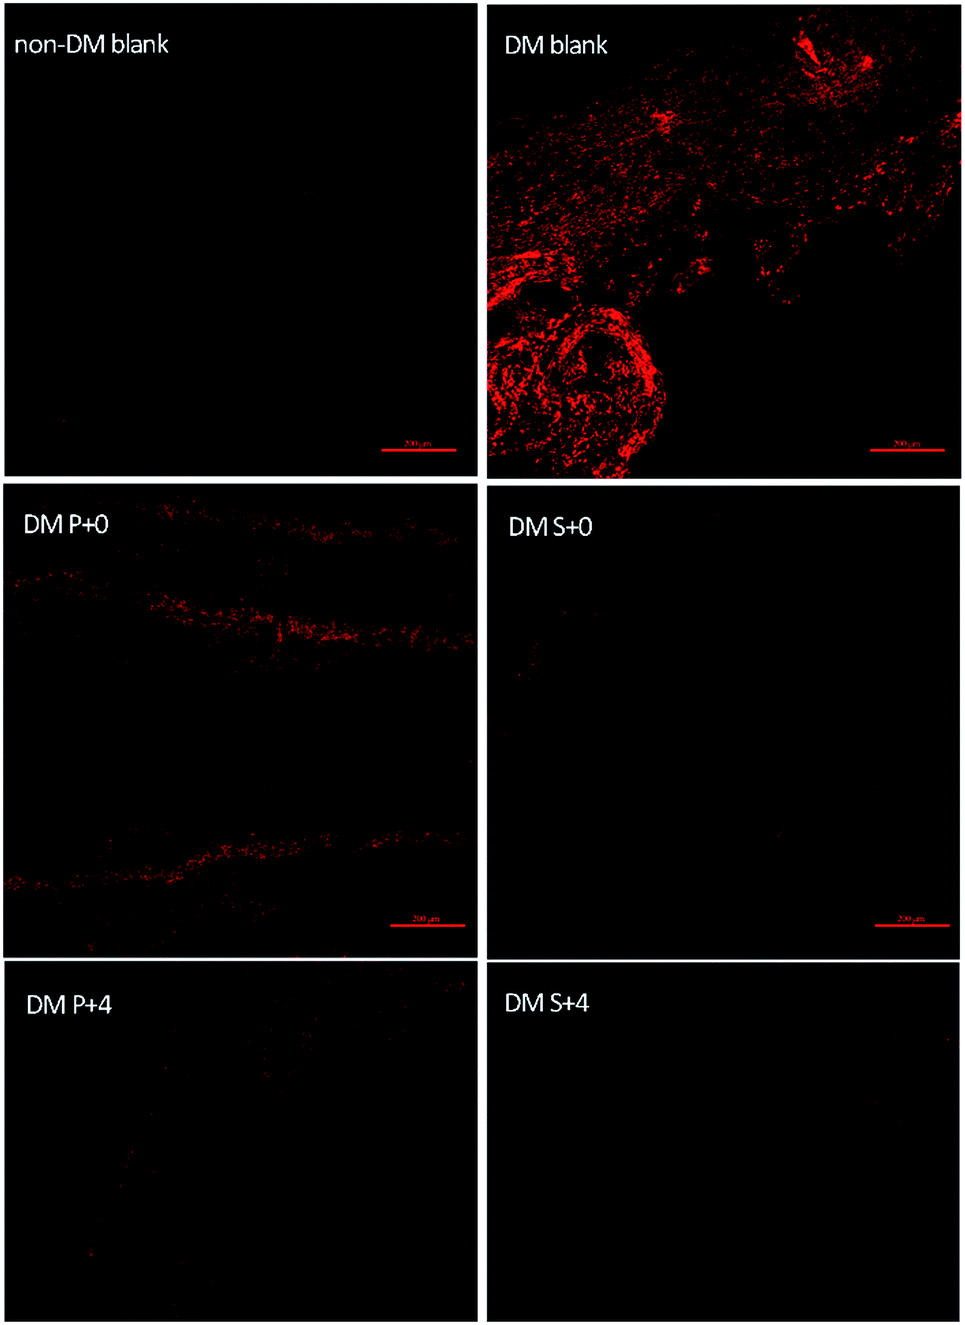 | ||
| Fig. 6 Representative images of DHE staining of the sections to evaluate the ROS levels at the wound sites of various groups at day 7 post-surgery, scale bar = 200 μm. | ||
3.7 Cell viability in vivo
The effect of HB-EGF on the proliferation of keratinocytes was assessed after 7 days post-wounding using Ki-67 (a marker of cell proliferation) immunofluorescence (Fig. 7). Meanwhile, the migration of keratinocytes was determined using stained β4 integrin, which acts to activate Rac1 for coordinated cell motility during wound healing. The DM blank group and the DM P+0 group exhibited a double-negative throughout the wound region. The DM S+0 group induced a small amount of migration of nonproliferating (Ki-67-negative) cells and several related proliferating cells. The DM P+4 group exhibited much more proliferation and cell migration (β4 integrin-positive) when compared with those in the other groups. Notably, the wounds in the DM S+4 group (HB-EGF + S-PLGA) showed a lot of migration of the proliferating cells (double-positive) when compared with those in the other groups, which suggested that 26SCS-modified PLGA scaffolds induced the migration of keratinocytes and related cell proliferation. | ||
| Fig. 7 Immunofluorescent staining of day 7 wound sections for β4 integrin (green) and Ki-67 (red) with DAPI (blue) nuclear staining (yellow arrow: keratinocyte cells migrating, white arrow: keratinocyte cells proliferating). | ||
3.8 Histopathological evaluation
Histological analysis of the wound tissues, using H&E staining and Masson’s trichrome staining, 7 days after the injury, are presented in Fig. 8. As can be seen, the new epithelia did not cover the entire wound surface in all of the groups. We observed that the DM S+4 group had significantly decreased the uncovered area of the wound surface when compared with the other DM groups. By day 14, re-epithelialization was completed in all groups apart from the DM blank group (Fig. 9). In the DM P+0 group and the DM P+4 group, the re-epithelialization was irregular, and there was a gap between the subcutaneous tissue and the dermis, which shows that the subcutaneous tissue was not completely healed. The other three groups showed complete and mature epidermis thickness, similar to non-DM blank group. Moreover, to further assess the effect of the HB-EGF-loaded S-PLGA scaffold on wound healing, the contraction gap, epidermal thickness and collagen deposition were analyzed using Masson’s trichrome staining (MTS), 28 days after the injury (Fig. 10). As shown in Fig. 10B, the contraction gap of the DM S+4 group (6.02 ± 0.22 mm) was significantly smaller than that in the DM P+4 group (10.84 ± 0.86 mm). There was no significant difference between the DM S+4 group and the non-DM blank group (5.68 ± 0.22 mm). Interestingly, the contraction gap of the DM S+0 group (12.65 ± 1.29 mm) was also significantly smaller than that of both the DM blank group (17.25 ± 0.61 mm) and the DM P+0 group (16.39 ± 0.49 mm). The wounds of the DM S+4 group demonstrated an increased thickness in the newly regenerated epidermis when compared with the other DM groups (see Fig. 10C). The epidermal layer thickness in the DM S+4 group was 98.18 ± 21.84 μm, while the data for the DM P+4 group and the non-DM blank group were 75.34 ± 13.94 μm and 70.91 ± 12.46 μm, respectively. It is noteworthy that the DM S+0 group (89.55 ± 15.71 μm) had an increased thickness in the newly regenerated epidermis when compared with the DM P+4 group. There was no significant difference between the DM blank group (45.53 ± 12.09 μm) and the DM P+0 group (48.45 ± 10.12 μm). The blank group, DM P+0 group, DM S+0 group, DM P+4 group and DM S+4 group had thicknesses of 22.7 ± 2.78%, 27.8 ± 8.05%, 45.9 ± 7.89%, 49.9 ± 7.07% and 58.3 ± 2.71%, 28 days post-surgery, respectively, and there was a significant difference between the DM S+0 group and the DM blank group and DM P+0 group. Furthermore, the effect of collagen deposition was analyzed (Fig. 10D). It was found that the collagen deposition percentage for the DM blank group, DM P+0 group, DM S+0 group, DM P+4 group and DM S+4 group were 22.7 ± 2.78%, 27.8 ± 8.05%, 45.9 ± 7.89%, 49.9 ± 7.07% and 58.3 ± 2.71%, 28 days post-surgery, respectively, indicating that collagen deposition in the DM S+4 group was significantly higher than that in the other groups. There is a significant difference between the DM S+0 group and the DM blank group and DM P+0 group.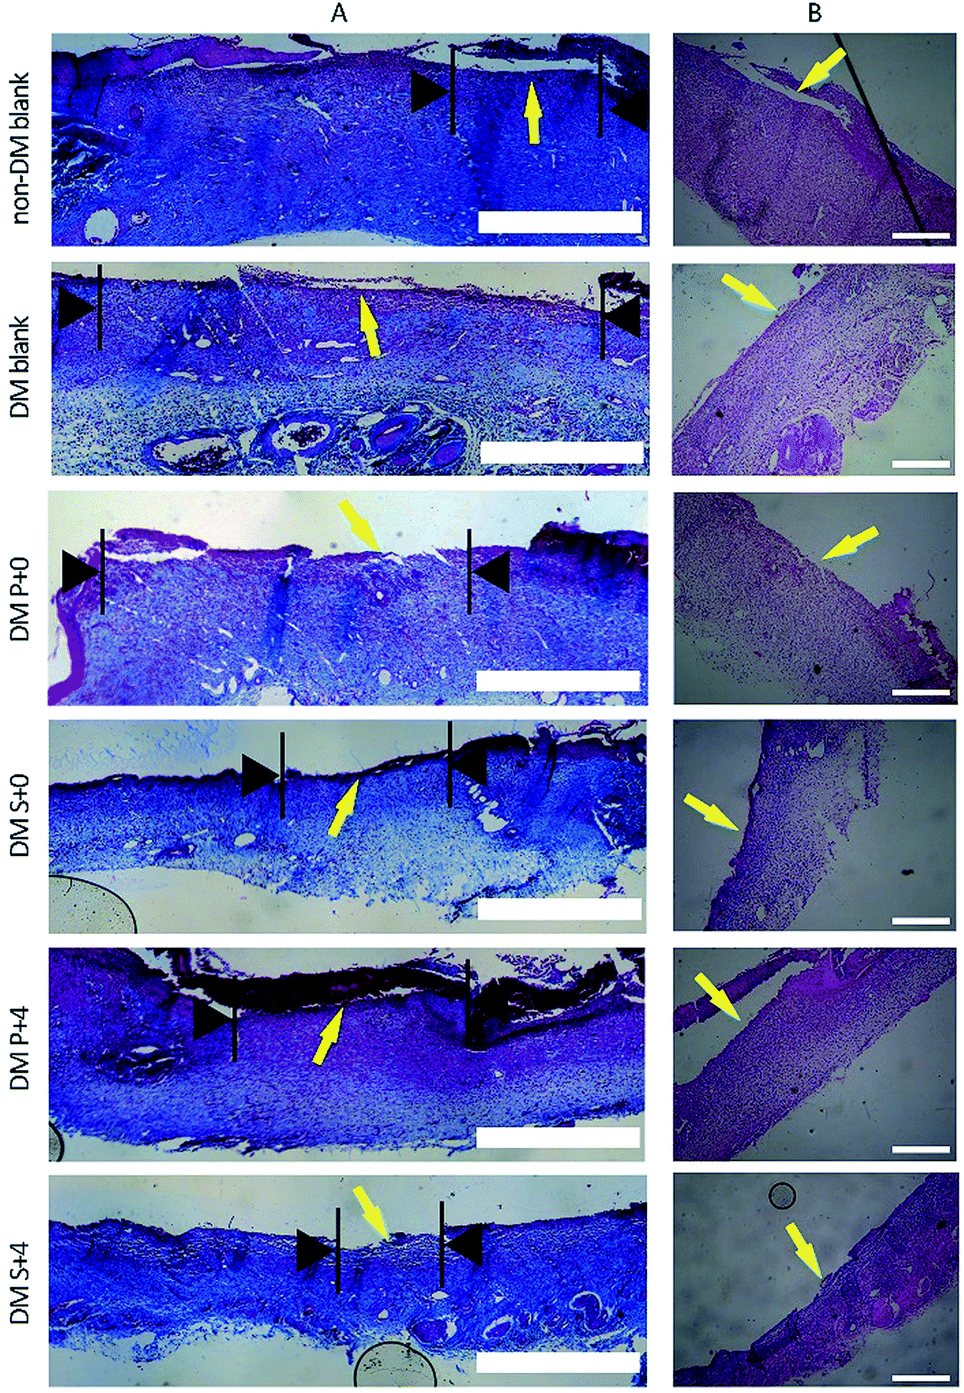 | ||
| Fig. 8 Histological analysis of the wound regions for observing re-epithelialization, 7 days after injury. (A) Staining with MTS. The black arrows indicate the wound surface that did not cover the new epithelia. Scale bars = 1 mm. (B) Staining with HE. Scale bars = 500 μm. | ||
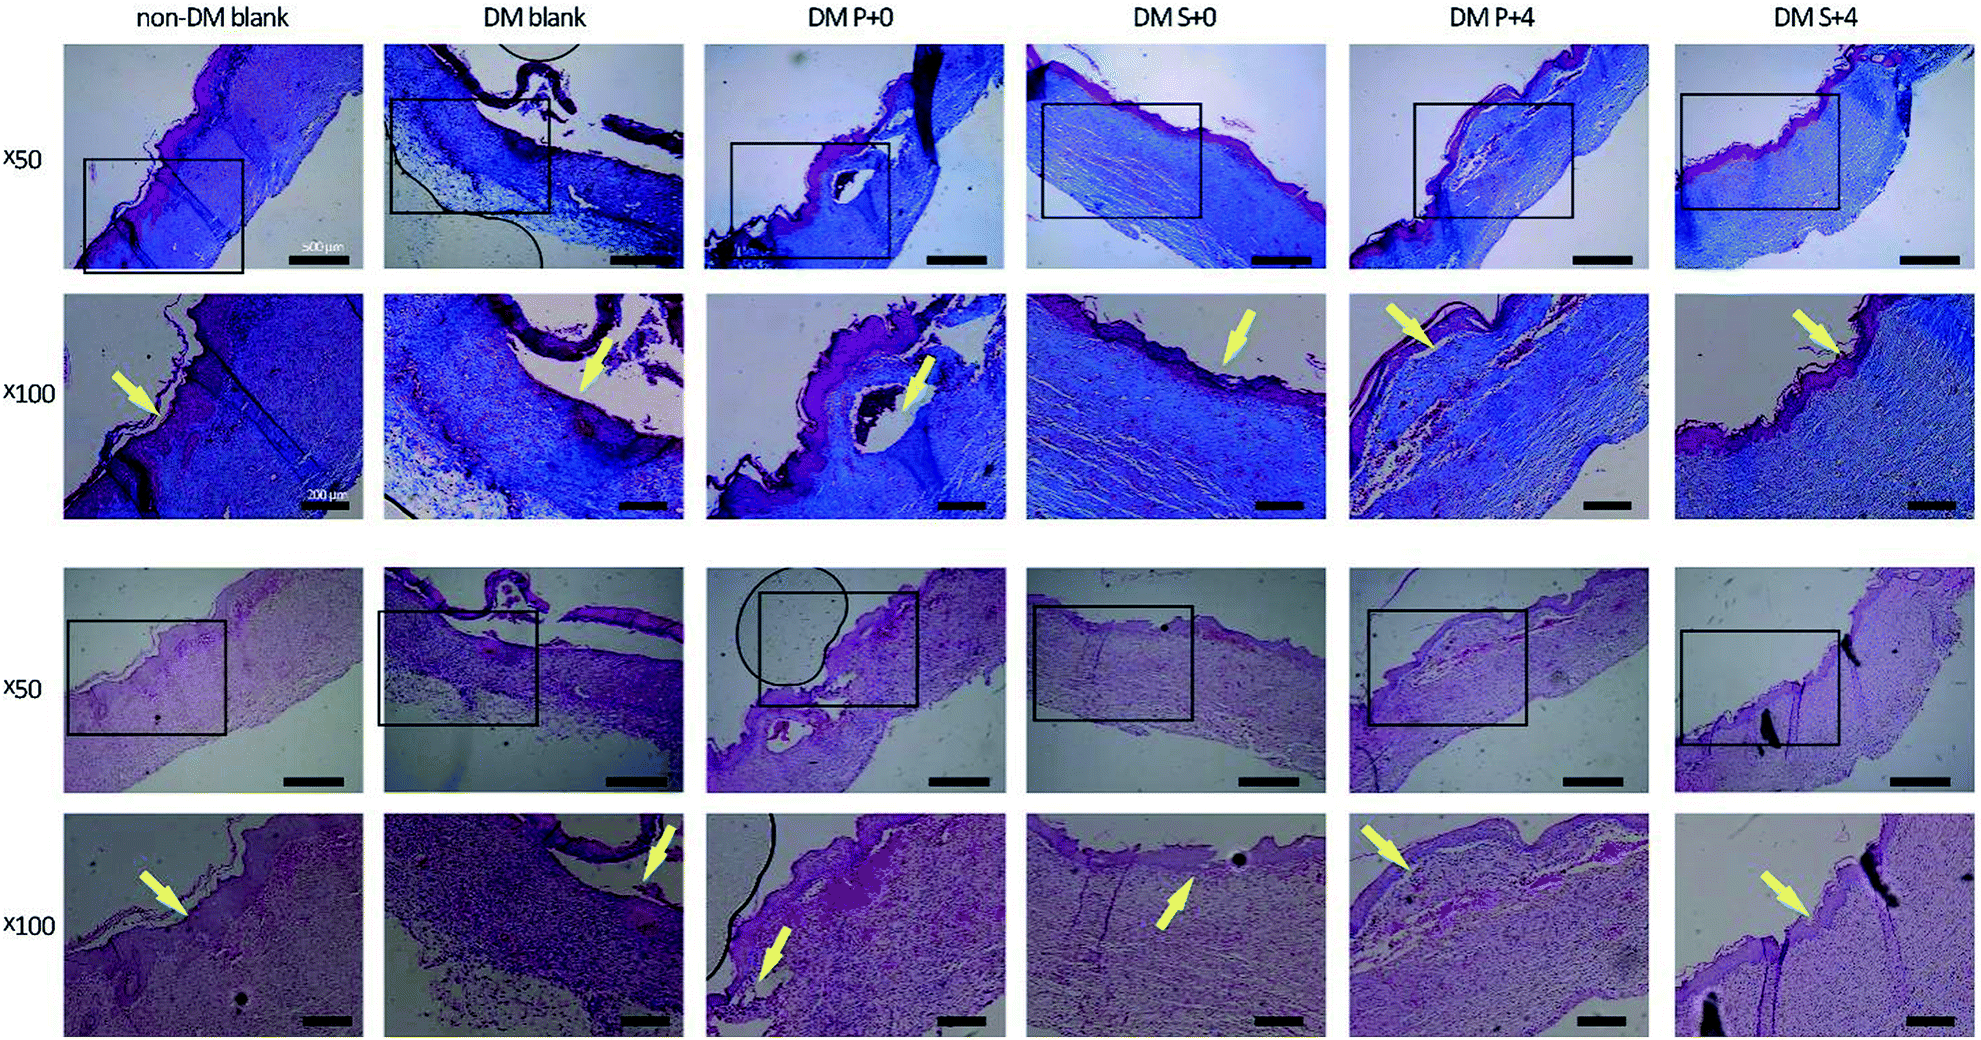 | ||
| Fig. 9 Histological analysis of the wound regions for observing re-epithelialization, 14 days after injury. Staining with Masson's trichrome staining (MTS) and staining with hematoxylin and eosin (HE). | ||
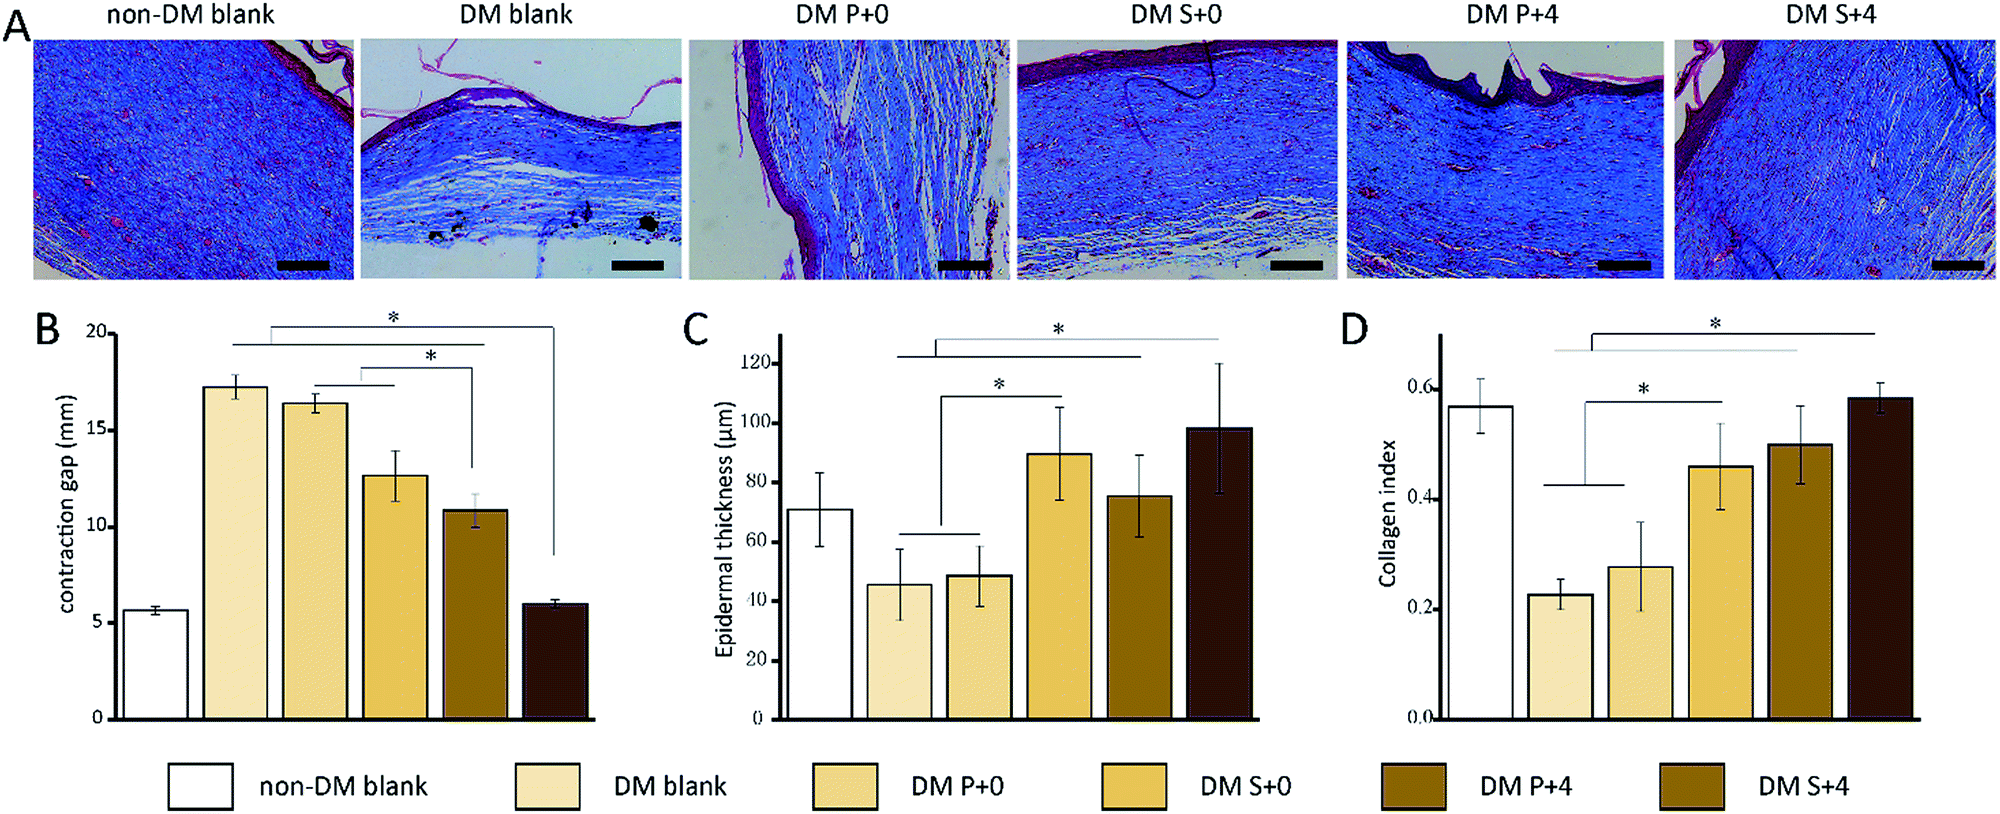 | ||
| Fig. 10 Histological analysis of the wound regions 28 days after injury. (A) MTS for observing wound contraction. Scale bars: 100 μm. (B) The wound contraction was quantified by measuring the gap between the wound margins. (C) Quantification of the thickness of the epidermis. (D) Quantification of the collagen index. *p < 0.05. | ||
4. Discussion
Exogenous GFs applied in the body, especially in a wound environment with high proteolytic activity, have very short half-lives.42 Consequently, numerous delivery systems that show protective and sustained release of the EGF family of proteins have been tested in animal models of diabetic wounds.43 In this study, we designed a 26SCS-modified scaffold (S-PLGA) after two steps of ammonification and sulfonation. As a result, PLGA and S-PLGA scaffold surfaces showed water contact angles of 128.99° and 46.50°, respectively. One of the main focuses of PLGA being used for scaffolds is its hydrophobicity, because it does not allow biological fluids or cells to make contact with PLGA, which further obstructs cell infiltration.44 2-N,6-O-sulfated chitosan (26SCS), a hydrophilic polysaccharide, would drastically improve the hydrophilicity of the PLGA scaffold. Heparin and heparan sulfate, which have a high affinity to bind many growth factors, could protect them from proteolytic degradation and increase their bioactivity, which extends their half-lives.45,46 Moreover, heparin could increase the ability of some growth factors to bind to their cell receptor.47,48 26SCS has a high affinity for heparin-binding growth factors and this can help to achieve controlled release. In our previous work, we demonstrated that heparin-like 26SCS had significant effects on BMP-2, VEGF and HB-EGF, even with a low dose of 26SCS.30–32 In this study, the S-PLGA scaffold was effectively bound to HB-EGF and decreased the rate of release of HB-EGF, especially the burst release, which was reduced from 44.3% to 31.7% (compared to the PLGA scaffold used as a control). Here, we demonstrate similar results to previous reports. Cao et al. developed a 26SCS-modified PCL scaffold for bone morphogenetic protein-2 (BMP-2) delivery and the rate of release observed within 24 h was 30–45%.49 Moreover, at day 10, a controlled and sustained release of HB-EGF of 73.8% was observed from the S-PLGA scaffold compared with 89.3% for the PLGA scaffold. Peng et al. fabricated a 26SCS-embedded PLGA nanofibrous matrix (S-PLGA) as a delivery vehicle for HB-EGF. After 10 days, approximately 56% of the HB-EGF was released from the S-PLGA scaffold and the PLGA scaffold released a total of 83%.32 In contrast, our S-PLGA scaffold released more HB-EGF after 10 days, indicating the higher utilization efficiency of HB-EGF on the S-PLGA scaffold (Fig. 2E).There has been growing recognition that many polysaccharides have scavenging activities for free radicals and can protect cells against oxidative damage induced by hydrogen peroxide. Moreover, it has been reported that the effect of super oxide dismutase (SOD), one of the representative antioxidant enzymes for scavenging radicals and reducing oxidative damage, could be improved by polysaccharides. 26SCS, a derivative of chitosan (CS), exhibits a great anti-antioxidant effect. Ronge Xing et al. studied the antioxidant capacity of different sulfated chitosan systems (236S, 6S, 3S, 36S). Low molecular weight chitosan sulfate showed effective scavenging activity towards superoxide radicals and hydroxyl radicals.25 However, up to now, few studies have focused on the antioxidant effect of chitosan for tissue regeneration. In this study, we assessed the antioxidant activity of 26SCS. It has a strong scavenging activity towards superoxide radicals, a moderate scavenging activity towards hydroxyl radicals and a low scavenging activity towards hydrogen peroxide (Fig. 3). We also demonstrated that the soluble 26SCS exhibited stronger protective effects in Ha-cat cells against H2O2-induced oxidative damage (Fig. 4A). From the results of the control group, it could be confirmed that 500 μM H2O2 and 2 h incubation was sufficient to inhibit the proliferation of Ha-cat cells, and this could be caused by the ROS from H2O2. Liu et al. reported that the viability of Ha-cat cells decreased in a concentration-dependent and time-dependent manner after exposure to H2O2. There was significant difference (P < 0.05) apart from at 50 μM.50 In this study, the results from the 26SCS groups showed significant protection for the viability of H2O2-induced Ha-cat cells, and this may benefit from the treatment with 26SCS, as well as their anti-oxidation. The cells cultured in the presence of the S-PLGA scaffold also showed significant protection against oxidative stress during proliferation (Fig. 4B).
To further confirm the effect of the HB-EGF-loaded S-PLGA scaffold on the behavior of wound healing in vivo, full thickness excisional wounds in diabetic rats were selected for this study. Sashwati et al. showed that certain concentrations (100–250 μM) of H2O2 are present at the normal wound site. Higher doses of H2O2 adversely influenced healing.51 Diabetic wounds are characterized by high levels of ROS, particularly O2− and H2O2 which could lead to oxidative stress.52 In these circumstances, keratinocyte migration, homing and proliferation are impaired.53 It is worth noting that the ROS levels of the DM S+0 group had reduced to a degree (Fig. 5), and the DM S+0 group played a favorable role in proliferation (Fig. 6). These results suggest that 26SCS presumably protected the keratinocytes around the wound from ROS damage, and stimulated the keratinocytes to express the appropriate integrin receptors. As for the DM S+4 group, dihydroethidium (DHE) staining suggested that the ROS levels were effectively decreased when compared to the DM P+4 group at day 7. Moreover, the keratinocytes that stained double positive for β4 integrin and Ki-67 protein were observed well beyond the wound margin in the DM S+4 group. As shown in Fig. 5, the diabetic wound healed faster, especially in the initial phase when 26SCS and HB-EGF were combined for treatment. Substantial dysregulation in the availability and activity of growth factors may cause keratinocyte functional impairment.54 The method of applying EGF to the wound site could stimulate keratinocyte proliferation with the mRNA expression levels of epiregulin, keratin, and loricrin significantly increasing.55,56 Locally prolonged bioavailability is a requirement for a significant EGF-mediated impact on wound closure.57 Experimental studies also suggest that EGF is able to enhance cell survival by controlling oxidative stress.58–60 What’s more, the healing effect of EGF on diabetic wounds seems to be related to a noticeable improvement in the redox balance.61
The data for the histopathological evaluation showed that the HB EGF-loaded S-PLGA scaffold enhanced healing of the full thickness excisional wounds in diabetic rats by affecting wound contraction, epithelial regeneration, and collagen deposition (Fig. 11). The quantity and quality of collagen deposition is critical to wound contraction and revascularization. HB-EGF stimulates fibroblast proliferation and plays a critical role in the process of collagen remodeling.62 Notably, there are also positive effects on wound contraction, epithelial regeneration, and collagen deposition when only the S-PLGA scaffold is used. Excessive ROS production leads to oxidative stress, which can cause impaired dermal fibroblast function.11 Treatment with vitamin C, an antioxidant, can reduce ROS, increase collagen deposition, as well as reduce apoptosis.19 Similar effects were observed with oral administration of an antioxidant; treatment with the mitochondria-targeted antioxidant SkQ1 reduced the ROS levels at the wound site and improved granulation tissue deposition.21
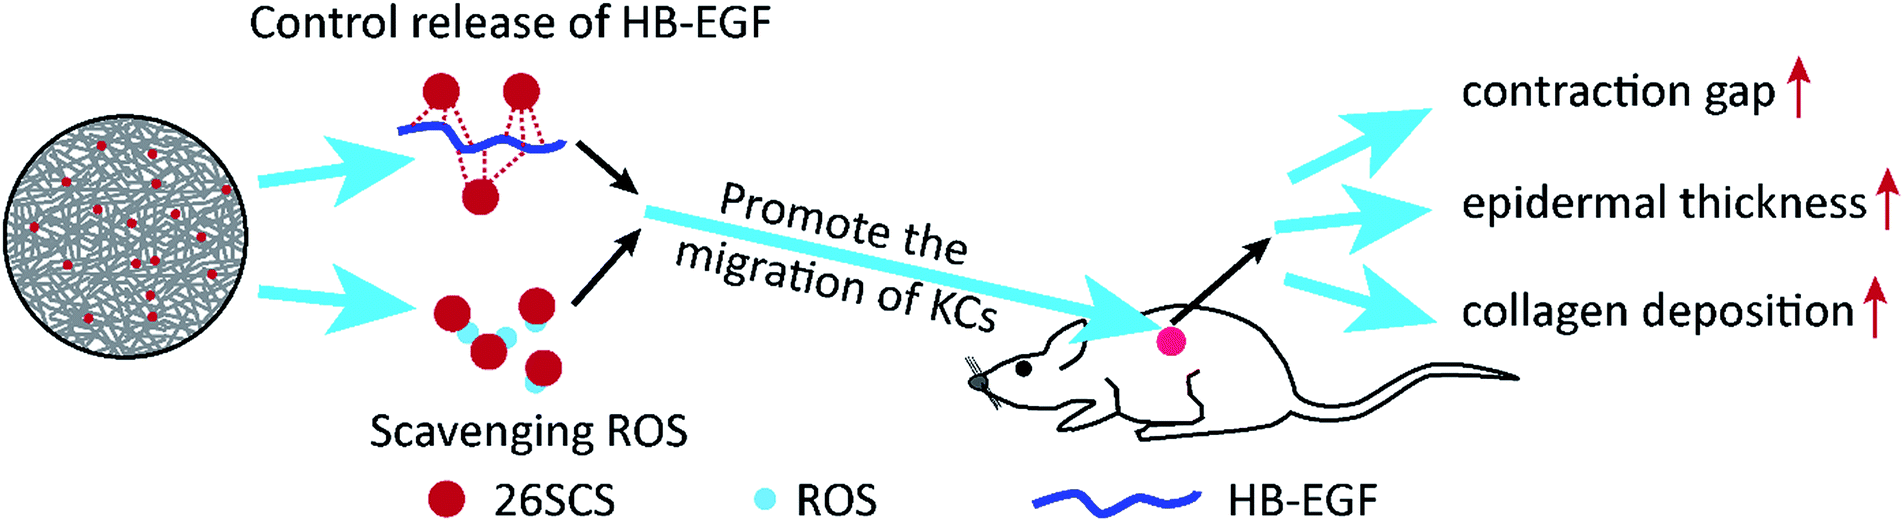 | ||
| Fig. 11 A schematic diagram of the effect of the HB-EGF-loaded S-PLGA scaffold on wound healing. (1) The sustained and controlled release of HB-EGF from the S-PLGA scaffolds. (2) The scavenging activity of 26SCS towards ROS. (3) The synergistic effect of 26SCS and HB-EGF, promoting migration of the Ha-cat cells. (4) The HB-EGF-loaded S-PLGA scaffold enhanced the healing of full thickness excisional wounds in diabetic rats by affecting wound contraction, epithelial regeneration, and collagen deposition. | ||
5. Conclusions
In this study, we designed a 26SCS-modified scaffold (S-PLGA) after two steps of ammonification and sulfonation, which helped to improve the hydrophilicity. When the S-PLGA scaffold was developed for HB-EGF loading, controlled release of HB-EGF was achieved. Furthermore, we assessed the antioxidant activity of 26SCS. It has a strong scavenging activity towards superoxide radicals, a moderate scavenging activity towards hydroxyl radicals and a low scavenging activity towards hydrogen peroxide. We also demonstrated that the soluble 26SCS exhibited stronger protective effects in Ha-cat cells against H2O2-induced oxidative damage. The S-PLGA scaffold played a role in protecting keratinocyte cells from oxidative damage, which led to acceleration of re-epithelialization. The wounds were almost completely healed 28 days after the application of the HB-EGF-loaded S-PLGA scaffold. Besides, the HB EGF-loaded S-PLGA scaffold enhanced healing of the full thickness excisional wounds in diabetic rats by affecting wound contraction, epithelial regeneration, and collagen deposition. Notably, there were also positive effects on wound contraction, epithelial regeneration, and collagen deposition when only the S-PLGA scaffold was used. By this token, these results indicate that the HB-EGF-loaded S-PLGA scaffold can promote the comprehensive and fast curing of cutaneous wounds.Conflicts of interest
There are no conflicts of interests to declare.Acknowledgements
The authors wish to express their gratitude for financial support from the National Natural Science Foundation of China (No. 31330028, No. 31470923), the National Natural Science Foundation of China for Innovative Research Groups (No. 51621002), the International Cooperation Project of Shanghai Science and Technique Committee (15520711100) and the Key Project of Logistic Scientific Research of PLA (BWS13C014). This study was also supported by the 111 Project (B14018).Notes and references
- J. E. Shaw, R. A. Sicree and P. Z. Zimmet, Diabetes Res. Clin. Pract., 2010, 87, 4–14 CrossRef PubMed.
- J. B. Acosta, D. G. del Barco, D. C. Vera, W. Savigne, P. Lopez-Saura, G. G. Nieto and G. S. Schultz, Int. Wound J., 2008, 5, 530–539 CrossRef PubMed.
- R. Blakytny and E. B. Jude, Int. J. Low. Extrem. Wounds, 2009, 8, 95–104 CrossRef PubMed.
- Z. T. Bloomgarden, Diabetes Care, 2008, 31, 372–376 CrossRef PubMed.
- H. Brem and M. Tomic-Canic, J. Clin. Invest., 2007, 117, 1219–1222 CrossRef PubMed.
- M. Muller, C. Trocme, B. Lardy, F. Morel, S. Halimi and P. Y. Benhamou, Diabet. Med., 2008, 25, 419–426 CrossRef PubMed.
- E. Tsourdi, A. Barthel, H. Rietzsch, A. Reichel and S. R. Bornstein, BioMed Res. Int., 2013, 2013, 385641 Search PubMed.
- L. I. Moura, A. M. Dias, E. Carvalho and H. C. de Sousa, Acta Biomater., 2013, 9, 7093–7114 CrossRef PubMed.
- B. Kunkemoeller and T. R. Kyriakides, Antioxidants Redox Signal., 2017, 27, 827–838 Search PubMed.
- N. Spravchikov, G. Sizyakov, M. Gartsbein, D. Accili, T. Tennenbaum and E. Wertheimer, Diabetes, 2001, 50, 1627–1635 CrossRef PubMed.
- B. Y. Kim, M. J. Han and A. S. Chung, Free Radical Biol. Med., 2001, 30, 686–698 CrossRef PubMed.
- C. C. E. Lan, C. S. Wu, H. Y. Kuo, S. M. Huang and G. S. Chen, Br. J. Dermatol., 2009, 160, 1206–1214 CrossRef PubMed.
- W. Droge, Physiol. Rev., 2002, 87, 47–95 CrossRef PubMed.
- T. Hellwig-Bürgel, D. P. Stiehl, A. E. Wagner, E. Metzen and W. Jelkmann, J. Interferon Cytokine Res., 2005, 25, 297–310 CrossRef PubMed.
- S. Frank, H. Kampfer, C. Wetzler and J. Pfeilschifter, Kidney Int., 2002, 61, 882–888 CrossRef PubMed.
- M. A. Loots, E. N. Lamme, J. Zeegelaar, J. R. Mekkes, J. D. Bos and E. Middelkoop, J. Invest. Dermatol., 1998, 111, 850–857 CrossRef PubMed.
- A. L. Weinstein, F. D. Lalezarzadeh, M. A. Soares, P. B. Saadeh and D. J. Ceradini, Wound Repair Regen., 2015, 23, 14–21 CrossRef PubMed.
- P. S. Rabbani, A. Zhou, Z. M. Borab, J. A. Frezzo, N. Srivastava, H. T. More, W. J. Rifkin, J. A. David, S. J. Berens, R. Chen, S. Hameedi, M. H. Junejo, C. Kim, R. A. Sartor, C. F. Liu, P. B. Saadeh, J. K. Montclare and D. J. Ceradini, Biomaterials, 2017, 132, 1–15 CrossRef PubMed.
- Y. H. Lee, J. J. Chang, C. T. Chien, M. C. Yang and H. F. Chien, Exp. Diabetes Res., 2012, 2012, 504693 Search PubMed.
- M. Ram, V. Singh, S. Kumawat, V. Kant, S. K. Tandan and D. Kumar, Int. Immunopharm., 2016, 30, 137–149 CrossRef PubMed.
- I. A. Demyanenko, V. V. Zakharova, O. P. Ilyinskaya, T. V. Vasilieva, A. V. Fedorov, V. N. Manskikh, R. A. Zinovkin, O. Y. Pletjushkina, B. V. Chernyak, V. P. Skulachev and E. N. Popova, Oxid. Med. Cell. Longevity, 2017, 6408278 Search PubMed.
- W. M. Xie, P. X. Xu and Q. Liu, Bioorg. Med. Chem. Lett., 2001, 11, 1699–1701 CrossRef PubMed.
- F. Khodagholi, B. Eftekharzadeh, N. Maghsoudi and P. F. Rezaei, Mol. Cell. Biochem., 2010, 337, 39–51 CrossRef PubMed.
- F. Karadeniz, M. Artan, C.-S. Kong and S.-K. Kim, Carbohydr. Polym., 2010, 82, 143–147 CrossRef.
- R. Xing, S. Liu, Z. Guo, H. Yu, P. Wang, C. Li, Z. Li and P. Li, Bioorg. Med. Chem., 2005, 13, 1573–1577 CrossRef PubMed.
- J. Wang, H. Guo, J. Zhang, X. Wang, B. Zhao, J. Yao and Y. Wang, Carbohydr. Polym., 2010, 81, 897–905 CrossRef.
- Z. J. Wang, J. H. Xie, L. J. Kan, J. Q. Wang, M. Y. Shen, W. J. Li, S. P. Nie and M. Y. Xie, Int. J. Biol. Macromol., 2015, 80, 410–417 CrossRef PubMed.
- A. Kerschenmeyer, O. Arlov, V. Malheiro, M. Steinwachs, M. Rottmar, K. Maniura-Weber, G. Palazzolo and M. Zenobi-Wong, Biomater. Sci., 2017, 5, 1756–1765 RSC.
- R. R. Chen and D. J. Mooney, Pharm. Res., 2003, 20, 1103–1112 CrossRef.
- L. Cao, J. Wang, J. Hou, W. Xing and C. Liu, Biomaterials, 2014, 35, 684–698 CrossRef PubMed.
- Y. Yu, J. Chen, R. Chen, L. Cao, W. Tang, D. Lin, J. Wang and C. Liu, ACS Appl. Mater. Interfaces, 2015, 7, 9982–9990 Search PubMed.
- X. Peng, Y. Yu, Z. Wang, X. Zhang, J. Wang and C. Liu, RSC Adv., 2017, 7, 43161–43171 RSC.
- Y. Pan, J. Chen, Y. Yu, K. Dai, J. Wang and C. Liu, Biomater. Sci., 2018, 6, 431–439 RSC.
- J. Tavakoli, J. Mech. Behav. Biomed. Mater., 2017, 65, 373–382 CrossRef PubMed.
- M. Nishikimi, N. Appaji Rao and K. Yagi, Biochem. Biophys. Res. Commun., 1972, 46, 849–854 CrossRef PubMed.
- P. Seedevi, M. Moovendhan, S. Vairamani and A. Shanmugam, Int. J. Biol. Macromol., 2017, 99, 519–529 CrossRef PubMed.
- B. Hsu, I. M. Coupar and K. Ng, Food Chem., 2006, 98, 317–328 CrossRef.
- C. Liu, C. Wang, Z. Xu and Y. Wang, Process Biochem., 2007, 42, 961–970 CrossRef.
- W. Wang, S. Lin, Y. Xiao, Y. Huang, Y. Tan, L. Cai and X. Li, Life Sci., 2008, 82, 190–204 CrossRef PubMed.
- F. Silver, Y. Kato, M. Ohno and A. Wasserman, J. Long Term Eff. Med. Implants, 1992, 2, 165–198 Search PubMed.
- M. Sun, J. Deng and C. Gao, J. Colloid Interface Sci., 2015, 448, 231–237 CrossRef PubMed.
- B. Mast and G. Schultz, Wound Repair Regen., 1996, 4, 411–420 CrossRef PubMed.
- T. N. Demidova-Rice, M. R. Hamblin and I. M. Herman, Adv. Skin Wound Care, 2012, 25, 349–370 CrossRef PubMed.
- F. A. Sheikh, H. W. Ju, B. M. Moon, O. J. Lee, J.-H. Kim, H. J. Park, D. W. Kim, D.-K. Kim, J. E. Jang, G. Khang and C. H. Park, J. Regen. Med. Tissue Eng., 2016, 10, 209–221 CrossRef PubMed.
- G. S. Schultz and A. Wysocki, Wound Repair Regen., 2009, 17, 153–162 CrossRef PubMed.
- R. Hynes, Science, 2009, 326, 1216–1219 CrossRef PubMed.
- D. H. Damon, R. R. Lobb, P. A. D’Amore and J. A. Wagner, J. Cell. Physiol., 1989, 138, 221–226 CrossRef PubMed.
- T. Spivak-Kroizman, M. A. Lemmon, I. Dikic, J. E. Ladbury, D. Pinchasi, J. Huang, M. Jaye, G. Crumley, J. Schlessinger and I. Lax, Cell, 1994, 79, 1015–1024 CrossRef PubMed.
- L. Cao, Y. Yu, J. Wang, J. A. Werkmeister, K. M. McLean and C. Liu, Mater. Sci. Eng., C, 2017, 74, 298–306 CrossRef PubMed.
- L. Liu, H. Xie, X. Chen, W. Shi, X. Xiao, D. Lei and J. Li, Clin. Exp. Dermatol., 2012, 37, 772–780 CrossRef PubMed.
- S. Roy, S. Khanna, K. Nallu, T. K. Hunt and C. K. Sen, Mol. Ther., 2006, 11, 211–220 CrossRef PubMed.
- S. Dhall, D. C. Do, M. Garcia, J. Kim, S. H. Mirebrahim, J. Lyubovitsky, S. Lonardi, E. A. Nothnagel, N. Schiller and M. Martins-Green, J. Diabetes Res., 2014, 2014, 562625 Search PubMed.
- V. Falanga, Lancet, 2005, 366, 1736–1743 CrossRef.
- S. E. Thomson, S. V. McLennan and S. M. Twigg, Expet Rev. Clin. Immunol., 2006, 2, 403–418 CrossRef PubMed.
- K. Hashimoto, S. Higashiyama, H. Asada, E. Hashimura, T. Kobayashi, K. Sudo, T. Nakagawa, D. Damm, K. Yoshikawa and N. Taniguchi, J. Biol. Chem., 1994, 269, 20060–20066 Search PubMed.
- K. P. Xu, Y. F. Li, A. V. Ljubimov and F. S. X. Yu, Diabetes, 2009, 58, 1077–1085 CrossRef PubMed.
- A. Buckley, J. M. Davidson, C. D. Kamerath, T. B. Wolt and S. C. Woodward, Proc. Natl. Acad. Sci. U. S. A., 1985, 82, 7340–7344 CrossRef.
- J. Berlanga, P. Prats, D. Remirez, R. Gonzalez, P. Lopez-Saura, J. Aguiar, M. Ojeda, J. J. Boyle, A. J. Fitzgerald and R. J. Playford, Am. J. Pathol., 2002, 161, 373–379 CrossRef PubMed.
- M. E. Caballero, J. Berlanga, D. Ramirez, P. Lopez-Suara, R. Gozalez, D. N. Floyd, T. Marchbank and R. J. Playford, Gut, 2001, 48, 34–40 CrossRef PubMed.
- Z. Hu, C. Chen, J. Yang, Z. Zhou, Z. Song and Z. Wang, Int. J. Ophthalmol., 2014, 7, 413–420 Search PubMed.
- A. G. Ojalvo, J. B. Acosta, Y. M. Mari, M. F. Mayola, C. V. Perez, W. S. Gutierrez, Marichal, II, E. A. Seijas, A. M. Kautzman, A. E. Pacheco and D. G. Armstrong, Int. Wound J., 2017, 14, 214–225 CrossRef PubMed.
- R. Kajanne, P. Miettinen, A. Mehlem, S. K. Leivonen, M. Birrer, M. Foschi, V. M. Kahari and S. Leppa, J. Cell. Physiol., 2007, 212, 489–497 CrossRef PubMed.
| This journal is © The Royal Society of Chemistry 2018 |