DOI:
10.1039/C8RA02077A
(Paper)
RSC Adv., 2018,
8, 11935-11945
Stabilized fabrication of anatase-TiO2/FeS2 (pyrite) semiconductor composite nanocrystals for enhanced solar light-mediated photocatalytic degradation of methylene blue
Received
9th March 2018
, Accepted 20th March 2018
First published on 27th March 2018
Abstract
A novel visible light active TiO2/FeS2 semiconductor photocatalyst was synthesized by a simple wet chemical process. X-ray diffraction (XRD) was used to analyze the anatase TiO2 and pyrite structures in FeS2/TiO2 nanocrystals. Scanning electron microscopy (SEM) confirmed the spherical morphology of composite nanocrystals. X-ray photoelectron spectroscopy (XPS) identified the Fe2+, S1−, Ti4+, and O2− oxidation states of relevant species. Energy dispersive X-ray (EDX) analysis was performed for compositional analysis. The measured band gap of the TiO2/FeS2 nanocomposite system was 2.67 eV, which is smaller than un-doped TiO2 (3.10 eV) and larger than FeS2 (1.94 eV). The photocatalytic activity of TiO2/FeS2 was significantly higher than pure FeS2 for degrading methylene blue (MB) under solar light irradiation due to the increase in visible light absorption, reduction in band gap energy, and better election–hole pair separation. The photocatalytic degradation of MB was investigated under the influence of solution pH, dye concentrations, and varied catalyst dosage. The optimum degradation (100%) of MB was observed in 180 min and the photocatalysis of MB reduced as the dye concentrations in the solution increased from 15 to 75 mg L−1. These results prove that the TiO2/FeS2 nanocomposite has the stability, recycling, and adaptability for its practical application as a visible light photocatalyst for wastewater treatment. TiO2/FeS2 showed increased degradation of the organic pollutant; which is confirmed by the increased rate of chemical reaction following pseudo first-order reaction kinetics with the highest rate constant value of 0.0408 m−1 having highest R2 value of 0.9981.
1. Introduction
Photocatalytic treatments have been extensively recommended for environmental remediation under benign conditions.1 In the presence of a photocatalyst and a beam source of suitable energy, this process can mineralize natural contaminants to nontoxic items such as H2O and CO2.2 Although different physiochemical methods such as adsorption ultrafiltration, reverse osmosis, and biodegradation have been used to remove dyes, all these methods have certain shortcomings. For instance, chemical methods are expensive, require a large dosage of chemicals, and produce hazardous sludge.3 Physical methods, on the other hand, transfer pollutants from a liquid phase to solid waste. Biological degradation of dyes has been found to be ineffective and inefficient as they produce aromatic amines. Photocatalytic degradation has been frequently used in wastewater treatment due to its high photoactivity, non-toxicity, low cost, photochemical stability, and unusual capability to degrade pollutants.4 Among the semiconductor photocatalysts, titanium dioxide (TiO2) nanocrystals are a highly efficient photocatalyst and have been the leading conventional substance for degrading natural impurities.5,6 Augmenting to its non-toxicity, abundance, and moderately little cost, TiO2 also demonstrates excellent photocatalytic activity in numerous degradation responses. To develop the consumption of solar energy, many investigative attempts have focused on exploring the photocatalytic hydrogen generating potential of TiO2 in the visible spectrum (λ > 400 nm) which accounts for ∼42% of solar power.7
Despite the fact that the photocatalytic properties of TiO2 nanocrystals are predominantly controlled by particle dimension, poorer photocatalytic degradation rates are experienced on the exterior surface of TiO2 nanoparticles due to their extensive band gap and rapid recombination rate of photogenerated electron–hole pairs.8 Consequently, the alteration of TiO2 to decrease such recombination remains as a serious assignment.9 A significant contribution in this regard can be made by using an environmentally benign and sustainable material as a modifier for TiO2 as one of the preeminent modifiers. Employing a co-catalyst has been a predictable way to advance the photocatalytic performances of semiconductor photocatalysts because it enhances charge separation and minimizes photo-corrosion of the semiconductor photocatalyst.10 Metal doping,11 non-metal doping,12 and composites with other semiconductors13 also are a few of the potential approaches used to improve the capability of TiO2 based materials to utilize solar energy. In recent years, much research has been focused on TiO2 composites with chalcogenides because their narrow bandgaps allow absorption of longer wavelengths than pure TiO2.14,15 Research on metal sulfide photocatalysts has shown growth from the analytical to the application phase, and their short band gaps permit absorption at longer wavelengths than TiO2.10 Usually, CdS, ZnS, FeS2, and MoS2 are the most studied sulfide photocatalysts due to their band gap energy, which matches well with the solar spectrum.16,17 Among them FeS2, also known as pyrite, displays interesting electronic and optical properties as it is an additional constructive applicant for the photosensitization of materials in addition to its environmental compatibilities and high stability toward photo-corrosion as well as high absorption in the visible section of the solar spectrum. In our study, one of the possible co-catalyst modifiers was iron(II) sulfide (FeS2), which is nontoxic, stable, inexpensive, and found in abundance in the world. It can efficiently adsorb and photocatalytically degrade organic dyes18 due to its surface chemical properties, high optical absorption coefficient (6 × 105 cm−1),19 a high capacity (exceeding 890 mA h g−1), and suitable band gap i.e., 1.00 ± 0.15 eV20 compared to other sulphides. Due to these interesting properties, FeS2 has been investigated for applications in photovoltaic devices21 and lithium-ion batteries.22 FeS2 has been prepared by a variety of techniques, including hydrothermal, solvothermal, metal organic chemical vapor deposition, and sulfurization of iron or iron oxide films as reported earlier.23
The benefits of integrating two dissimilar metal oxides/sulfide not only progresses photocatalytic activity but also exhibits different physical and chemical properties when evaluated in comparison to constituent metal oxides.24 The formation of composites of nanocrystals is a widely explored idea in order to obtain a hybrid which could simultaneously combine the properties of TiO2 as a fascinating semiconducting material with the features of single nano-sized metal sulfide particles. The addition of FeS2 to TiO2 produces a red shift in the absorption edge resulting in a band gap of 2.94–2.84 eV for the composite.25 It has been reported26 that photocatalytic degradation of MB in the presence of TiO2/MoS2 composite was increased up to 65% compared to pure TiO2 (15%). Similarly,27 the spindle-like TiO2/CdS composite had a 3.5 times higher photocatalytic efficiency compared to pure CdS. Lee and co-workers25 synthesized a FeS2/TiO2 composite using a solvothermal method; which exhibited 5 times higher hydrogen production compared to pure TiO2. Recently, a FeS2/TiO2 photo-anode was investigated28 which exhibited enhanced photo-response from visible light to an extended near IR range (400–900 nm). Few reports of the composites TiO2/FeS2 quantum dots,29 nanotubes,30 core shell,25 thin films,31 and spheres32 are reported earlier for applications with solar cells. In this report, we focused on the nanocrystals of composites of the TiO2/FeS2 system for solar photocatalysis. The present research is focused on developing a photocatalytic system that can effectively utilize sunlight or visible light to degrade commonly used MB dye (a known environmental contaminant). To the best of our information, no study has been conducted to determine the efficiency of composite (TiO2/FeS2) as a photocatalyst for treatment of MB. We believe the proposed novel FeS2/TiO2 nanocrystals composite has the prospective to tackle the low efficiency problems of photoelectrochemical (PEC) water splitting in visible and infrared light regions, and therefore can build a noteworthy contribution in the field of energy exchange.
2. Materials and methods
2.1 Materials
FeSO4·7H2O and Na2S2O3 were supplied by BDH chemical Ltd and Sigma-Aldrich (USA); TiCl4 was purchased from Sigma-Aldrich (USA); Methylene Blue was supplied by BDH chemical Ltd (USA) and standard grade was utilized as the test pollutant. Deionized water was used for solution preparations. All other chemicals were also analytical grade.
2.2 Synthesis of TiO2/FeS2 nanocrystals
In a typical procedure, 3.58 g of FeSO4 and 8.5 g of Na2S2O3 were added to 175 mL ethanol and sonicated for 1 h. Then, 2 mL of TiCl4 was added to the solution and refluxed at 156 °C for 5 h. A brownish material was filtered and thoroughly washed with deionized water followed by acetone and dried at 80 °C for 12 h. FeS2 nanoparticles were synthesized using the same procedure in the absence of TiCl4.
2.3 Characterization
The crystalline structures of as-prepared composites were characterized using a D8 Bruker X-ray diffractometer by scanning 2θ angle ranging from 20 to 80° at a scanning rate of 0.50° per minute using Cu Kα 1.5418 radiation. A Hitachi S-4800 microscope at an operating voltage of 15 kV was used to obtain scanning electron microscope (SEM) images to determine size and shape of the composite. The sample was coated with platinum and copper for effective imaging before being charged. Energy dispersive X-ray (EDAX) was used to determine the elemental composition of particles (EDX, Oxford Instruments, INCA x-sight) with 10 keV electron beam energy. X-ray photoelectron spectroscopy (XPS) measurements were performed for chemical analysis of the TiO2/FeS2 nanocomposite. XPS data acquisition was performed in ultra-high vacuum conditions using a standard omicron system equipped with monochromatic Al Kα 1486.7 eV X-ray source. The source was operated at 15 keV at constant analyzer energy (CAE) of 100 eV for survey scans and 20 eV for detailed scans. Data acquisition was performed with Matrix software and data analysis was performed with Igor Pro along with XPS fit procedures. Curve fitting of spectra was achieved using Gaussian–Lorentzia line shape after performing Shrilly background corrections. The C 1s binding energy at 284.8 eV was used for calibration. DRS data were recorded using a UV-Vis spectrophotometer (Shimadzu UV-2550) using standard 1 cm quartz cuvettes. A GC (QP2010 ultra, Shimadzu) having a DB-5ms capillary column (30.00 m × 0.25 mm, 0.25 μm film thickness) was coupled to a QP2010 ultra Shimadzu mass selective detector which was used to detect the degradation products. The initial oven temperature (60 °C for 10 min initially) was raised at a rate of 10 °C min−1, while injection temperature was 250 °C, and the injection mode was split. Helium was used as a carrier gas. To prepare samples for GC-MS injection, a MB dye solution containing TiO2/FeS2 composite was filtered, organic compounds were extracted using 5 mL dichloromethane, and analyzed by GC-MS.
2.4 Photocatalytic experiments
The photocatalytic activity of the synthesized FeS2/TiO2 nanocomposite was evaluated under visible and direct sunlight conditions. A Luzchem photochemical reactor (LZC4) was used for visible light investigations with irradiation of 104 W Slovenia cool white lamps (λ = 390–700 nm) and spectral irradiance of 17.45 mW cm−2 monitored by a Luzchem power monitor at a distance of 12 cm from the light source. Photocatalytic experiments were performed with 250 mL of MB solution at normal solution pH of 5.5 in a Pyrex® glass reactor under continuous stirring and aeration conditions. In typical experiments, duplicate solutions containing 25 mg L−1 of MB and 1 g L−1 TiO2/FeS2 nanocomposite (except in case of photolytic studies) were taken and one of the identical solutions was exposed to direct sunlight and the other to visible light. To establish adsorption–desorption equilibrium of MB over the surface of TiO2/FeS2 nanoparticles, all experiments were carried out for an initial 30 min under dark conditions followed by irradiation with visible/sunlight for 180 min. Aliquots of 3 mL samples were taken at 30 min intervals and filtered through 0.22 μm syringe filters to remove catalyst particles. The residual concentrations of MB in supernatant solutions were determined using a UV-visible spectrophotometer (Hitachi U3000) at 665 nm. To assess the impact of dye concentration on photocatalytic efficiency of TiO2/FeS2, experiments were performed at initial dye concentrations ranging from 15–75 mg L−1. After determination of the optimum dye concentration, additional parameters, including the solution pH and catalyst dose were determined. Comparative studies for direct sunlight photocatalytic degradation of MB were carried out during the months of May and June with average sunlight illumination intensity of 10![[thin space (1/6-em)]](https://www.rsc.org/images/entities/char_2009.gif) 000–12
000–12![[thin space (1/6-em)]](https://www.rsc.org/images/entities/char_2009.gif) 000 lx. The remaining procedure was the same as for visible light studies.
000 lx. The remaining procedure was the same as for visible light studies.
3. Results and analysis
3.1 X-ray diffraction
Fig. 1(a–c) shows the Bragg diffraction spectrum of polycrystalline FeS2, TiO2, and composite as synthesized samples, respectively. The diffracted peaks for FeS2 (Fig. 1(a)) reflect the single homogeneous phase of FeS2 corresponding to cubic phase (JCPDS 00-042-1340) and exhibiting pyrite crystal structure. No extra peaks related to sulfur or any impurity phase such as marcasite, pyrrhotite, or troilite were obtained. Lattice parameters for the cubic structure were measured as: a = b = c = 5.418 Å. The presence of broad peaks in the XRD pattern confirmed the nano-crystalline nature. The average crystallite sizes of pyrite nanocrystals using the Debye–Scherer equation were estimated to be about 15 nm. Fig. 1(b) demonstrated good crystalline single phase anatase-TiO2 structures with prominent phase stability along (101) axis. The lattice parameters of anatase TiO2 nanocrystals are a = 3.7835 Å and c = 9.2371 Å. The crystallite size of the anatase TiO2 sample is 12 nm.
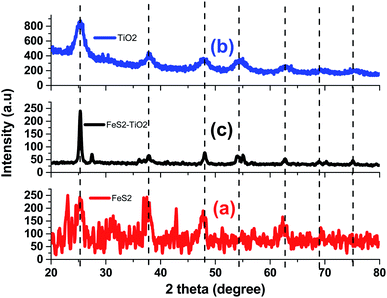 |
| | Fig. 1 Bragg-diffraction spectrum of (a) FeS2, (b) TiO2, and (c) TiO2/FeS2 composite. | |
XRD patterns (Fig. 1(c)) for the TiO2/FeS2 composite showed mixed pyrite and anatase phases of constituent nanocrystals. The composite sample has a dominant peak which represents a (110) peak of TiO2 (anatase) phase. The anatase phase was stable in the presence of FeS2 nanocrystals. In the XRD pattern of the composite system, peaks corresponding to a rutile phase were not observed. The pyrite FeS2 phase could be clearly observed in the XRD patterns of the composite. The composite sample has another significant peak at ∼48° which corresponds to the (121) peak of the FeS2 phase. The intensity of the peak at 2θ = 25.85 degree of anatase TiO2 NPs (JCPDS card no. #84-1286) decreased as the FeS2 content was added into the composite systems. The composite sample has another significant peak at ∼48° corresponding to the (121) peak of the FeS2 phase.
3.2 Microstructural measurements
Scanning electron microscope images of FeS2 nanocrystals and TiO2/FeS2 composite nanocrystals are presented in Fig. 2(a and b) respectively. Nanocrystals of FeS2 are uniformly spherical shapes while composite nanocrystals are mostly spherical with a few being elongated with increasing grain size. Micrographs confirmed that the grain size of FeS2 is smaller than the TiO2/FeS2 nanocomposite system. These observations correspond with XRD findings, as discussed in the above section. Compositional analysis was confirmed from energy dispersive X-ray spectroscopy (EDXS) measurements as demonstrated in Fig. 3. The spectra of a composite sample confirmed the presence of Ti, O, Fe, and S from constituents, while the Cu and C signal originated due to carbon tape and Cu grids. The weight percentage (wt%) of each element obtained from EDXS are presented in Table 1.
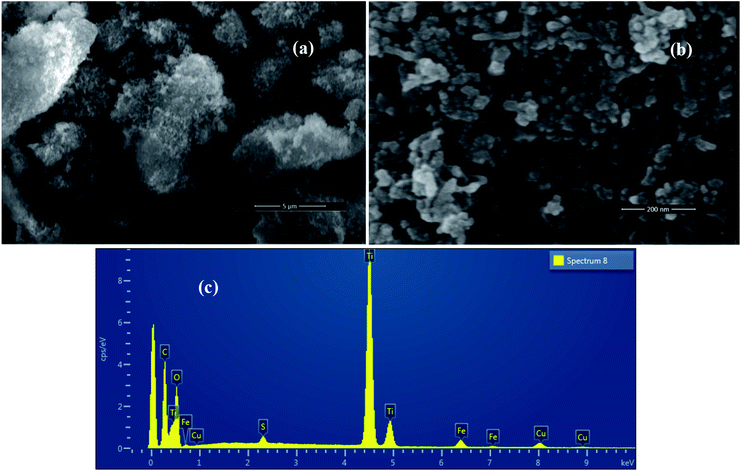 |
| | Fig. 2 SEM images of synthesized (a) TiO2/FeS2, (b) FeS2 nanoparticles, and (c) EDAX of TiO2/FeS2. | |
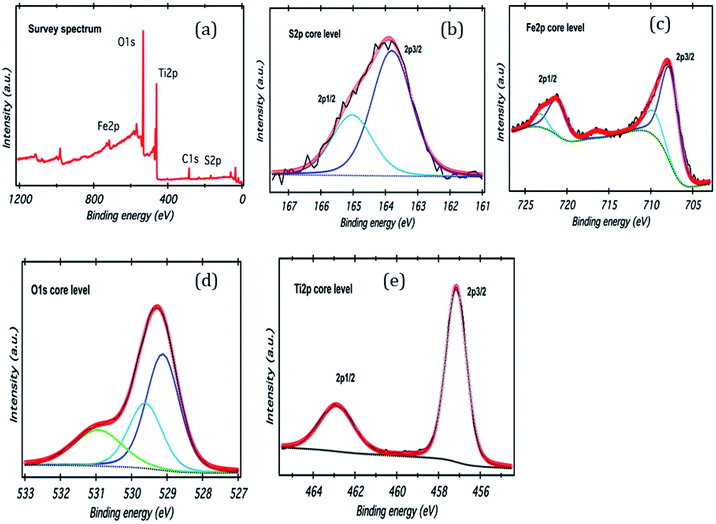 |
| | Fig. 3 (a) XPS survey scan of FeS2/TiO2, (b–e) high resolution XPS spectra of S 2p, Fe 2p, O 1s, and Ti 2p. | |
Table 1 Effect of catalyst dose, solution pH, and MB concentration on photocatalytic reaction rate
| Catalyst dosea (g L−1) |
kapp (min−1) |
R2 |
Solutionb (pH) |
kapp (min−1) |
R2 |
Initial concentrationc (mg L−1) |
kapp (min−1) |
R2 |
| MB = 25 mg L−1, pH = 5, light source = sunlight. MB = 25 mg L−1, catalyst = 1 g L−1, light source = sunlight. pH = 7, catalyst = 1 g L−1, light source = sunlight. |
| 0.25 |
0.0377 |
0.9793 |
2 |
0.0045 |
0.9216 |
15 |
0.0402 |
0.9981 |
| 0.5 |
0.0316 |
0.9876 |
5 |
0.0297 |
0.9444 |
25 |
0.0316 |
0.9834 |
| 1 |
0.0409 |
0.9346 |
7 |
0.0377 |
0.9793 |
50 |
0.0215 |
0.9974 |
| |
|
|
9 |
0.0408 |
0.9334 |
75 |
0.0017 |
0.9445 |
3.3 Chemical properties
XPS analysis of the TiO2/FeS2 nanocomposite is shown in Fig. 3. The wide scan spectra of TiO2/FeS2 (Fig. 3(a)) consists of the peaks for S, Ti, Fe, and O as major elements. High resolution spectra of S 2p (Fig. 3(b)) shows two peaks centered at 163.8 eV and 165.0 eV corresponding to the S 2p3/2 and S 2p1/2 of the sulfur binding energy in FeS2. A high intensity peak (Fig. 3(c)) appeared at 707.7 eV and is the characteristic of pyrite (Fe 2p3/2).33,34 The O 1s peak located at binding energies of 529.0 eV (due to oxygen bonding with Ti species), 529.7 eV (due to oxygen vacancies) and 531.0 eV (due to O2−, OH−, and H2O) are presented in Fig. 3(d), respectively. Doublet peaks appearing at binding energies of 458.1 and 463.9 eV belong to Ti 2p3/2 and Ti 2p1/2 in the TiO2 (Fig. 3(e))35 nano-composite system indicating the presence of Ti4+ species.
3.4 Optical spectroscopy
UV-Vis absorption spectra of nanocrystals TiO2, FeS2, and composite TiO2/FeS2 are plotted in Fig. 4. The maximum absorbance of the TiO2 sample is 80% while the TiO2 and nanocomposite sample has maximum 100% absorbance at a lower wavelength range. The band gap energy of all samples was calculated using the following equation:where λg is the absorption onset wavelength (nm) of the exciting light, c is velocity of light and h is Plank's constant. The band gap energy values of TiO2 and FeS2 nanocrystals calculated using the above equation were found to be 3.10 eV and 1.94 eV, respectively. Interestingly, we observed that the TiO2/FeS2 nanocomposite sample band gap energy lies in a range around 2.68 eV. These results are very close to our prediction because the thrust of our study was to reduce the bandgap energy of a TiO2 un-doped system by combining with the FeS2 nanocrystals. Similarly, a polymer solar cell based on P3HT = FeS2NCs was reported21 and the results showed that a combination of polymer (P3HT) and FeS2 can contribute to an extended photovoltaic response in the red light region similar to literature36,37 reports that FeS2 is a narrow bandgap semiconductor (0.95–1.2 eV) showing absorbance across the entire visible region, and presence of sulfur in composite and pure FeS2 is indicated by a tail broadening of the peak.25
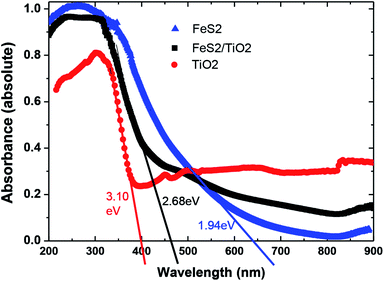 |
| | Fig. 4 UV-Vis absorption spectra of nanocrystals TiO2, FeS2, and composite TiO2/FeS2. | |
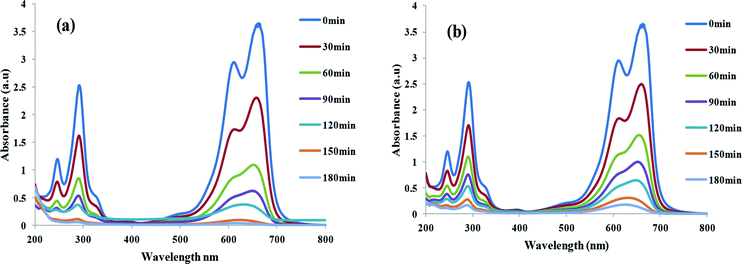 |
| | Fig. 5 UV-Vis spectra of MB degradation in solutions containing TiO2/FeS2 in (a) sunlight and (b) visible light(dye concentration = 25 mg L−1, catalyst dose = 1 g L−1). | |
3.5 Photocatalytic degradation
The complete UV-Vis scanning spectra of a MB solution before (contact time zero) and after addition of TiO2/FeS2 catalyst recorded at regular intervals after direct sunlight and visible light (λ = 390–700 nm) exposure are presented in Fig. 5(a) and (b), respectively. From the UV-visible absorption scans rapid decrease in absorbance peaks can be noticed after addition of the nanocatalyst in both cases indicating high catalyst activity under varied irradiation sources. No new peaks were formed apart from two major peaks at 665 and 275 nm indicating lack of mineralization products and complete degradation of MB after 180 min of exposure. Absorption peaks in the UV region can be ascribed to the presence of aromatic rings such as benzene; naphthalene, etc. while the presence of chromophores containing a long conjugated π system are responsible for absorption in the visible region.38,39 Seemingly straight line spectra achieved after 180 min irradiation in the case of direct sunlight irradiation indicates increased photocatalytic efficiency in natural sunlight more than in visible irradiation attributed to the presence of UV in natural sunlight. Therefore, higher degradation was achieved in case of direct sunlight.40
Comparison of photocatalytic activities of TiO2/FeS2, pristine TiO2, and FeS2 are illustrated in Fig. 6. This experiment was carried out to check catalyst activity of the TiO2/FeS2 nanocomposite and as synthesized TiO2 and FeS2 at pH = 7 and MB concentration of 50 mg L−1 showing degradation of MB is in a decreasing order i.e., TiO2/FeS2 (97.2%) > TiO2 (48.64%) > FeS2 (45%). These results indicate that TiO2/FeS2 has degraded nearly double the amount of MB in 180 min as compared to the individual constituents. This is because FeS2 has a band gap of 1.00 eV; thus, it can be easily excited using visible light. However, decreased photoactivity of pure FeS2 rather than the nanocomposite was due to an elevated electron–hole recombination rate.41 The higher MB degradation by TiO2/FeS2 compared to TiO2 and FeS2 alone was due to efficient electron–hole separation,28 resulting in an increased number of charges participating in the photocatalytic degradation of MB. Another possible reason for enhanced photocatalytic degradation might be an increased oxidation–reduction potential of the composite i.e., TiO2/FeS2.25 The above results confirmed that TiO2/FeS2 exhibited enhanced degradation of MB compared to pristine TiO2 or FeS2; therefore, remaining experiments were conducted using the TiO2/FeS2 nanocomposite under solar light irradiation.
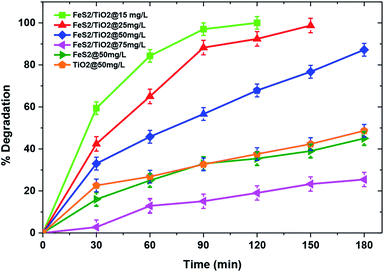 |
| | Fig. 6 Effect of initial dye concentration and catalyst on photocatalytic degradation of MB(pH = 7, catalyst dose = 1 g L−1, light source = sunlight). | |
3.6 Effect of initial dye concentration
The initial pollutant concentration plays a very important role in photocatalytic reactions from both application and mechanistic points of view. Fig. 6 illustrates that complete degradation was achieved for an initial pollutant concentration of 25 mg L−1; however, there was significant decline in the MB degradation to 25.3% with an increase in initial dye concentration to 75 mg L−1 within 180 min of irradiation. This decline in catalytic activity with increasing pollutant concentration in the solution may be attributed to lower transparency of the solution to light with increasing pollutant molecules and a longer path length for light to reach the catalyst's surface which, in turn, triggers lesser photocatalytic reactions.42
3.7 Effect of solution pH
Solution pH is an important parameter that can affect efficiency of the photocatalytic process. Fig. 7 demonstrates the effect of solution pH on degradation of MB over a TiO2/FeS2 nanocomposite. Drastic changes in catalytic activity were observed with solution pH change from normal solution pH of 5 to acidic pH 2 with corresponding degradation of 25 mg L−1 MB from 42.8% at pH 2 to 100% at pH 5 within 180 min of irradiation. Further increases in pH from 5 to 7 and 9 achieved complete degradation at 150 and 120 min, respectively showing increased catalytic activity in alkaline conditions. These results could be explained with the help of point of zero charge of TiO2/FeS2 (pHzpc = 3.8) determined by the salt addition method using 0.1 M KCl.43 Consequently, the surface of the composite is positively charged at pH lower than 3.8 and electrostatic repulsion between the cationic dye molecule and positively charged catalyst surface in acidic pH would result in lower adsorption of the MB dye over the catalyst's surface resulting in lower degradation efficiency. On the contrary, at pH higher than the pHzpc the electrostatic attraction between the dye molecules and negatively charged surface of TiO2/FeS2 results in higher photocatalytic degradation at pH 5. Also, basic conditions favor production of hydroxyl radicals43 which would further increase the catalytic degradation of MB.
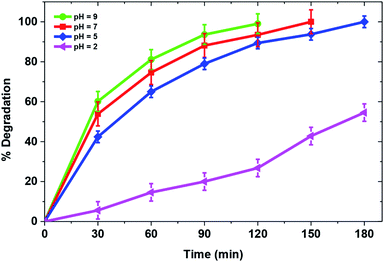 |
| | Fig. 7 Effect of pH on photocatalytic degradation of MB(MB = 25 mg L−1, catalyst = 1 g L−1, light source = sunlight). | |
3.8 Effect of catalyst dose
Another important factor influencing photocatalytic degradation rate is catalyst dose. A set of experiments was carried out to find the optimum catalyst concentration by increasing the TiO2/FeS2 nanocomposite dose from 0.25–1 g L−1 at normal solution pH = 5 and MB concentration of 25 mg L−1. A characteristic behavior observed in heterogeneous photocatalysis is that with an increase in catalyst dose, the degradation percentage is also increased.44 Fig. 8 illustrates a similar pattern for the photocatalytic degradation of MB with increments in catalyst dose from 0.25–1 g L−1 having a maximum of 100% degradation for 25 mg L−1 MB at 1 g L−1 catalyst dose within 120 min while 98.56% and 74.04% degradation efficiency was achieved at 120 min solar irradiation over 0.5 g L−1 and 0.25 g L−1 of TiO2/FeS2, respectively. Increased catalyst dose refers to an increased number of catalyst active sites per unit volume with more available surface area, which leads to the production of more OH− radicals and higher degradation rates.45,46
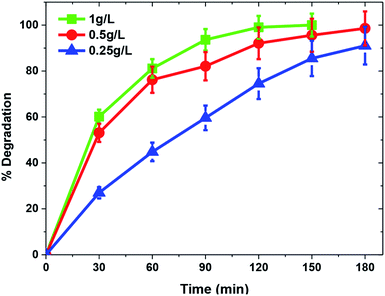 |
| | Fig. 8 Effect of catalyst loading on photocatalytic degradation of MB(MB = 25 mg L−1, pH = 5, light source = sunlight). | |
3.9 Reusability
Catalyst stability is a key factor for large scale applicability of any photocatalyst. To determine the photocatalyst's stability, the TiO2/FeS2 nanocomposite was recovered and used multiple times to degrade fresh MB solutions. After each reuse experiment the catalyst was simply filtered, dried in an oven at 80 °C, and reused without any further modification. Fig. 9 depicts that the TiO2/FeS2 nanocomposite upon reuse retained high catalytic activity (100% to 97.2% and 90.72% by fresh, 2nd use, and 3rd use, respectively) with only about 9% loss in photocatalytic efficiency after the third cycle. This slight decrease in the rate of MB degradation upon reuse may be due to accumulation of organic intermediates, as detected by GCMS on the surface of a catalyst sample, thus affecting the adsorption of pollutant and, in turn, decreasing degradation.47,48 Apart from catalyst agglomeration, photo-dissolution, oxidative decomposition, and photo-corrosion, there are different processes in a photocatalytic reaction that negatively affect the surface of the catalyst, thus reducing its reusability and stability.49
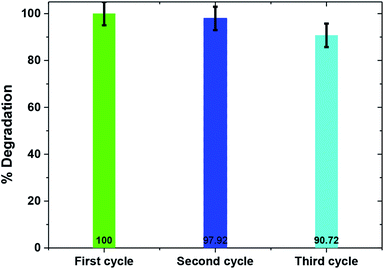 |
| | Fig. 9 Photocatalytic efficiency of TiO2/FeS2 upon recycled application (MB = 25 mg L−1, pH = 5, light source = sunlight). | |
3.10 GCMS analysis
For detailed insight into the degradation mechanism of methylene blue by the TiO2/FeS2 nanocomposite, GCMS analysis was carried out on selective samples under optimized photocatalytic conditions. Based on mass spectra of the intermediate products formed before complete mineralization, it can be proposed that the MB degradation reaction occurs via high-energy electron impact. The MB degradation mechanism is proposed, and their respective mass spectra are shown in Fig. 10(a) and (b). High energy electrons generated as TiO2/FeS2 when irradiated with solar light are able to dissociate the chemical bonds in MB. By far the most susceptible point for electron dissociation is the bond between H3C–N atoms having a bond energy of 3.07 eV.50 The results appear in a successive demethylation reaction pathway leading to MB degradation. Due to degradation of MB, presence of demethylated molecules such as Azure A, Azure B and C, and thionine having mass to charge ratios of 270, 256, and 228, respectively are reported in literature.51,52 In the degradation of MB, the S–Cl bond broke first due to low bond disassociation energy, leading to the detection of Cl− at the beginning of the reaction. The structure of the m/z = 284 ion corresponds to the MB cation which is due to [MB + H]+. Due to bonds broken between S⋯Cl, C⋯SO3H, and C⋯NH2 during degradation of the MB process Cl−, SO42−, and NO3− were detected.53 Phenyl thiophene present in the form of protonated phenyl thiophene having m/z = 138 was also detected in this study.54
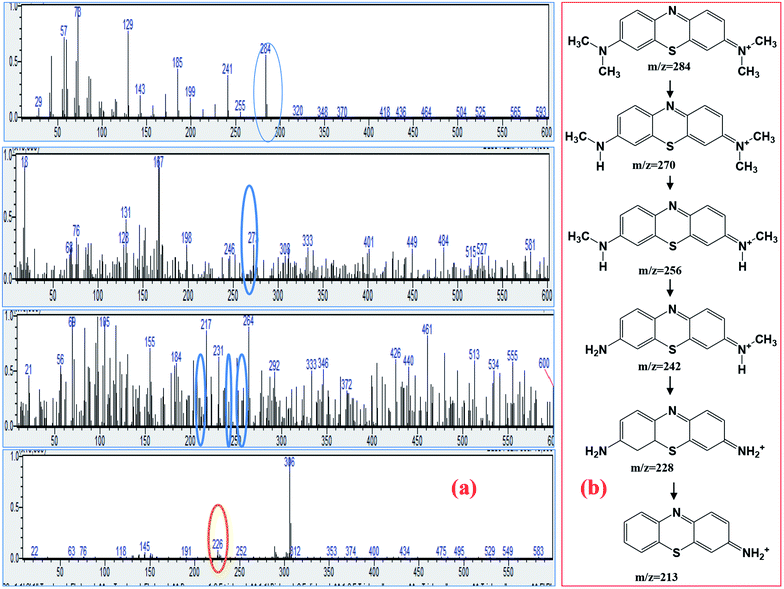 |
| | Fig. 10 (a) Mass spectra of MB solution treated with TiO2/FeS2, (b) possible degradation mechanism of MB based on MS spectra. | |
Langmuir–Hinshelwood kinetics generally fit well with photocatalytic degradation reactions at the solid–liquid interface.55 Kinetic parameters involved in MB degradation were evaluated by fitting this equation to the experimental data. Basic L–H relationship is given in eqn (2).
| |
 | (2) |
where ‘
C0’ represents initial dye concentration, ‘
C’ represents the concentration in solution of MB at time ‘
t’ (min), and
kapp is the rate constant (min
−1). Increase in MB concentration decreased rate constant from 0.0402 to 0.0017 (min
−1) as shown in
Table 1. A similar trend was observed in the case of pH with a maximum rate constant value obtained at pH 9 (
i.e., 0.0408 (min
−1)). However, the rate constant increased with increase in catalyst dose as shown in
Table 1. The kinetic plot between ‘ln(
C0/
C)’ and time ‘
t’ for operational parameters (
i.e., increasing dye concentration, solution pH, and catalyst dose) are shown in
Fig. 11(a)–(c).
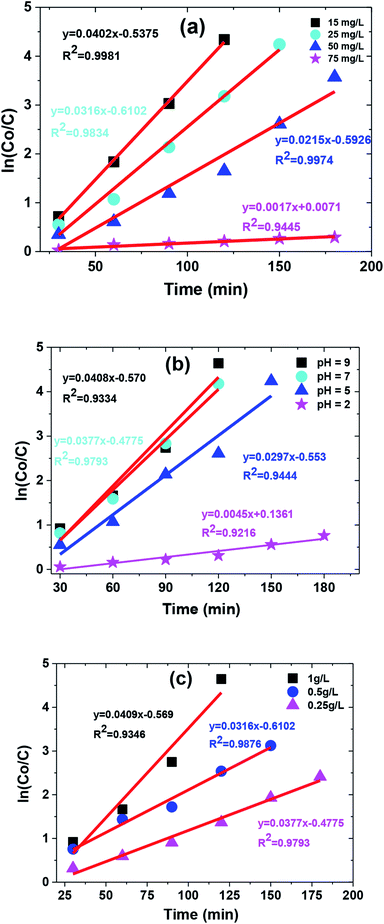 |
| | Fig. 11 The kinetic curve of degradation catalyzed by TiO2/FeS2 under (a) different MB concentration, (b) different pH conditions, and (c) catalyst dose. | |
3.11 Reaction mechanism
Three stages on which complete photocatalytic process is generally reliant are light harvesting, separation of photogenerated charges, and interfacial reactions.50 For an efficient photocatalyst, implementation at each stage is necessary. Here we present the reaction mechanism of TiO2/FeS2 nanocomposite which can efficiently separate photogenerated charge carriers (h+ & e−) due to formation of a heterojunction between TiO2 and FeS2 and satisfied energy level position of TiO2/FeS2 composite versus vacuum energy.28 FeS2 with narrower band gap is easily excited by visible and sunlight, which initiates the generation of photoelectrons and holes. Photoelectrons in the conduction band of FeS2 can be transferred to CB of TiO2, leaving holes in VB of FeS2; as a result, the recombination rate of charge carriers was decreased successfully, and the photocatalytic activity was improved. Meanwhile, the generated VB hole can react with water to form H+ and an OH˙ radical and then superoxide radical anions are generated by reaction of CB electrons with dissolved oxygen molecules, (O2˙) which undergo a series of reactions forming OH˙, ultimately reacting with target pollutant (MB) and forming nonhazardous end product as depicted in eqn (3) through (11).| | |
FeS2 + hν = FeS2 (h+ + e−)
| (3) |
| | |
TiO2/FeS2 (h+ + e−) = FeS2 (h+) + TiO2 (e−)
| (4) |
| | |
FeS2 (h+) + MB = CO2 + H2O (oxidation product)
| (5) |
| | |
TiO2 (e−) + MB = CO2 + H2O (reduction product)
| (6) |
| | |
O2 + TiO2 (e−) = O2˙−
| (7) |
| | |
O2− + FeS2 (h+) = HO2˙
| (8) |
| | |
TiO2 (e−) + HO2˙ = H2O2
| (9) |
| | |
H2O2 + TiO2 (e−) = OH˙ + OH
| (10) |
| | |
OH˙ + MB = CO2 + H2O (degradation product)
| (11) |
4. Conclusions
The aim of this study was to synthesize a solar/visible light active nanocomposite for the degradation of a commonly used hazardous textile dye i.e., MB. A TiO2/FeS2 nanocomposite was synthesized successfully and exhibited good crystallinity. FeS2 nanoparticles were uniformly dispersed on TiO2. The band gap of TiO2 exhibited a red shift after addition of FeS2. The obtained TiO2/FeS2 nanocomposite showed excellent catalytic activity in degradation of MB. Furthermore, a repeatability test showed that TiO2/FeS2 had good stability and reusability. In comparison, TiO2/FeS2 showed a higher catalytic activity than FeS2, thereby proving the advantage of FeS2 addition in the composite showing the highest degradation of MB under both direct sunlight and visible light i.e., 100% and 97.2%, respectively in the case of TiO2/FeS2. The nanocomposite TiO2/FeS2 showed increased degradation of the organic pollutant; which was confirmed by the increased rate of chemical reaction following pseudo first-order reaction kinetics with the highest rate constant value of 0.0408 m−1 and having R2 0.9981.
Conflicts of interest
There are no conflicts to declare.
Acknowledgements
The authors gratefully acknowledge Higher Education Commission Pakistan for funding the research through startup grant program # 21-921/SRGP/R&D/HEC/2016.
References
- M. A. Lazar, S. Varghese and S. S. Nair, Catalysts, 2012, 2, 572–601 CrossRef CAS.
- S. M. Gupta and M. Tripathi, Chin. Sci. Bull., 2011, 56, 1639–1657 CrossRef CAS.
- P. Yang, W. Shi, H. Wang and H. Liu, Braz. J. Microbiol., 2016, 47, 828–834 CrossRef CAS PubMed.
- T. Sreethawong and S. Yoshikawa, Chem. Eng. J., 2012, 197, 272–282 CrossRef CAS.
- Q. Wu, H. Zhang, L. Zhou, C. Bao, H. Zhu and Y. Zhang, J. Taiwan Inst. Chem. Eng., 2016, 67, 484–494 CrossRef CAS.
- K. P. Shinde and P. R. Thorat, Review of Research, 2013, 2, 1–7 CrossRef.
- M. Molaei, E. SaievarIranizad, M. Marandi, N. Taghavinia and R. Amrollahi, Appl. Surf. Sci., 2011, 257, 9796–9801 CrossRef CAS.
- T. M. Wandre, P. N. Gaikwad, A. S. Tapase, K. Garadkar, S. Vanalakar, P. Lokhande, R. P. Sasikala and P. Hankare, J. Mater. Sci.: Mater. Electron., 2016, 27, 825–833 CrossRef.
- S. C. Lee, H. O. Lintang and L. Yuliati, Beilstein J. Nanotechnol., 2017, 8, 915–926 CrossRef CAS PubMed.
- J. Ran, J. Zhang, J. Yu, M. Jaroniec and S. Z. Qiao, Chem. Soc. Rev., 2014, 43, 7787–7812 RSC.
- M. K. Seery, R. George, P. Floris and S. C. Pillai, J. Photochem. Photobiol., A, 2007, 189, 258–263 CrossRef CAS.
- G. C. Collazzo, E. L. Foletto, S. L. Jahn and M. A. Villetti, J. Environ. Manage., 2012, 98, 107–111 CrossRef CAS PubMed.
- H. Liu, T. Lv, C. Zhu and Z. Zhu, Sol. Energy Mater. Sol. Cells, 2016, 153, 1–8 CrossRef CAS.
- L. Yu, D. Wang and D. Ye, Sep. Purif. Technol., 2015, 156, 708–714 CrossRef CAS.
- D. Rajamanickam and M. Shanthi, Toxicol. Environ. Chem., 2013, 95, 1484–1498 CrossRef CAS.
- K. Zhang and L. Guo, Catal. Sci. Technol., 2013, 3, 1672–1690 CAS.
- Y. Li, Y. Hu, S. Peng, G. Lu and S. Li, J. Phys. Chem. C, 2009, 113, 9352–9358 CAS.
- S. Liu, M. Li, S. Li, H. Li and L. Yan, Appl. Surf. Sci., 2013, 268, 213–217 CrossRef CAS.
- J. Puthussery, S. Seefeld, N. Berry, M. Gibbs and M. Law, J. Am. Chem. Soc., 2010, 133, 716–719 CrossRef PubMed.
- M. Wang, C. Xing, K. Cao, L. Zhang, J. Liu and L. Meng, J. Mater. Chem. A, 2014, 2, 9496–9505 CAS.
- Y. Y. Lin, D. Y. Wang, H. C. Yen, H. L. Chen, C. C. Chen, C. M. Chen, C. Y. Tang and C. W. Chen, Nanotechnology, 2009, 20, 405207 CrossRef PubMed.
- H. Siyu, L. Xinyu, L. Q. Yu and C. Jun, J. Alloys Compd., 2009, 472, 9–12 CrossRef.
- A. M. Golsheikh, N. M. Huang, H. N. Lim, C. H. Chia, I. Harrison and M. R. Muhamad, Chem. Eng. J., 2013, 218, 276–284 CrossRef CAS.
- M. J. M. Batista, M. N. G. Cerezo, A. Kubacka, D. Tudela and M. F. García, ACS Catal., 2014, 4, 63–72 CrossRef.
- G. Lee and M. Kang, Curr. Appl. Phys., 2013, 13, 1482–1489 CrossRef.
- I. Tacchini, E. Terrado, A. Anson and M. Martinez, Micro Nano Lett., 2011, 6, 932–936 CAS.
- P. Gao, J. Liu, T. Zhang, D. D. Sun and W. Ng, J. Hazard. Mater., 2012, 229, 209–216 CrossRef PubMed.
- D. Y. Wang, C. H. Li, S. S. Li, T. R. Kuo, C. M. Tsai, T. R. Chen, Y. C. Wang, C. W. Chen and C. C. Chen, Sci. Rep., 2016, 6(20397), 1–7 Search PubMed.
- I. Bedja, Mater. Sci.-Pol., 2011, 29, 171–176 CrossRef CAS.
- Y. Xin, Z. Li, W. Wu, B. Fu and Z. Zhang, ACS Sustainable Chem. Eng., 2016, 4, 6659–6667 CrossRef CAS.
- B. Kilic, S. Turkdogan, A. Astam, O. C. Ozer, M. Asgin, H. Cebeci, D. Urk and S. P. Mucur, Sci. Rep., 2016, 6(27052), 1–9 Search PubMed.
- S. Ding, X. Yin, X. Lu, Y. Wang, F. Huang and D. Wan, ACS Appl. Mater. Interfaces, 2012, 4, 306–311 CAS.
- Y. Bai, J. Yeom, M. Yang, S. H Cha, K. Sun and N. A. Kotov, J. Phys. Chem. C, 2013, 117, 2567–2573 CAS.
- R. K. Rath, S. Subramanian and T. Pradeepy, J. Colloid Interface Sci., 2000, 229, 82–91 CrossRef CAS PubMed.
- K. Kowal, K. W. K. M. Kopaczynska, E. Dworniczek, R. Franiczek, M. Wawrzynska, M. Vargova, M. Zahoran, E. Rakovsky, P. Kus, G. Plesch, A. Plecenik, F. Laffir, S. A. M. Tofail and H. Podbielska, J. Colloid Interface Sci., 2011, 362, 50–57 CrossRef CAS PubMed.
- M. C. Acevedo, M. S. Faber, Y. Tan, R. J. Hamers and S. Jin, Nano Lett., 2012, 12, 1977–1982 CrossRef PubMed.
- W. Li, M. Döblinger, A. Vaneski, A. L. Rogach, F. Jäckel and J. Feldmann, J. Mater. Chem., 2011, 21, 17946–17952 RSC.
- K. Sahel, N. Perol, H. Chermette, C. Bordes, Z. Derriche and C. Guillard, Appl. Catal., B, 2007, 77, 100–109 CrossRef CAS.
- B. Wawrzyniak and A. W. Morawski, Appl. Catal., B, 2006, 62, 150–158 CrossRef CAS.
- J. Sun, L. Qiao, S. Sun and G. Wang, J. Hazard. Mater., 2008, 155, 312–319 CrossRef CAS PubMed.
- R. Rusdi, A. A. Rahman, N. S. Mohamed, N. Kamarudin and N. Kamarulzaman, Powder Technol., 2011, 210, 18–22 CrossRef CAS.
- F. Han, V. S. R. Kambala, M. Srinivasan, D. Rajarathnam and R. Naidu, Appl. Catal., A, 2009, 359, 25–40 CrossRef CAS.
- R. Kumar, M. O. Ansari, N. Parveen, M. Oves, M. Barakat, A. Alshahri, M. Y. Khan and M. H. Cho, RSC Adv., 2016, 6, 111308–111317 RSC.
- T. M. Elmorsi, Y. M. Riyad, Z. H. Mohamed and H. M. H. Abd El Bary, J. Hazard. Mater., 2010, 174, 352–358 CrossRef CAS PubMed.
- P. Bansal and D. Sud, Desalination, 2011, 267, 244–249 CrossRef CAS.
- A. N. Rao, B. Sivasankar and V. Sadasivam, J. Mol. Catal. A: Chem., 2009, 306, 77–81 CrossRef CAS.
- Z. Jin, W. Duan, W. Duan, B. Liu, X. Chen, F. Yang and J. Guo, Appl. Catal., A, 2016, 517, 129–140 CrossRef CAS.
- M. Vautier, C. Guillard and J.-M. Herrmann, J. Catal., 2001, 201, 46–59 CrossRef CAS.
- Q. S. Wu, Y. Feng, G.-Y. Zhang, Y.-Q. Sun, Y.-Y. Xu and D.-Z. Gao, Mater. Res. Bull., 2014, 49, 440–447 CrossRef CAS.
- L. O. B. Benetoli, B. M. Cadorin, V. Z. Baldissarelli, R. Geremias, I. G. de Souza and N. A. Debacher, J. Hazard. Mater., 2012, 237, 55–62 CrossRef PubMed.
- M. A. Rauf, M. A. Meetani, A. Khaleel and A. Ahmed, Chem. Eng. J., 2010, 157, 373–378 CrossRef CAS.
- H. Gnaser, M. R. Savina, W. F. Calaway, C. E. Tripa, I. V. Veryovkin and M. J. Pellin, Int. J. Mass Spectrom., 2005, 245, 61–67 CrossRef CAS.
- F. Huang, L. Chen, H. Wang and Z. Yan, Chem. Eng. J., 2010, 162, 250–256 CrossRef CAS.
- N. G. Asenjo, R. Santamaría, C. Blanco, M. Granda, P. Álvarez and R. Menéndez, Carbon, 2013, 55, 62–69 CrossRef CAS.
- G. Liao, S. Chen, X. Quan, Y. Zhang and H. Zhao, Appl. Catal., B, 2011, 102, 126–131 CrossRef CAS.
|
| This journal is © The Royal Society of Chemistry 2018 |
Click here to see how this site uses Cookies. View our privacy policy here.  Open Access Article
 *a,
Sahar Saleema,
Saif Ullah Awanb,
A. Iqbalc,
Rajeev Kumard,
M. A. Barakatde,
Muhammad Arshadf,
Muhammad Zaheerg,
Mohsin Rafiqueh and
M. Awadi
![[thin space (1/6-em)]](https://www.rsc.org/images/entities/char_2009.gif) 000–12
000–12![[thin space (1/6-em)]](https://www.rsc.org/images/entities/char_2009.gif) 000 lx. The remaining procedure was the same as for visible light studies.
000 lx. The remaining procedure was the same as for visible light studies.


