DOI:
10.1039/C8RA02055H
(Paper)
RSC Adv., 2018,
8, 18723-18733
Adsorption of Cu(II), Zn(II), and Pb(II) from aqueous single and binary metal solutions by regenerated cellulose and sodium alginate chemically modified with polyethyleneimine†
Received
8th March 2018
, Accepted 11th May 2018
First published on 22nd May 2018
Abstract
In this paper, crosslinked cellulose/sodium alginate (SA) was modified with polyethyleneimine (PEI) as an adsorbent (PEI-RCSA) for comparative and competitive adsorption of Cu(II), Zn(II), and Pb(II) in single and binary aqueous solutions. FTIR, SEM, TGA and specific surface area analysis were used to characterize the structural characteristics of PEI-RCSA. The effects of initial pH of solutions, contact time and initial concentration of heavy metal ions on the adsorption capacity of PEI-RCSA were investigated. The experimental results revealed that the removal of metal ions on the PEI-RCSA was a pH-dependent process with the maximum adsorption capacity at the initial solution pH of 5–6. The adsorption kinetics were followed by a pseudo-second-order kinetics model, and the diffusion properties played a significant role in the control of the adsorption kinetics. Meanwhile, adsorption isotherms were successfully described by the Langmuir model in a single aqueous solution system. The maximum adsorption capacities of PEI-RCSA for Cu(II), Zn(II), and Pb(II) in a single system were 177.1, 110.2 and 234.2 mg g−1, respectively. The binary-component system was better described with the Langmuir competitive isotherm model. The removal efficiencies didn't change significantly when three adsorption–desorption experimental cycles were conducted. All the above results indicated that PEI-RCSA has promising applications in the treatment of toxic metal pollution.
1. Introduction
Along with the rapid growth of urbanization and industrialization, heavy metal ions discharging into the environment may have a drastic impact on ecosystems and human health due to their toxicities, bioaccumulation in the food chain and nature of non-biodegradability.1–3 Lead(II), copper(II), and zinc(II) are three common types of heavy metal ions that have been found in industrial wastewater,4 including discharges from metal plating, metal melting, mining activities and battery manufacturing. As heavy metal ions are non-biodegradable, clean-up of contaminated water is rather challenging. To date, various technologies have been developed to sequestrate heavy metal ions from wastewater, such as chemical precipitation,5 solvent extraction, chelating and ion exchange,6 adsorption,7 membrane separation8,9 and electrochemical methods. However, most of these methods could not be used in full-scale applications due to their high operation cost or potential secondary pollution.10 Among them, adsorption is the most effective and technically feasible method for metal removal from aqueous solutions.11,12 A variety of adsorbing materials, such as activated carbon (in granular or powder),13 different types of clays,14 fly ash,15,16 activated sludge, inorganic–organic nanocomposite,17 carbon nanotube,18 graphite oxide,19 cellulose,20 chitosan and the chelating fibers21,22 are widely used as adsorbents in the treatment of contaminated water by heavy metal ions. Among these adsorbing materials, the adsorbent prepared from natural polymer and biopolymer can simultaneously face economic, technical and environmental limitations have attracted more interest from the researchers.
Cellulose and sodium alginate (SA) are both natural polymers and can be characterized by rich sources, excellent biodegradability, biocompatibility and environment friendliness.23,24 It is well known that cellulose has numerous hydroxyl groups (–OH) on the molecular chain, however, unmodified cellulose has a low heavy metal adsorption capacity as well as variable physical stability. As a result, several chemical and physical modifications of cellulose were carried out to investigate the structural strength and efficient adsorption capacity for heavy metal ions.25,26 SA, a natural anionic polysaccharide extracted from brown seaweeds, mainly comprises β-D-mannuronate (M) and α-L-guluronate (G), and both structural units contain carboxyl groups (–COO−).27 The carboxylic groups can bind metal cations through ionic interactions: this mechanism can be used for the ionotropic gelation of SA in the form of metal-alginate (using mainly divalent cations, Ca(II), Ba(II), etc.) for preparing gel beads. In the past few decades, researchers have reported that SA can effectively eliminate heavy metal ions (e.g. Pb(II), Cu(II), and Cd(II)) in aqueous solutions.28 However, SA gel beads with a loose network are limited by the poor stability,29 weak water resistance, and serious thermal degradation.30 Due to these disadvantages of cellulose and SA as a single material used to adsorb heavy metal ions in wastewater, we have an interesting idea to combine these two renewable polyelectrolytes as scaffolds to prepare metal adsorbents with high adsorption capacity and chemical stability. Then, it can be more efficient to graft on the biopolymer backbone new reactive groups that will bring additional reactivity or selectivity: these new reactive groups may increase adsorption capacity, extend the pH range where the adsorbent can bind metal ions, and also change the adsorption mechanism.
Polyethyleneimine (PEI) is well known for its metal-chelation abilities due to the presence of a large number of amine groups on its macromolecular chain.31–35 However, PEI is well soluble in water and it has to be fixated onto insoluble supports like carbon,36 silica,37 polymers,38,39 biomass,40,41 cellulose, etc. to prevent its dissolving during operation in contaminated water.
In this work, we used cellulose and sodium alginate (SA) to obtain a double-network frame, and then functionalized with polyethyleneimine (PEI) through the glutaraldehyde-crosslinking to obtain the composite adsorbent (PEI-RCSA), which possesses high adsorption capacity for heavy metal ions (Cu(II), Zn(II), and Pb(II)) and good chemical stability. The structure and morphology of PEI-RCSA before and after adsorption were characterized with Fourier transform infrared (FTIR) spectroscopy, scanning electron microscopy (SEM) and compared. The kinetics and isotherms of adsorption were detailedly investigated and the mechanism of PEI-RCSA for the removal of heavy metal ions from aqueous solutions was also discussed.
2. Experimental
2.1. Materials and reagents
Native cellulose (cotton linter, α-cellulose ≥95%) was obtained from Hubei Chemical Fiber Co., Ltd. (Xiangfan, Hubei, China). Its viscosity-average molecular weight (Mη) was determined to be 1.07 × 10⁵ by viscometry in cadoxen at 25 °C, according to the Mark–Houwink equation. A branched polyethyleneimine (PEI, average Mw of 70![[thin space (1/6-em)]](https://www.rsc.org/images/entities/char_2009.gif) 000) in 30% (w/v) aqueous solution was purchased from Macklin Biochemical Co., Ltd. (Shanghai, China). Copper(II) nitrate [Cu(NO3)2·3H2O], lead(II) nitrate [Pb(NO3)2], and zinc(II) nitrate [Zn(NO3)2·6H2O] were purchased from Damao Chemical Reagent Factory, Tianjin, China. Sodium alginate (SA), sodium hydrates (NaOH), urea, sodium ethylenediaminetetraacetic (Na2EDTA), glutaraldehyde (GA, 25 wt% solution in water), paraffin oil, Span 80 and other reagents with analytical grade were supplied by Kelong Chemical Reagent Factory (Chengdu, China), and used without further purifications. Deionized water was utilized throughout the experiment.
000) in 30% (w/v) aqueous solution was purchased from Macklin Biochemical Co., Ltd. (Shanghai, China). Copper(II) nitrate [Cu(NO3)2·3H2O], lead(II) nitrate [Pb(NO3)2], and zinc(II) nitrate [Zn(NO3)2·6H2O] were purchased from Damao Chemical Reagent Factory, Tianjin, China. Sodium alginate (SA), sodium hydrates (NaOH), urea, sodium ethylenediaminetetraacetic (Na2EDTA), glutaraldehyde (GA, 25 wt% solution in water), paraffin oil, Span 80 and other reagents with analytical grade were supplied by Kelong Chemical Reagent Factory (Chengdu, China), and used without further purifications. Deionized water was utilized throughout the experiment.
2.2. Preparation of adsorbents and characterization
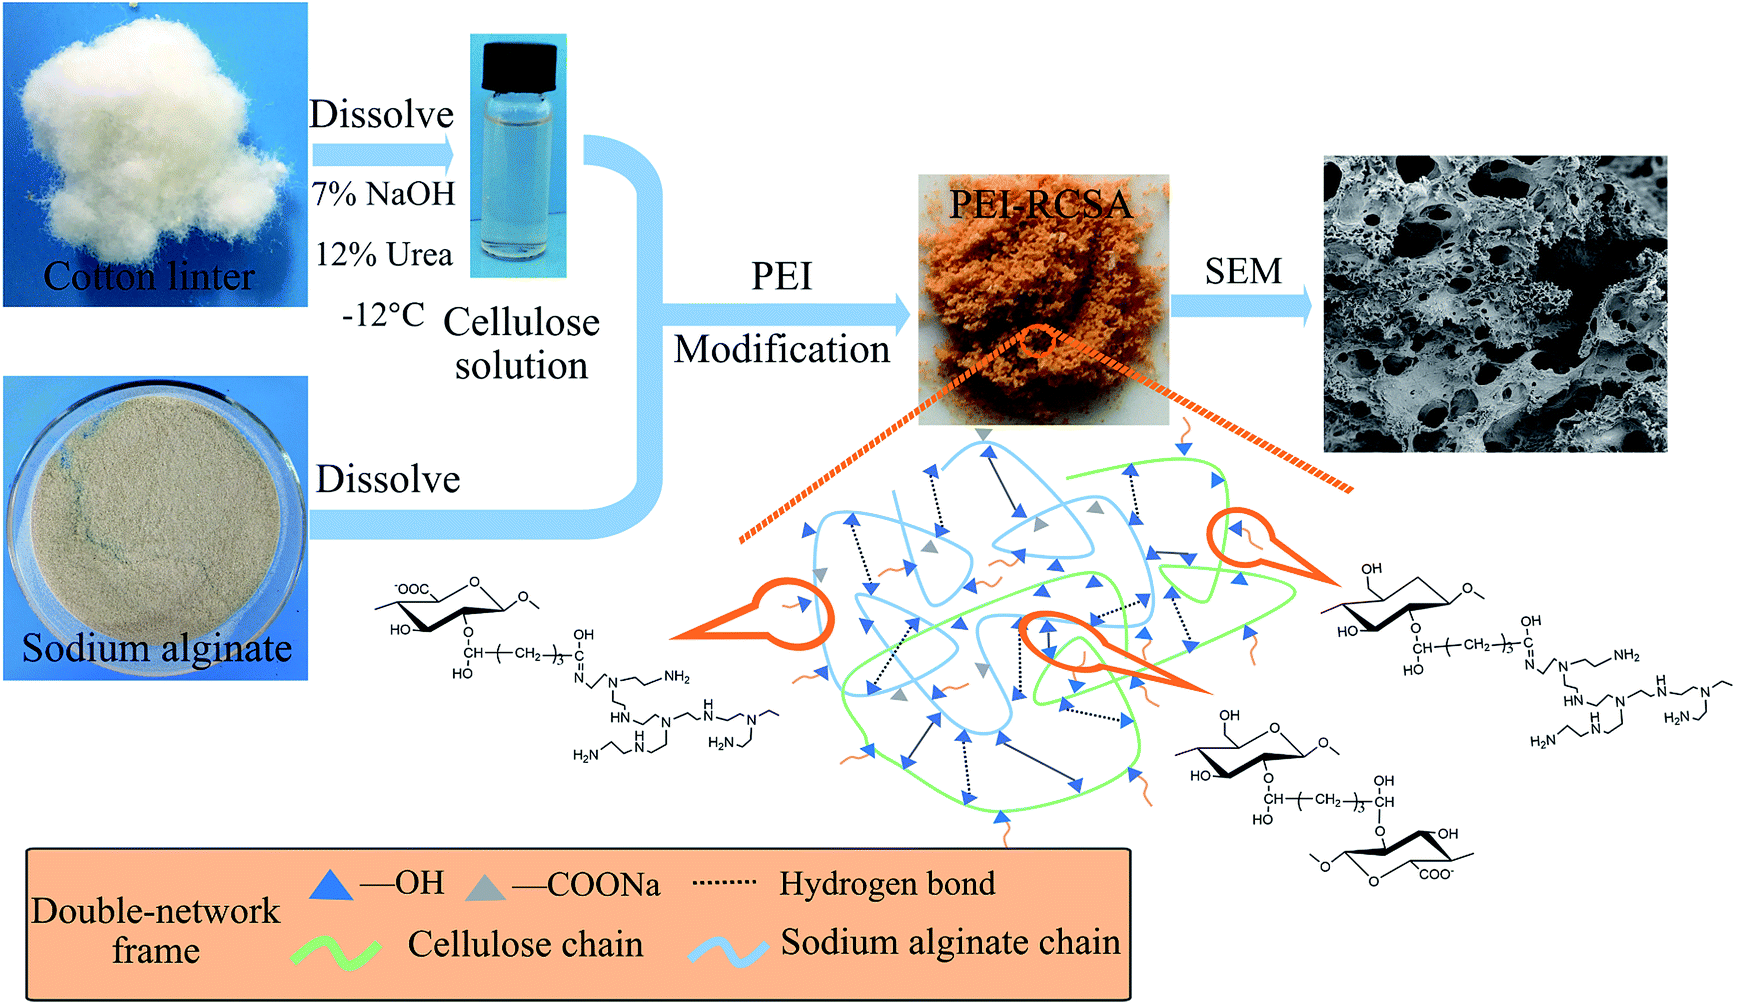
The target composite adsorbents were prepared through a water-in-oil system (see ESI†). Scheme 1 illustrated the synthesis routes, images of PEI-RCSA and possible reaction among cellulose, sodium alginate, glutaraldehyde, and PEI.
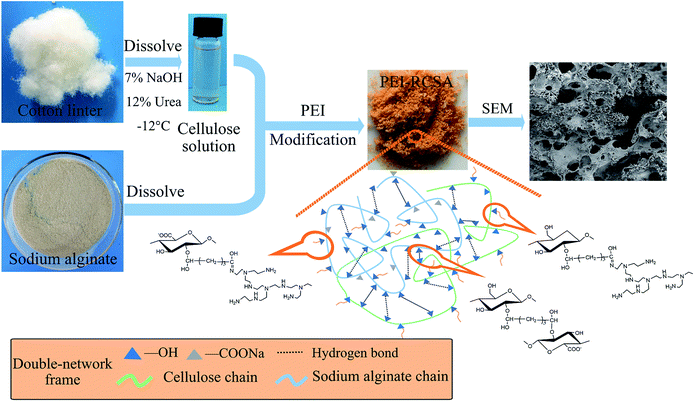 |
| | Scheme 1 Schematic illustration of synthesis routes and images of PEI-RCSA (possible reaction among cellulose, sodium alginate, glutaraldehyde, and PEI). | |
FTIR spectra of PEI-RCSA (before and after Cu(II), Zn(II) and Pb(II) loading, respectively), native cellulose, SA, and PEI were obtained with a Nicolet iS50 FT-IR spectrometer (Thermo Nicolet, USA) using the KBr compression technique. Each spectrum was acquired in transmittance mode by the accumulation of 32 scans through resolutions of 4 cm−1 and the wavenumber was ranged from 600 to 4000 cm−1. Thermo gravimetric analysis (TGA) was carried out under a nitrogen atmosphere flowing (20 mL min−1) at a heating rate 10 °C min−1 using a Netzsch, TG 209 F3 (Germany). The surface morphologies of the raw materials, the obtained adsorbents (PEI-RCSA) before and after the adsorption of heavy metal ions and the samples RC were all visualized using scanning electron microscope (S-3400N, Hitachi, Japan). Meanwhile, EDS characterization of the prepared adsorbent surfaces after the adsorption of Cu(II) was further analyzed using the same S-3400N SEM under an electron beam acceleration voltage of 25.0 kV. The Brunauer–Emmett–Teller (BET) surface area analyzer (TriStar II 3020, Micromeritics Instrument Corporation, USA) was used to determine the specific surface area of PEI-RCSA. Digitized photographs of the products before and after the adsorption of heavy metal ions were taken by a digital camera.
2.3. Adsorption experiments
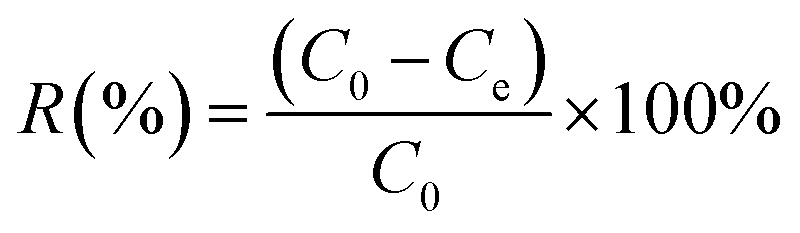
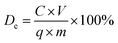
2.3.1. Effect of pH on adsorption. The effect of pH on the removal of Cu(II), Zn(II) or Pb(II) was performed by mixing 1 g L−1 of the as-prepared adsorbent with 50.0 mL of 200 mg L−1 metal solution with the pH range from 2.0 to 6.0 in a 150 mL Erlenmeyer flask. The pH value of the solution was measured by a pH meter (PHS-25, INESA, China). These samples were shaken in a thermostatic shaker at 130 rpm for 8 h at room temperature (i.e., 25 ± 1 °C), then the solutions were filtered and the residual concentration of heavy metal ions in the solution (Ce, mg metal per L) was determined using an Inductively Coupled Plasma Optical Emission Spectrometer (ICP-OES, Optima 8000DV, PerkinElmer, USA). All the experimental data were the average of the triplicate determinations. The equilibrium adsorption capacity (qe, mg g−1) and removal rate (R%) were calculated as follows:| |
 | (1) |
| |
 | (2) |
where C0 and Ce represent the initial and equilibrium metal ion concentrations of Cu(II), Zn(II) or Pb(II) (mg L−1), respectively; V0 is the volume of the solutions used (L) and m is the amount (g) of adsorbents.
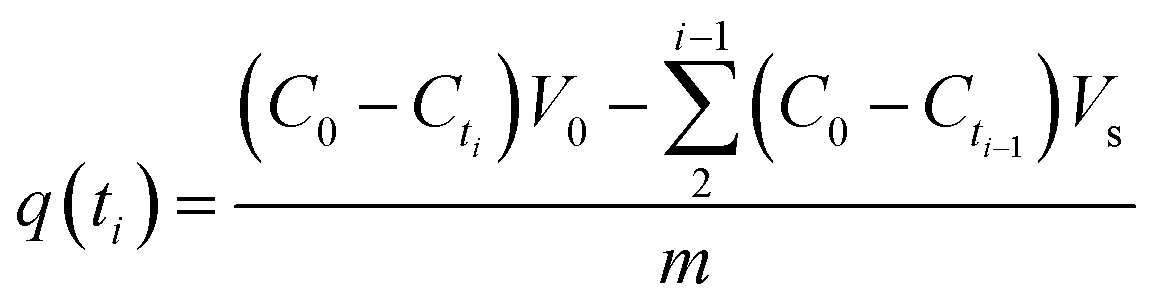
2.3.2. Adsorption kinetics. For the study of adsorption kinetics, the experiments were carried out at pH 5.5 and the other experimental conditions were similar to Section 2.3.1. At desired time intervals, about 1.0 mL of the mixed solution was taken out to analyze the current metal concentrations. Meanwhile, the equivalent volume of the initial Cu(II), Zn(II) and Pb(II) aqueous solution was respectively added into the bulk solution to keep the volume constant. The metal uptake of PEI-RCSA at time ti, q(ti) (mg g−1) was calculated using the following equation:| |
 | (3) |
where C0 and Cti (mg L−1) are the initial concentration of Cu(II), Zn(II) or Pb(II) and the concentration at time ti, respectively. V0 and Vs (L) are the volume of the mixed solution and the sample solution taken out each time for concentration analysis, respectively. In this equation, Vs is equal to 1.0 mL. m (g) represents the mass of the adsorbent.
2.3.3. Adsorption isotherms in single system. To explore the isotherms in single system, the adsorption process was carried out at various initial concentrations ranging from 75 to 1000 mg L−1 at initial pH 5.5. After continuously stirring for 8 h at room temperature, the adsorbents were subsequently filtered to determine Cu(II), Zn(II) and Pb(II) concentration in the filtrate.
2.3.4. Adsorption isotherms in binary system. The Pb(II)–Cu(II), Pb(II)–Zn(II) and Cu(II)–Zn(II) binary aqueous system was prepared by mixing pairs of metal ions with equal initial concentration and the total initial concentrations of the two metal ions were kept in the range of 150 to 1000 mg L−1. After the adsorption process, the solutions were filtered and the residual concentration of heavy metal ions in the solution was quantified.
2.4. Desorption and regeneration experiments
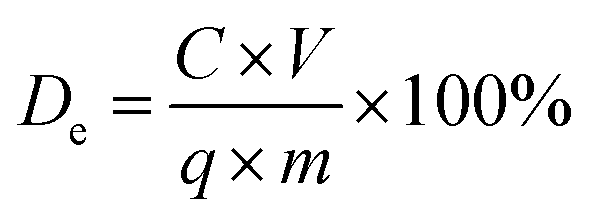
The desorption experiments were performed utilizing 100 mM Na2EDTA solution as the eluent to estimate the reversibility of PEI-RCSA and recovery of Cu(II), Zn(II) and Pb(II) ions. The adsorbent PEI-RCSA was first equilibrated with heavy metal ions in aqueous solutions with an initial concentration of 200 mg L−1 and then put into the desorption solution. Desorption was allowed for a time period up to 8 h under shaking. After the desorption test, the adsorbents were thoroughly washed with deionized water and reused in the next cycle of adsorption experiments. The desorption and regeneration experiments were carried out at room temperature (i.e., 25 ± 1 °C). The desorption efficiency (De) was determined by the following equation:| |
 | (4) |
where C (mg L−1) is the concentration of metal ions in the desorption solution, V is the volume of the desorption solution, q (mg g−1) is the amount of metal ions adsorbed on the adsorbent PEI-RCSA before desorption experiments, and m (g) is the amount of the adsorbent used in the desorption experiments.
3. Results and discussion
3.1. Characterizations of PEI-RCSA
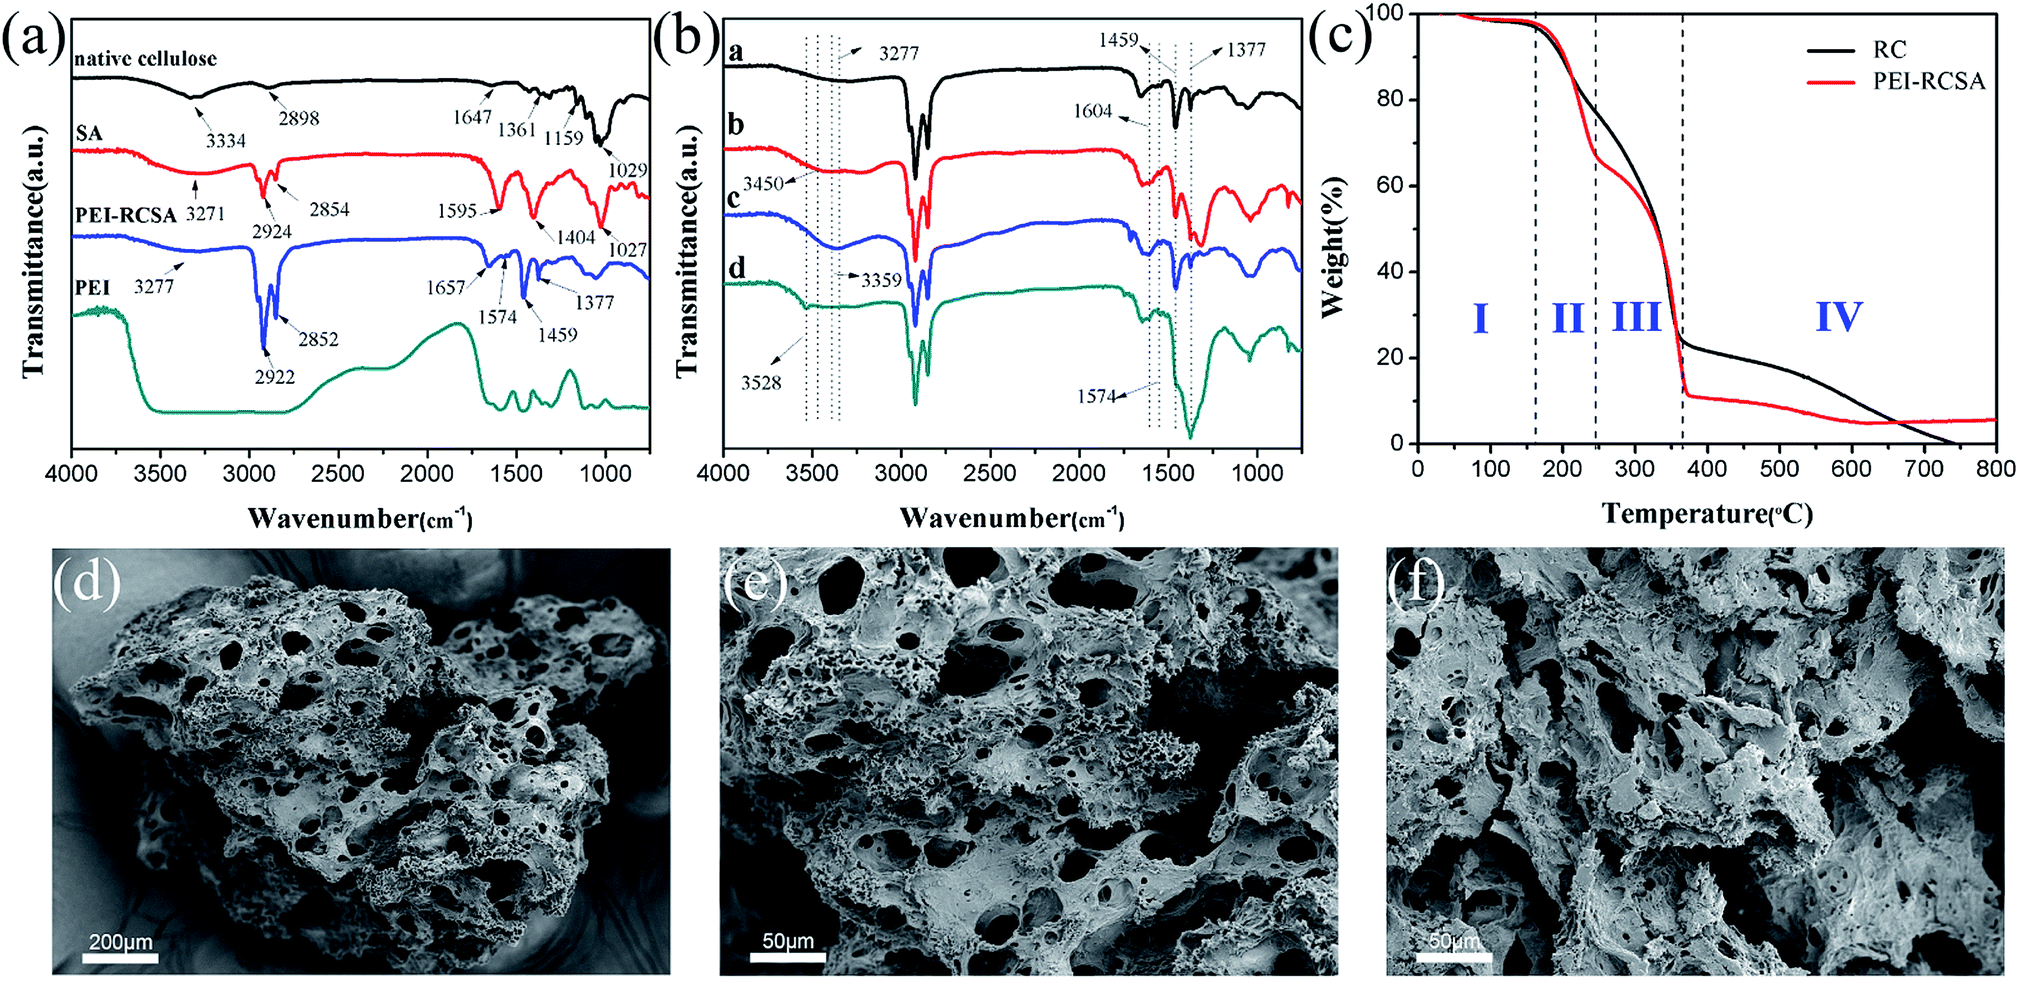
Fig. 1(a)showed the FTIR spectra of native cellulose, SA, PEI-RCSA, and PEI. The broad peaks at 3334 cm−1 and 2898 cm−1 in the spectrum of native cellulose were due to the O–H stretching vibrations (hydroxyl groups of cellulose) and the stretching vibrations of aliphatic C–H, respectively. The band at 1647 cm−1 related to the bending mode of the absorbed water. The peak at 1361 cm−1 was attributed to the C–H bending and the absorption band at 1159 cm−1 corresponded to C–O asymmetric stretching vibration. For the pure SA, we noted a stretching vibration peak of saturated C–H at 2800–3000 cm−1. The bands at 1595 and 1404 cm−1 corresponding to asymmetric and symmetric stretching vibrations of –COO− and a stretching vibration peak of C–O at 1027 cm−1. In the spectrum of PEI-RCSA, the band appeared around 3277 cm−1 was assigned to the overlapped stretching vibration of O–H (hydroxyl groups of cellulose and SA) and N–H (amino groups of PEI). The characteristic absorption band around 1657 cm−1 could be assigned to the absorption peaks of the C![[double bond, length as m-dash]](https://www.rsc.org/images/entities/char_e001.gif) N stretching because the GA was used as the crosslinking agent and the Schiff base was generated. Besides, the vibration absorption at 1459 cm−1 was ascribed to the stretching vibration absorption of C–N–H bond.42 The appearances of these bands clearly demonstrated the macromolecular chains of PEI had been chemically grafted onto the double-network frame. The bands at 1377 cm−1 corresponding to symmetric stretching vibrations of –COO−.
N stretching because the GA was used as the crosslinking agent and the Schiff base was generated. Besides, the vibration absorption at 1459 cm−1 was ascribed to the stretching vibration absorption of C–N–H bond.42 The appearances of these bands clearly demonstrated the macromolecular chains of PEI had been chemically grafted onto the double-network frame. The bands at 1377 cm−1 corresponding to symmetric stretching vibrations of –COO−.
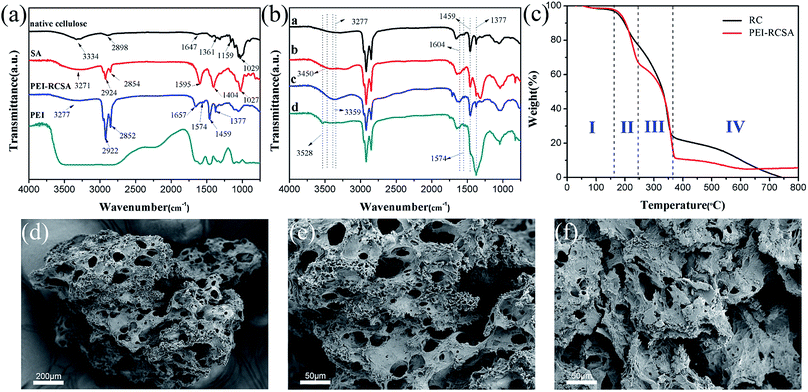 |
| | Fig. 1 (a) FTIR spectra of native cellulose, SA, PEI-RCSA and PEI, (b) a, b, c, and d were FTIR spectra of PEI-RCSA and the PEI-RCSA adsorption of Cu(II), Zn(II) and Pb(II), respectively, (c) TGA thermograms of PEI-RCSA and RC, (d) and (e) SEM images of PEI-RCSA, (f) SEM image of RC. | |
The FTIR spectra of the original and metal-loaded PEI-RCSA were recorded in Fig. 1(b) to identify the different functional groups in PEI-RCSA that were responsible for Cu(II), Zn(II) and Pb(II) adsorption. The increased ionic volume affected the stretching and torsional vibrations of the functional groups, so the adsorption peaks were changed accordingly. Owing to the adsorption of Cu(II), Zn(II) and Pb(II) ions on the PEI-RCSA, the band around 3277 cm−1 generated slight displacements to a higher wavenumber 3450, 3359, 3528 cm−1, respectively. Compared with the spectra of the original PEI-RCSA, the –COO− (1574 cm−1) wavelengths after Cu(II), Zn(II) and Pb(II) adsorption were longer to a certain extent than those before adsorption. Meanwhile, the peak shape of N–H (1459 cm−1) and –COO− (1377 cm−1) were changed after Cu(II), Zn(II) and Pb(II) adsorption, especially for Pb(II). This finding indicated that Pb(II) possessed a higher binding capacity on PEI-RCSA. Hence, Pb(II) showed a competitive advantage on PEI-RCSA over Cu(II) and Zn(II) in the mixed solution. Those analyses indicated that the adsorption could have mainly occurred through the interaction between divalent cations (Cu(II), Zn(II) and Pb(II)) and the O–H, N–H and –COO− groups, and the adsorption behavior was mainly governed by chemical adsorption.
Thermo gravimetric analysis (TGA) thermograms of PEI-RCSA and RC were in agreement with other analysis results. From Fig. 1(c), it was found that the decomposition process of PEI-RCSA included four sections while RC included three sections. The part I exhibited a weight loss of 2.0% below 160 °C was attributed to evaporation of water adsorbed on the surface of the PEI-RCSA, because of the strong hydrogen bond between the amine and imino groups of PEI and water molecules in the ambient air. The main weight loss of both PEI-RCSA and RC occurred at 160–360 °C, while the decomposition of PEI-RCSA had an obvious decline than RC below 250 °C (part II), which resulted from the additional decomposition of the amine groups on the PEI macromolecules chains. When the temperature was increased further (<360 °C), the decomposition of the double-network frame was the main process, and the mass loses of PEI-RCSA and RC was about 55% and 50%, respectively (part III). As the temperature reached beyond around 650 °C, the mass of PEI-RCSA tended to be stable, which indicating the decomposition process was complete.
Morphology and the particle size of the fabricated samples were presented in Fig. 1. As shown in Fig. 1(d), the PEI-RCSA particle size was almost 500 μm, which will be beneficial for recycle and some easy methods (e.g. filtration) can be used to separate them from the aqueous solution,43 and the particles did not show a well-defined shape in the SEM analysis. As shown in Fig. 1(f), the surface of RC exhibited micro- and nano-pore structure. Meanwhile, PEI-RCSA (Fig. 1(e)) had the similar pore structure but obviously had much more pores as compared to precursor RC (Fig. 1(f)), which should be attributed to the surface modification process and the existence of SA. The pore formation was a result of the H2O-induced phase separation during the sol–gel process. The porous structure would allow the adsorption occurring on both exterior and interior of adsorbents, consequently facilitating the metaal ions adsorption but requiring larger contact time for equilibrium and saturation. After the adsorption, the adsorbent remained porous structures due to relatively large pores (see Fig. S1c, ESI†). Meanwhile, EDS results (see Fig. S1d, ESI†) verified the presence of Cu(II) on the adsorbent, suggesting Cu(II) was adsorbed on the adsorbent successfully. Moreover, the disappearing of Na(I) ions implied that the adsorption mechanism included ion exchange.
The results of the BET analysis of PEI-RCSA were shown in Fig. S2 (see ESI†). It can be assigned as a type II isotherm, which was attributed to physical adsorption and also indicating a high affinity between gas and solid.44 The specific surface area of PEI-RCSA was found to be 1.73 m2 g−1. Digitized photographs of the PEI-RCSA before and after the adsorption of Cu(II), Zn(II) and Pb(II), respectively, were shown in Fig. S3 (see ESI†). The color of the adsorbents was obviously changed after the adsorption of heavy metal ions.
Taken together, the characterization results of SEM, FTIR, and TGA confirmed the fabrication of the adsorbent (PEI-RCSA) occurred successfully and the adsorption behavior was subsequently investigated.
3.2. Adsorption study
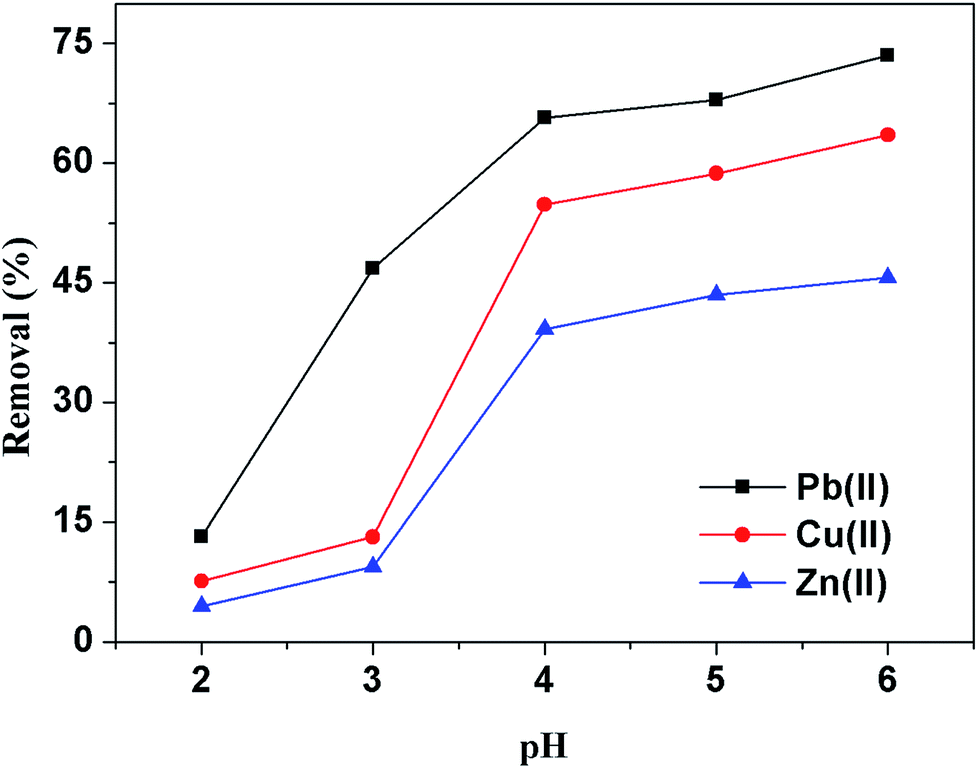
3.2.1. Effect of pH on the adsorption. The pH of the solution had a significant effect on the uptake of metal ions since it may affect several critical criteria such as the speciation of the metal in the solution, the chemical state of reactive groups on the adsorbent (protonation/deprotonation), which, in turn may affect their affinity for target metal ions.45,46 To maximize the removal of heavy metal ions by the adsorbents, knowledge of an optimum pH is important. In order to avoid the formation of any hydroxide precipitation of Cu(II), Zn(II) and Pb(II) to obstruct the adsorption process, the initial solution pH was chosen in the range of 2.0–6.0. Fig. 2 showed the relationship between the initial solution pH and contaminants removal (the pH of the solutions after adsorption were shown in Fig. S4, see ESI†). The results revealed that the adsorption behavior of prepared adsorbent PEI-RCSA with heavy metal ions was strongly pH-dependent. At low pH (i.e., in the range 1.0–2.5) the adsorption efficiency is negligible (below 12%). When the pH increases, the adsorption efficiency significantly increases (especially above pH 3.5). Above pH 4.5, the adsorption efficiency tends to stabilize.
 |
| | Fig. 2 Effect of initial solution pH on the adsorption of Cu(II), Zn(II) and Pb(II) onto prepared adsorbent PEI-RCSA (conditions: 25 ± 1 °C; adsorbent dosage: 1 g L−1; shaking speed: 130 rpm; contact time: 8 h; C0: 200 mg Cu per L, 200 mg Zn per L and 200 mg Pb per L). | |
These results can be explained by the structure of the adsorbent: SA is constituted of guluronic and mannuronic acid units (i.e., carboxylic acid groups), while SA and cellulose grafted with PEI and urea also contained amine groups and imino groups (–NH2 and –NH–). The acid–base properties of reactive groups are obviously affected by their chemical environment. The dissociation constants of the carboxylic groups that constitute alginate biopolymer have been researched: the pKa of carboxylic groups in mannuronic acid units is close to 3.38 while for guluronic acid units the carboxylic groups have a slightly higher pKa (i.e., close to 3.65).47 This means that nearly below 3.5 most of carboxylate groups are protonated and then less reactive groups for the binding of metal ions, while above pH 3.5 the carboxylate groups are more favorable for metal ions binding. Meanwhile, the branched PEI has a large quantity of primary amine with pKa of 6.85 and internal tertiary amine with pKa of 3.86.48,49 At low pH solution, a relatively high concentration of protons would be available to protonate amine and imino groups to form –NH3+ and –NH2+– groups, which will compete strongly with heavy metal ions for amine sites.50 Furthermore, the protonation of amine groups would lead to the strong electrostatic repulsion of the heavy metal ions to be adsorbed. As a result, it became difficult for heavy metal ions to be close to the adsorbent surface and be adsorbed.
As a consequence, at pH below 3.5, only the amine and imino groups are able to bind metal ions (with a possible weak contribution of ion-exchange of protons on carboxylic acids groups with metal ions). However, above pH 3.5 both amine groups, imino groups and carboxylate groups contribute to metal ions uptake. These results are consistent with the sharp increase in the adsorption efficiency at pH above 3.5. The optimum pH for adsorption of target metal ions was found to be in the pH range of 5–6 and all further adsorption experiments were carried out at the initial solution pH of 5.5.
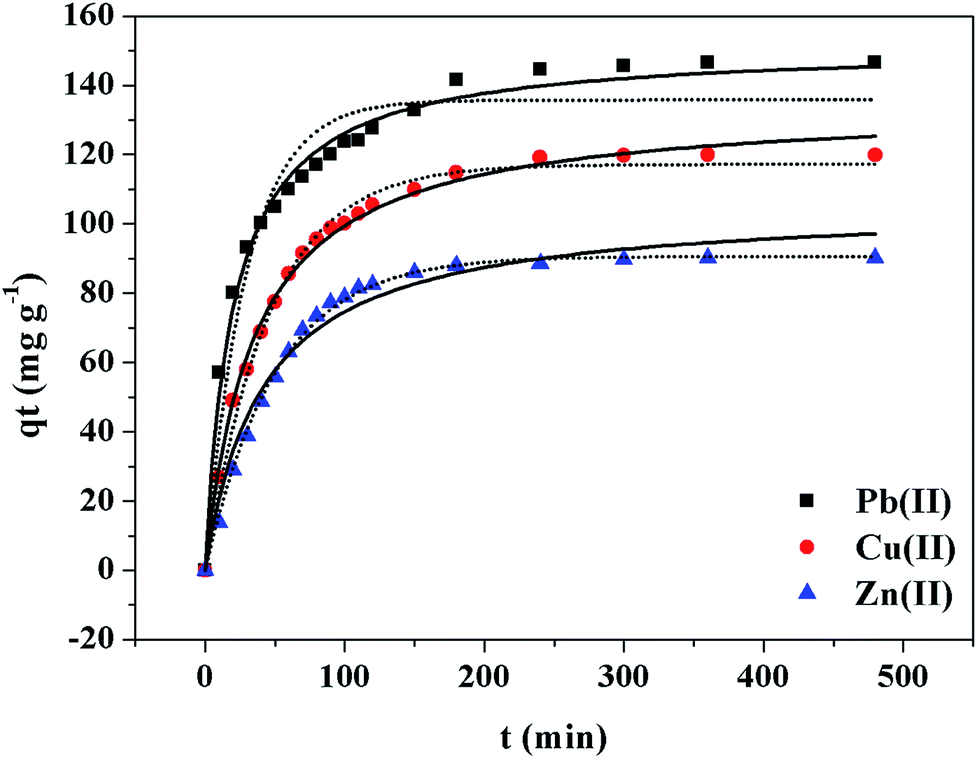
3.2.2. Adsorption kinetics studies. The kinetic profiles (Fig. 3) illustrated the variation in the adsorption capacity trends versus contact time for the prepared aqueous solution. The adsorption equilibrium for both Cu(II), Zn(II) and Pb(II) was achieved within 120 min. The fast-increasing rates were observed at the beginning stage, attributing to the more available adsorption sites of adsorbents at this stage.
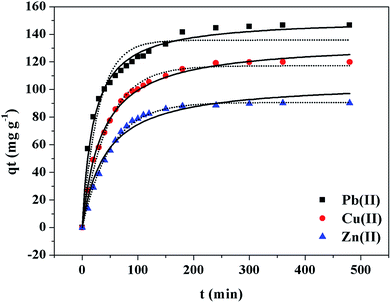 |
| | Fig. 3 Adsorption kinetics of the prepared adsorbent PEI-RCSA for removal of Cu(II), Zn(II) and Pb(II) in their respective single-component aqueous solutions (conditions: 25 ± 1 °C; pH 5.5; adsorbent dosage: 1 g L−1; shaking speed: 130 rpm; C0: 200 mg Cu per L, 200 mg Zn per L and 200 mg Pb per L). Fitted by pseudo-first-order model (····) and pseudo-second-order model (—). | |
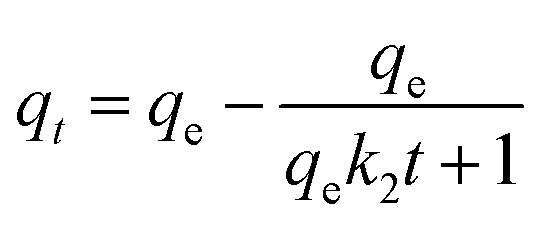
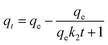
To analyze the adsorption mechanisms further, the pseudo-first-order, the pseudo-second-order,51,52 and intraparticle diffusion kinetic models53,54 were applied to the experimental data. The afore-mentioned kinetics models are presented as eqn (5)–(7), respectively:
| |
 | (6) |
where
qe and
qt (mg g
−1) are the amount of Cu(
II), Zn(
II) or Pb(
II) adsorbed at equilibrium and time
t (min), respectively;
k1 (min
−1) and
k2 (g mg
−1 min
−1) are the rate constant of pseudo-first-order model and pseudo-second-order model, respectively.
where
qt (mg g
−1) is the amount of Cu(
II), Zn(
II) or Pb(
II) absorbed at time
t (min);
Ci is the intercept at different stages;
kpi is the rate constant of intraparticle diffusion at stage
i.
The obtained kinetic parameters and correlation coefficients R2 of metal ions were summarized in Tables 1 and 2. The nonlinear and linear fitting results of the pseudo-first-order and the pseudo-second-order kinetic models were illustrated in Fig. 3 and S5 (see ESI†), respectively. Considering the above results, the pseudo-second-order model gave a better representation of the data than the pseudo-first-order model; and the qe values calculated from the pseudo-second-order model were closer to the experimental data. This meant that the overall rates of the adsorption of PEI-RCSA were controlled by chemical adsorption. Then, it is necessary to analyze the intraparticle diffusion model, which has been widely applied to predict the rate-controlling process and can describe the adsorption process more clearly.53,55 The plots to fit intraparticle diffusion model are shown in Fig. S6.† From the published literature, we know that if the plots cross the origin, then the intraparticle diffusion is the sole rate-controlling process. Otherwise, the rate-controlling process includes other mechanisms. In this work, the plots contained three regions (Phase I, Phase II and Phase III) and did not cross the origin. These results indicated that three steps occur in the adsorption process and the intraparticle diffusion was not the only rate-controlling process in the adsorption process. Phase I corresponded to instantaneous adsorption or external surface adsorption. Phase II was gradual adsorption stage attributable to intraparticle diffusion until the exterior surface reached the saturation. Phase III was the final equilibrium stage where the intraparticle diffusion slowed down due to the extremely low concentration of metal ions in solution. However, the intraparticle diffusion rate constant kp1 for Phase I is higher than that kp2 for the second stage; and C1 is smaller than C2, which indicates the rate of Cu(II), Zn(II) and Pb(II) removal was higher than the second stage. As the data showed, the intraparticle diffusion was the real rate-controlling process of the adsorption process.
Table 1 Kinetic parameters for the pseudo-first-order and pseudo-second-order models for Cu(II), Zn(II) and Pb(II) adsorption onto the prepared adsorbent PEI-RCSA in single system
| Metal ion |
qe,exp (mg g−1) |
Pseudo-first-order |
Pseudo-second-order |
| k1 (min−1) |
qe,cal (mg g−1) |
R2 |
k2 × 104 (g mg−1 min−1) |
qe,cal (mg g−1) |
R2 |
| Cu(II) |
120.0 |
0.0209 |
133.5 |
0.9708 |
2.4417 |
130.6 |
0.9985 |
| Zn(II) |
90.3 |
0.0192 |
86.5 |
0.9786 |
2.7678 |
100.1 |
0.9923 |
| Pb(II) |
146.6 |
0.0155 |
102.8 |
0.9785 |
2.8786 |
154.7 |
0.9990 |
Table 2 Intraparticle diffusion model constants and correlation coefficients (R2) for adsorption of Cu(II), Zn(II) and Pb(II) onto the prepared adsorbent PEI-RCSA in single system
| Metal ion |
kp1 |
C1 |
(R1)2 |
kp2 |
C2 |
(R2)2 |
kp3 |
C3 |
(R3)2 |
| These curves were not fitted with intraparticle diffusion model in a perfect way. |
| Cu(II) |
11.1663 |
−2.5237 |
0.9926 |
4.7420 |
53.3013 |
0.9652 |
0.9337 |
101.7898 |
0.5791a |
| Zn(II) |
8.7976 |
−6.8928 |
0.9710 |
3.1432 |
47.7513 |
0.9648 |
0.3008 |
84.1116 |
0.7868a |
| Pb(II) |
14.3430 |
7.7793 |
0.9613 |
4.9084 |
73.2949 |
0.9827 |
0.5706 |
134.9911 |
0.7361a |
3.2.3. Adsorption isotherm studies.
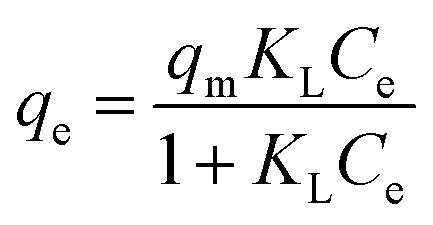
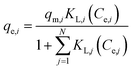
3.2.3.1. Single-component adsorption. Two well-known models of Langmuir and Freundlich isothermal models56,57 were used to analyze the results of the equilibrium isotherms. The Langmuir and Freundlich models are deduced from different theoretic assumptions as follows: the former assumes that the adsorption takes place onto a homogeneous surface of the adsorbent and a monolayer adsorption occurs on the surface, whereas the latter is usually applied in describing heterogeneous systems.58 The equations are expressed as follows:| |
 | (8) |
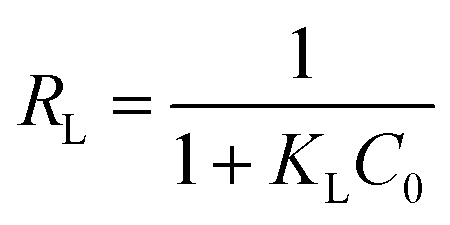
where qe (mg g−1) is the adsorption capacity at equilibrium; Ce (mg L−1) is the equilibrium concentration of metal ions in aqueous solution; qm (mg g−1) is the maximum adsorption capacity; KL (L mg−1) is the Langmuir constant; KF [(mg g−1) (mg L−1)−1/n] is the Freundlich constant, and n (dimensionless) is the heterogeneity factor depicting the adsorption intensity.The Langmuir isotherm model is explained using a dimensionless constant separation factor or equilibrium parameter RL, which can be calculated using the equation:
| |
 | (10) |
where
C0 (mg L
−1) is the initial concentration of metal ions in aqueous solution. The value of
RL suggested whether the adsorption is irreversible (
RL = 0), favorable (0 <
RL < 1), linear (
RL = 1) or unfavorable (
RL > 1).
59
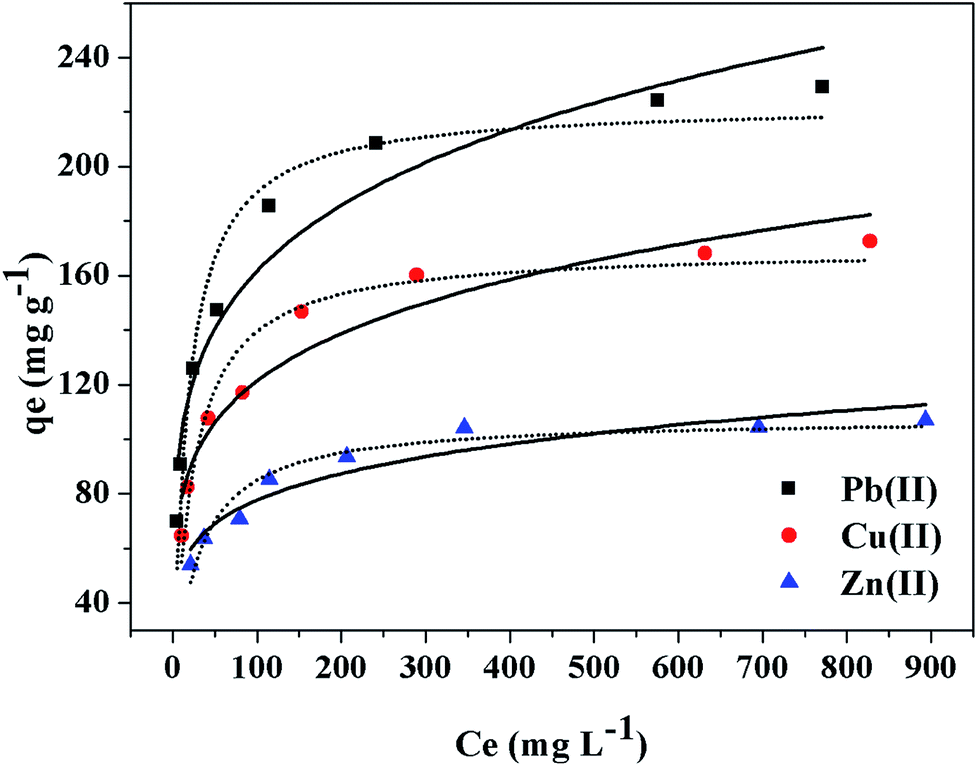
The nonlinear and linear fitting results of Langmuir and Freundlich isothermal models were illustrated in Fig. 4 and S7 (see ESI†), respectively, and the fitting results were presented in Table 3. Fig. 4 illustrates the variation in the equilibrium adsorption capacity trends versus equilibrium metal concentrations. In the beginning, the amount of the metal ions captured increased with Ce increase. Furthermore, both Cu(II) and Pb(II) were almost completely removed by PEI-RCSA when the initial concentrations were lower than 100 mg L−1. This result indicated that, at lower initial metal concentrations, the adsorption sites on PEI-RCSA were sufficient and that the adsorption capacity fully relied on the amount of Cu(II), Zn(II) or Pb(II) transported from the bulk solutions to the adsorbent surfaces. Meanwhile, at higher initial metal concentrations, the adsorption sites on the PEI-RCSA surfaces were saturated, and the adsorption of metal ions ultimately attained an equilibrium value. The maximum adsorption capacities of the materials can be ranked according to the series: Pb(II) > Cu(II) > Zn(II). The results indicated that the adsorption capacity for Pb(II) was higher than that of Cu(II) and Zn(II) as Pb(II) could bind with more varieties of functional groups. Differences in metal adsorption are due to the chemical structure of each metal (i.e., the ionic radius, the electronegativity and the hydration properties of the metal ions), and the intrinsic properties of the adsorbent (i.e., type of reactive groups).
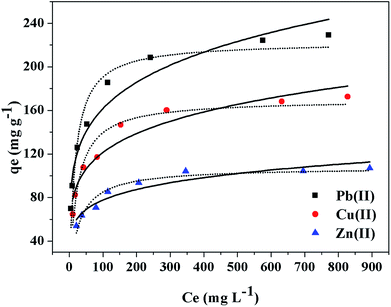 |
| | Fig. 4 Adsorption isotherms of the prepared adsorbent PEI-RCSA for removal of Cu(II), Zn(II) and Pb(II) in their respective single-component aqueous solutions (conditions: 25 ± 1 °C; pH 5.5; adsorbent dosage: 1 g L−1; contact time: 8 h; shaking speed: 130 rpm). Simulation by Langmuir model (····) and Freundlich model (—). | |
Table 3 Fitting parameters of the Langmuir and Freundlich equations for Cu(II), Zn(II) and Pb(II) adsorption onto the prepared adsorbent PEI-RCSA in single system
| Isotherm model |
Metal ion |
| Cu(II) |
Zn(II) |
Pb(II) |
| Experimental |
qm,exp (mg g−1) |
172.5 |
106.9 |
229.1 |
| Langmuir |
qm,cal (mg g−1) |
177.1 |
110.2 |
234.2 |
| KL (L mg−1) |
0.0355 |
0.0323 |
0.0442 |
| R2 |
0.9992 |
0.9993 |
0.9993 |
| RL |
0.0274–0.2731 |
0.0301–0.2925 |
0.0221–0.2317 |
| Freundlich |
KF |
43.8595 |
32.6922 |
54.7670 |
| n |
4.5910 |
5.4015 |
4.3018 |
| R2 |
0.9340 |
0.9261 |
0.9412 |
As the value of the correlation coefficients R2 of the three heavy metal ions from the Langmuir and Freundlich equations were both high, with those of the Langmuir equation was slightly higher (Table 3), we indicated that the Langmuir and Freundlich mechanisms may be both involved in the metal adsorption process, and the Langmuir equation gave a better fit to the experimental data than the Freundlich equation. As mentioned earlier, both Cu(II), Zn(II) and Pb(II) were mainly adsorbed via ions-exchange and ligands with the type of reactive groups (i.e., carboxylic acid groups, amine groups and imino groups) on the adsorbents. Thus, on one hand, the PEI-RCSA adsorption of metal ions was monolayer and partially followed the Langmuir model; on the other hand, the various reactive groups obviously bear different activity and adsorption energy levels, thus resulting in a heterogeneous surface of the adsorbent that followed the Freundlich adsorption mechanism. Summarily, it could be considered as chemisorption of Cu(II), Zn(II) and Pb(II) on PEI-RCSA with a monolayer heterogeneous process.
The values of RL adsorption of both Cu(II), Zn(II) and Pb(II) were less than 1 and greater than 0, meanwhile, the n values from Freundlich equations were in the range of n > 1, indicating all metal ions were favorable for adsorption by PEI-RCSA. Furthermore, the RL values of the adsorbent can be ranked according to the series: Pb(II) < Cu(II) < Zn(II), implying that the adsorption of Pb(II) was more favorable than the other two types of metal ions. These results could be anticipated for competitive adsorption from binary-component solutions. The maximum adsorption capacities of PEI-RCSA were compared with some other various adsorbents summarized in Table 4. Obviously, the adsorption capacities of PEI-RCSA were higher than most other adsorbents with good adsorption capacity.
Table 4 Comparison of adsorption properties of various adsorbents for the removal of Cu(II), Zn(II) and Pb(II) from the aqueous solution
| Materials |
Adsorption capacity (mg g−1) |
| Cu(II) |
Zn(II) |
Pb(II) |
References |
| Chitosan–cellulose beads |
53.2 |
— |
— |
58 |
| Glycidyl methacrylate–cellulose |
70.4 |
— |
84.9 |
20 |
| PGMA |
69.6 |
— |
52.0 |
60 |
| Pyromellitic dianhydride modified SCB |
77.4 |
65.0 |
219.6 |
61 |
| SiO2-G2 |
— |
— |
165.8 |
48 |
| Triethylenetetramine functionalized cellulose acetate–manganese dioxide composite |
— |
— |
196.8 |
62 |
| Alginate beads |
95.3 |
— |
— |
63 |
| Magnetic chitosan/cellulose microspheres |
— |
— |
45.9 |
64 |
| TEPA modified chitosan/CoFe2O4 |
168.1 |
— |
228.3 |
65 |
| Fe3O4/CS NPs |
— |
— |
79.2 |
66 |
| CSTEC |
95.2 |
— |
144.9 |
67 |
| CA/TiO2 |
23.0 |
— |
25.0 |
68 |
| PEI-RCSA |
177.1 |
110.2 |
234.2 |
This work |
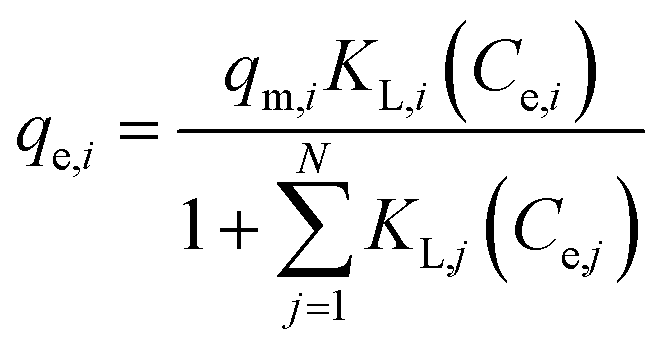
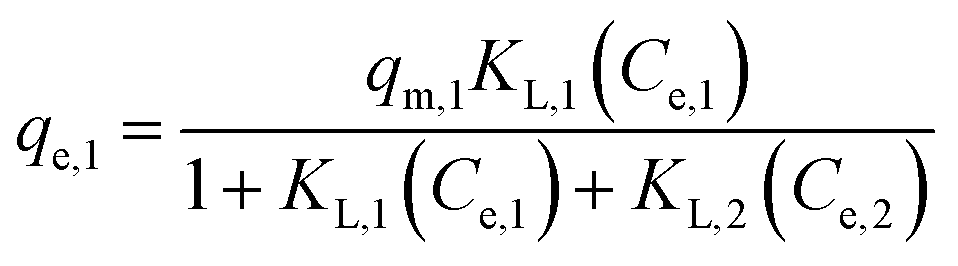
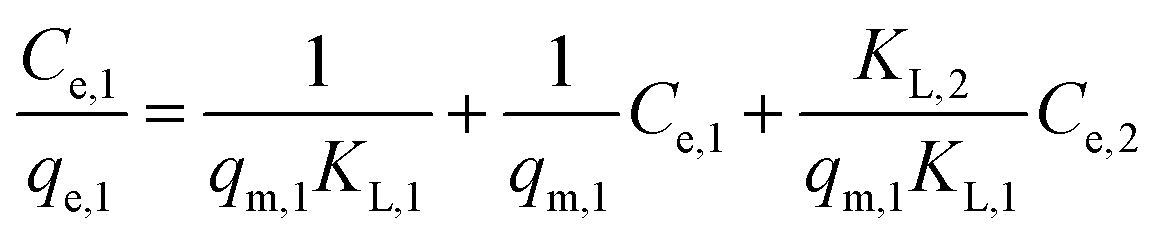
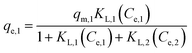
3.2.3.2. Binary-component adsorption. The Langmuir model for single-component adsorption is represented mathematically as eqn (8). This model can not only use for prediction of single metal adsorption but also for multi-metals adsorption.69 In this research work, the binary-component adsorption systems, consisting of Pb(II)–Cu(II), Pb(II)–Zn(II) and Cu(II)–Zn(II), were studied and the results were fitted with Langmuir competitive model. Langmuir competitive isotherm can be modified to multi-metals isotherm by introducing some interaction factors as follow:| |
 | (11) |
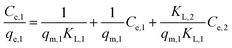
where, qe,i (mg g−1) is the equilibrium adsorption capacity for i metal ions (first metal ions), Ce,i (mg L−1) is equilibrium concentrations, KL,i is Langmuir isotherm parameter and qm,i (mg g−1) is maximum adsorption capacity, N is the number of metals in the solution.With a binary solution of metal ions (i, j = 1 or 2, N = 2), the eqn (11) could be rearranged into the following forms (for metal ion 1, as an example):
| |
 | (12) |
| |
 | (13) |
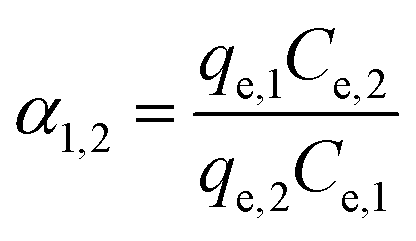
The separation factor (α1,2), eqn (14), is calculated for defining the possible preference of the adsorbent for a given metal in a mixture of metal ions. If α1,2 > 1, metal ion 1 is preferred, alternatively, metal ion 2 is preferred.
| |
 | (14) |
The adsorption data were fitted by Langmuir competitive model, as shown in Fig. S8.† The adsorption parameters of binary adsorptions of Pb(II)–Cu(II), Pb(II)–Zn(II) and Cu(II)–Zn(II) were shown in Table 5. The results indicated that the presence of one metal species lowered the adsorption capacity of the other. The correlation coefficients R2 was used to evaluate the validity of Langmuir competitive model and the results indicated the Langmuir competitive model had the best fitting to the experimental adsorption data for Pb(II) (Pb(II)–Cu(II)), Cu(II) (Pb(II)–Cu(II)), Pb(II) (Pb(II)–Zn(II)), Zn(II) (Pb(II)–Zn(II)), Cu(II) (Cu(II)–Zn(II)) and Zn(II) (Cu(II)–Zn(II)). The separation factor (α1,2) in Table 5 showed the preference of the adsorbent PEI-RCSA for a given metal ion in a binary-component system can be ranked according to the series: Pb(II) > Cu(II) > Zn(II). This order was same as the maximum adsorption capacities of PEI-RCSA in single-component adsorption in Section 3.2.3.1. In this system, the adsorption mechanism was mainly associated with complexation reaction, ion exchange and electrostatic interaction based on the association of both amine groups on PEI and carboxyl groups on SA (see Fig. S9, ESI†). Subsequently, the adsorption affinity order was matched with Pauling's electronegativity order, which are Cu (1.90), Zn (1.65) and Pb (2.33)70and reverse order of hydrated radius, Cu (4.19 Å), Zn (4.30 Å) and Pb (4.01 Å).71 The data indicated that higher electronegativity and smaller hydrated radius ensured a more favorable adsorption through surface complexation or adsorption reactions.
Table 5 Binary adsorption parameters from Langmuir competitive model of Pb(II)–Cu(II), Pb(II)–Zn(II) and Cu(II)–Zn(II)
| Pb(II)–Cu(II) |
Pb(II)–Zn(II) |
Cu(II)–Zn(II) |
| For Pb(II): |
For Pb(II): |
For Cu(II): |
| qm,Pb = 167.6 mg g−1 |
qm,Pb = 140.1 mg g−1 |
qm,Cu = 291.8 mg g−1 |
| KL,Pb = 0.0757 |
KL,Pb = 0.0512 |
KL,Cu = 0.1257 |
| KL,Cu = 0.0033 |
KL,Zn = −0.0044 |
KL,Zn = 0.1214 |
| R2 = 0.9995 |
R2 = 0.9996 |
R2 = 0.9961 |
| For Cu(II): |
For Zn(II): |
For Zn(II): |
| qm,Cu = 95.4 mg g−1 |
qm,Zn = 50.9 mg g−1 |
qm,Zn = 43.9 mg g−1 |
| KL,Pb = 0.0198 |
KL,Pb = −0.0094 |
KL,Cu = −0.0461 |
| KL,Cu = 0.0100 |
KL,Zn = 0.0117 |
KL,Zn = 0.0215 |
| R2 = 0.9963 |
R2 = 0.9849 |
R2 = 0.9720 |
| αPb,Cu = 2.89–12.76 |
αPb,Zn = 3.86–18.43 |
αCu,Zn = 3.04–9.35 |
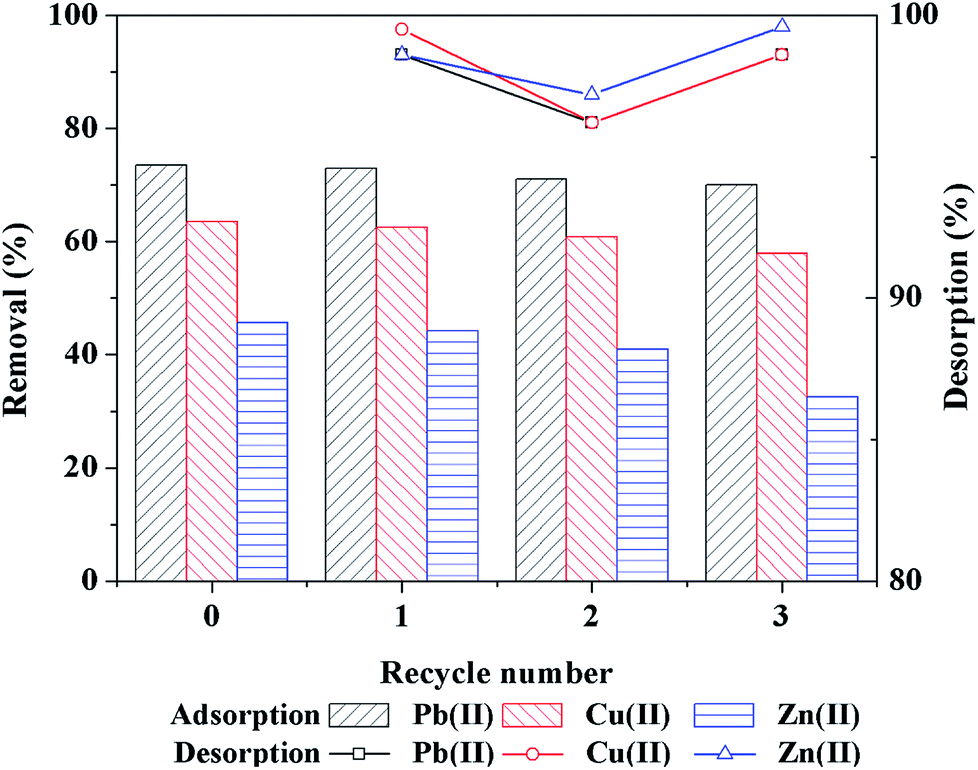
3.2.4. Desorption and regeneration experiments. The recyclability of the adsorbent is an important factor for its potential practical application. Generally, the desorption of metal ions from used adsorbents was carried out using large amounts of eluent (e.g. acidic solutions). In this research work, considering the intrinsic properties of the reactive groups on the adsorbent (i.e., the stability of Schiff base) and the strong chelating property of EDTA reported in the previous research, 100 mM Na2EDTA was chosen to regenerate the used PEI-RCSA with desorption time of 8 h each time. As shown in Fig. 5, after three desorption cycles, the adsorption performance of the PEI-RCSA toward Cu(II), Zn(II) and Pb(II) decreased slightly (i.e., 63.5% to 57.9%, 45.6% to 32.5% and 73.5% to 70.0%, respectively); and the desorption efficiency for Cu(II), Zn(II) and Pb(II) were all extremely high for each cycle (i.e., 96.2% to 99.5%, 97.2% to 99.6% and 97.6% to 98.6%, respectively). The significance comparisons were shown in Fig. S10 (see ESI†). These results demonstrated that PEI-RCSA can be regenerated successfully in 100 mM Na2EDTA aqueous solution without significantly affecting its adsorption efficiency of Cu(II), Zn(II) and Pb(II) for at least three cycles, which shows the excellent reusability and stability of the adsorbent and the potential application in a variety of environmental and chemical fields.
 |
| | Fig. 5 Adsorption–desorption cycles of the prepared adsorbent PEI-RCSA for removal of Cu(II), Zn(II) and Pb(II) in their respective single-component aqueous solutions (adsorption conditions: 25 ± 1 °C; pH 5.5; adsorbent dosage: 1 g L−1; shaking speed: 130 rpm; contact time: 8 h; C0: 200 mg Cu per L, 200 mg Zn per L and 200 mg Pb per L. Desorption conditions: 25 ± 1 °C, stripping solution: 100 mM Na2EDTA aqueous solution; adsorbent dosage: 1 g L−1; shaking speed: 130 rpm; stripping time: 8 h). | |
4. Conclusions
In this research work, the native cellulose and SA were combined as the double-network frame and successfully modified with a branched polymer PEI through the crosslinking reaction by glutaraldehyde to develop a novel adsorbent system, PEI-RCSA, for water remediation. This novel functional composite adsorbent was synthesized, characterized, and applied in the removal of Cu(II), Zn(II) and Pb(II) in the aqueous solution, and its adsorption isotherm could be described well by the Langmuir isotherm model, indicating that the main adsorption of Cu(II), Zn(II) and Pb(II) onto PEI-RCSA was monolayer adsorption. The maximum adsorption capacities of Cu(II), Zn(II) and Pb(II) in single system were 177.1, 110.2 and 234.2 mg g−1, respectively. Kinetic studies demonstrated that the pseudo-second-order model was appropriate to describe the adsorption process in single system, and the intraparticle diffusion was not the sole rate-controlling process. The solution pH had a significant influence on the adsorption processes as lower pH value (especially under pH 3.5) of the solutions led to a significant decrease in adsorption. For the binary system, the adsorption isotherms were better described by Langmuir competitive model. The PEI-RCSA revealed superior adsorption capacity toward Cu(II), Zn(II) and Pb(II), which can be attributed to the presence of large amounts of amino and carboxylic groups on the surface of adsorbent and the porous structures. Furthermore, the adsorption–desorption cycle results demonstrated the PEI-RCSA could be regenerated successfully in suitable solutions. In summary, this adsorbent would be an effective material for the control of toxic metal pollution in water, which has lots of advantages, such as low cost, high efficiency, convenient recovery from water, and environmental friendliness.
Conflicts of interest
There are no conflicts to declare.
Acknowledgements
This work was financially supported by the National Natural Science Foundation of China (Grant No. 51263001) and the Project Sponsored by the Scientific Research Foundation of Guangxi University (Grant No. XTZ140787).
References
- P. O. Boamah, Y. Huang, M. Hua, Q. Zhang, J. Wu, J. Onumah, L. K. Sam-Amoah and P. O. Boamah, Ecotoxicol. Environ. Saf., 2015, 116, 113–120 CrossRef PubMed.
- F. Fu and Q. Wang, J. Environ. Manage., 2011, 92, 407–418 CrossRef PubMed.
- M. Salman, M. Athar and U. Farooq, Rev. Environ. Sci. Bio/Technol., 2015, 14, 211–228 CrossRef.
- W. S. Wan Ngah and M. A. K. M. Hanafiah, Bioresour. Technol., 2008, 99, 3935–3948 CrossRef PubMed.
- F. Fu, L. Xie, B. Tang, Q. Wang and S. Jiang, Chem. Eng. J., 2012, 189–190, 283–287 CrossRef.
- T. Chen, F. Liu, C. Ling, J. Gao, C. Xu, L. Li and A. Li, Environ. Sci. Technol., 2013, 47, 13652–13660 CrossRef PubMed.
- I. H. Chowdhury, A. H. Chowdhury, P. Bose, S. Mandal and M. K. Naskar, RSC Adv., 2016, 6, 6038–6047 RSC.
- A. Maher, M. Sadeghi and A. Moheb, Desalination, 2014, 352, 166–173 CrossRef.
- P. Otrembska and J. Gega, Sep. Sci. Technol., 2016, 51, 2675–2680 CrossRef.
- Y. Xiao, H. Liang, W. Chen and Z. Wang, Appl. Surf. Sci., 2013, 285, 498–504 CrossRef.
- N. Zhang, G.-L. Zang, C. Shi, H.-Q. Yu and G.-P. Sheng, J. Hazard. Mater., 2016, 316, 11–18 CrossRef PubMed.
- F. Zhuang, R. Tan, W. Shen, X. Zhang, W. Xu and W. Song, J. Alloys Compd., 2015, 637, 531–537 CrossRef.
- E. Ayranci and O. Duman, Sep. Sci. Technol., 2009, 44, 3735–3752 CrossRef.
- T. B. Musso, M. E. Parolo, G. Pettinari and F. M. Francisca, J. Environ. Manage., 2014, 146, 50–58 CrossRef PubMed.
- J. Febrianto, A. N. Kosasih, J. Sunarso, Y.-H. Ju, N. Indraswati and S. Ismadji, J. Hazard. Mater., 2009, 162, 616–645 CrossRef PubMed.
- T. A. H. Nguyen, H. H. Ngo, W. S. Guo, J. Zhang, S. Liang, Q. Y. Yue, Q. Li and T. V. Nguyen, Bioresour. Technol., 2013, 148, 574–585 CrossRef PubMed.
- O. Duman, S. Tunç, T. G. Polat and B. K. Bozoğlan, Carbohydr. Polym., 2016, 147, 79–88 CrossRef PubMed.
- M. A. Tofighy and T. Mohammadi, Mater. Res. Bull., 2015, 68, 54–59 CrossRef.
- X. Luo, C. Wang, S. Luo, R. Dong, X. Tu and G. Zeng, Chem. Eng. J., 2012, 187, 45–52 CrossRef.
- S. Hokkanen, A. Bhatnagar and M. Sillanpää, Water Res., 2016, 91, 156–173 CrossRef PubMed.
- J. Wang, L. Xu, C. Cheng, Y. Meng and A. Li, Chem. Eng. J., 2012, 193–194, 31–38 CrossRef.
- S. Kagaya, H. Miyazaki, Y. Inoue, T. Kato, H. Yanai, W. Kamichatani, T. Kajiwara, M. Saito and K. Tohda, J. Hazard. Mater., 2012, 203–204, 370–373 CrossRef PubMed.
- A. V. Reis, A. R. Fajardo, I. T. A. Schuquel, M. R. Guilherme, G. J. Vidotti, A. F. Rubira and E. C. Muniz, J. Org. Chem., 2009, 74, 3750–3757 CrossRef PubMed.
- H. Ullah, F. Wahid, H. A. Santos and T. Khan, Carbohydr. Polym., 2016, 150, 330–352 CrossRef PubMed.
- R. Batmaz, N. Mohammed, M. Zaman, G. Minhas, R. M. Berry and K. C. Tam, Cellulose, 2014, 21, 1655–1665 CrossRef.
- Y. Tian, M. Wu, R. Liu, Y. Li, D. Wang, J. Tan, R. Wu and Y. Huang, Carbohydr. Polym., 2011, 83, 743–748 CrossRef.
- B. Sibaja, E. Culbertson, P. Marshall, R. Boy, R. M. Broughton, A. A. Solano, M. Esquivel, J. Parker, L. D. L. Fuente and M. L. Auad, Carbohydr. Polym., 2015, 134, 598–608 CrossRef PubMed.
- Y. Kuang, J. Du, R. Zhou, Z. Chen, M. Megharaj and R. Naidu, J. Colloid Interface Sci., 2015, 447, 85–91 CrossRef PubMed.
- Y. Liu, X. Hu, H. Wang, A. Chen, S. Liu, Y. Guo, Y. He, X. Hu, J. Li, S. Liu, Y. Wang and L. Zhou, Chem. Eng. J., 2013, 226, 131–138 CrossRef.
- Y.-N. Phang, S.-Y. Chee, C.-O. Lee and Y.-L. Teh, Polym. Degrad. Stab., 2011, 96, 1653–1661 CrossRef.
- Y. Xie, C. A. S. Hill, Z. Xiao, H. Militz and C. Mai, Composites, Part A, 2010, 41, 806–819 CrossRef.
- B. Liu and Y. Huang, J. Mater. Chem., 2011, 21, 17413 RSC.
- E. P. Kuncoro, J. Roussy and E. Guibal, Sep. Sci. Technol., 2005, 40, 659–684 CrossRef.
- H. Bessbousse, T. Rhlalou, J.-F. Verchère and L. Lebrun, J. Membr. Sci., 2008, 307, 249–259 CrossRef.
- X. Wang, M. Min, Z. Liu, Y. Yang, Z. Zhou, M. Zhu, Y. Chen and B. S. Hsiao, J. Membr. Sci., 2011, 379, 191–199 CrossRef.
- C. Y. Yin, M. K. Aroua and W. M. A. W. Daud, Colloids Surf., A, 2007, 307, 128–136 CrossRef.
- B. Gao, F. An and K. Liu, Appl. Surf. Sci., 2006, 253, 1946–1952 CrossRef.
- M. Amara, Talanta, 2003, 60, 991–1001 CrossRef PubMed.
- M. Chanda and G. L. Rempel, Ind. Eng. Chem. Res., 2001, 40, 1624–1632 CrossRef.
- S. Deng and Y.-P. Ting, Water Res., 2005, 39, 2167–2177 CrossRef PubMed.
- X.-F. Sun, Y. Ma, X.-W. Liu, S.-G. Wang, B.-Y. Gao and X.-M. Li, Water Res., 2010, 44, 2517–2524 CrossRef PubMed.
- M. Song and J. Xu, Electroanalysis, 2013, 25, 523–530 CrossRef.
- S. Schiewer and S. B. Patil, Bioresour. Technol., 2008, 99, 1896–1903 CrossRef PubMed.
- R. Liang, H. Cao and D. Qian, Chem. Commun., 2011, 47, 10305–10307 RSC.
- M. Uchimiya, I. M. Lima, K. Thomas Klasson, S. Chang, L. H. Wartelle and J. E. Rodgers, J. Agric. Food Chem., 2010, 58, 5538–5544 CrossRef PubMed.
- X.-Y. Yu, T. Luo, Y.-X. Zhang, Y. Jia, B.-J. Zhu, X.-C. Fu, J.-H. Liu and X.-J. Huang, ACS Appl. Mater. Interfaces, 2011, 3, 2585–2593 Search PubMed.
- E. Torres, Y. N. Mata, M. L. Blázquez, J. A. Muñoz, F. González and A. Ballester, Langmuir, 2005, 21, 7951–7958 CrossRef PubMed.
- Y. Niu, R. Qu, C. Sun, C. Wang, H. Chen, C. Ji, Y. Zhang, X. Shao and F. Bu, J. Hazard. Mater., 2013, 244–245, 276–286 CrossRef PubMed.
- Z. Salmasi, W. T. Shier, M. Hashemi, E. Mahdipour, H. Parhiz, K. Abnous and M. Ramezani, Eur. J. Pharm. Biopharm., 2015, 96, 76–88 CrossRef PubMed.
- G. Annadurai, L. Y. Ling and J.-F. Lee, J. Hazard. Mater., 2008, 152, 337–346 CrossRef PubMed.
- I.-H. Lee, Y.-C. Kuan and J.-M. Chern, J. Chin. Inst. Chem. Eng., 2007, 38, 71–84 CrossRef.
- N. Jiwalak, S. Rattanaphani, J. B. Bremner and V. Rattanaphani, Fibers Polym., 2010, 11, 572–579 CrossRef.
- C. Cheng, L. Ma, J. Ren, L. Li, G. Zhang, Q. Yang and C. Zhao, Chem. Eng. J., 2011, 171, 1132–1142 CrossRef.
- F.-C. Wu, R.-L. Tseng and R.-S. Juang, Chem. Eng. J., 2009, 153, 1–8 CrossRef.
- J. Wang, L. Xu, Y. Meng, C. Cheng and A. Li, Chem. Eng. J., 2011, 178, 108–114 CrossRef.
- S. Chen, Y. Zou, Z. Yan, W. Shen, S. Shi, X. Zhang and H. Wang, J. Hazard. Mater., 2009, 161, 1355–1359 CrossRef PubMed.
- A. El-Sikaily, A. E. Nemr, A. Khaled and O. Abdelwehab, J. Hazard. Mater., 2007, 148, 216–228 CrossRef PubMed.
- N. Li and R. Bai, Sep. Purif. Technol., 2005, 42, 237–247 CrossRef.
- C. M. Futalan, C.-C. Kan, M. L. Dalida, K.-J. Hsien, C. Pascua and M.-W. Wan, Carbohydr. Polym., 2011, 83, 528–536 CrossRef.
- M. Barsbay, P. A. Kavaklı, S. Tilki, C. Kavaklı and O. Güven, Radiat. Phys. Chem., 2018, 142, 70–76 CrossRef.
- J. Yu, L. Wang, R. Chi, Y. Zhang, Z. Xu and J. Guo, Res. Chem. Intermed., 2015, 41, 1525–1541 CrossRef.
- A. A. Yakout, R. H. El-Sokkary, M. A. Shreadah and O. G. Abdel Hamid, Carbohydr. Polym., 2016, 148, 406–414 CrossRef PubMed.
- S. K. Papageorgiou, E. P. Kouvelos and F. K. Katsaros, Desalination, 2008, 224, 293–306 CrossRef.
- X. Luo, J. Zeng, S. Liu and L. Zhang, Bioresour. Technol., 2015, 194, 403–406 CrossRef PubMed.
- C. Fan, K. Li, J. Li, D. Ying, Y. Wang and J. Jia, J. Hazard. Mater., 2017, 326, 211–220 CrossRef PubMed.
- H.-L. Fan, S.-F. Zhou, W.-Z. Jiao, G.-S. Qi and Y.-Z. Liu, Carbohydr. Polym., 2017, 174, 1192–1200 CrossRef PubMed.
- Y. Niu, K. Li, D. Ying, Y. Wang and J. Jia, Bioresour. Technol., 2017, 229, 63–68 CrossRef PubMed.
- K. A. Gebru and C. Das, Journal of Water Process Engineering, 2017, 16, 1–13 CrossRef.
- E. Padilla-Ortega, R. Leyva-Ramos and J. V. Flores-Cano, Chem. Eng. J., 2013, 225, 535–546 CrossRef.
- M. B. Mcbride, Environmental chemistry of soils, Oxford University Press, 1994 Search PubMed.
- E. R. Nightingale, J. Phys. Chem., 1959, 63, 1381–1387 CrossRef.
Footnote |
| † Electronic supplementary information (ESI) available. See DOI: 10.1039/c8ra02055h |
|
| This journal is © The Royal Society of Chemistry 2018 |
Click here to see how this site uses Cookies. View our privacy policy here. 
 Open Access Article
 This Open Access Article is licensed under a Creative Commons Attribution-Non Commercial 3.0 Unported Licence
 ,
Guangfu Qian,
Guohuan Huang,
Xiuzhen Tang and
Baofeng Lin
,
Guangfu Qian,
Guohuan Huang,
Xiuzhen Tang and
Baofeng Lin