DOI:
10.1039/C8RA02006J
(Paper)
RSC Adv., 2018,
8, 15119-15133
The investigation of the specific behavior of a cationic block structure and its excellent flocculation performance in high-turbidity water treatment†
Received
7th March 2018
, Accepted 7th April 2018
First published on 20th April 2018
Abstract
The fabrication of a cationic polyacrylamide (CPAM) with high efficiency and economy has been highly desired in the field of high-turbidity water treatment. This study introduced an ultrasound (US)-initiated template polymerization (UTP) method to develop a novel cationic templated polyacrylamide (TPAA) with a microblock structure. TPAA was prepared using acrylamide (AM) and sodium (3-acrylamidopropyl)trimethylammonium chloride (ATAC) as the monomers and sodium polyacrylate (NaPAA) as the template. Factors that affected polymerization such as the ultrasound power, ultrasound time, initiator concentration, pH, and mAM![[thin space (1/6-em)]](https://www.rsc.org/images/entities/char_2009.gif) :
:![[thin space (1/6-em)]](https://www.rsc.org/images/entities/char_2009.gif) mATAC and nNaPAA
mATAC and nNaPAA![[thin space (1/6-em)]](https://www.rsc.org/images/entities/char_2009.gif) :
:![[thin space (1/6-em)]](https://www.rsc.org/images/entities/char_2009.gif) nATAC values were investigated. The properties of the polymers were characterized by Fourier transform infrared spectroscopy (FTIR), 1H nuclear magnetic resonance spectroscopy (1H NMR), thermogravimetric analysis (TGA) and scanning electron microscopy (SEM). The results indicated the successful formation of a cationic microblock structure in TPAA. In addition, TPAA displayed favorable thermal decomposition properties and a rough and coarse surface morphology, as shown by analyses using TGA and SEM, respectively. Moreover, a zip (type I) template polymerization mechanism was identified via analyses of the association constant (KM), conversion (Cv) and polymerization rate (Rp). The flocculation performance of the templated copolymer TPAA was evaluated by treating high-turbidity water. According to the results for the zeta potentials and FTIR spectra of the generated flocs, it was indicated that the cationic microblocks in the templated copolymer could greatly enhance its charge neutralization, patching and bridging ability, and therefore excellent flocculation performance (residual turbidity: 5.8 NTU, Df: 1.89, floc size d50: 608.404 μm and floc kinetic: 15.86 × 10⁻⁴ s−1) for treating high-turbidity water was achieved.
nATAC values were investigated. The properties of the polymers were characterized by Fourier transform infrared spectroscopy (FTIR), 1H nuclear magnetic resonance spectroscopy (1H NMR), thermogravimetric analysis (TGA) and scanning electron microscopy (SEM). The results indicated the successful formation of a cationic microblock structure in TPAA. In addition, TPAA displayed favorable thermal decomposition properties and a rough and coarse surface morphology, as shown by analyses using TGA and SEM, respectively. Moreover, a zip (type I) template polymerization mechanism was identified via analyses of the association constant (KM), conversion (Cv) and polymerization rate (Rp). The flocculation performance of the templated copolymer TPAA was evaluated by treating high-turbidity water. According to the results for the zeta potentials and FTIR spectra of the generated flocs, it was indicated that the cationic microblocks in the templated copolymer could greatly enhance its charge neutralization, patching and bridging ability, and therefore excellent flocculation performance (residual turbidity: 5.8 NTU, Df: 1.89, floc size d50: 608.404 μm and floc kinetic: 15.86 × 10⁻⁴ s−1) for treating high-turbidity water was achieved.
1. Introduction
High-turbidity water pollution has become a major problem in many developing countries because it gives rise to water shortages and deterioration of water quality, which further restrict the development of the national economy and society.1,2 High-turbidity wastewater characterized by high levels of suspended solids will lead to serious environmental damage, such as hindrance of aquatic growth, the destruction of vegetation and river blockages.3,4 Moreover, high-turbidity wastewater will block filter holes and abrade water treatment equipment in water purification plants and thus reduce the efficiency of treatment or even paralyze the treatment process. Therefore, the development of an efficient and economical method to treat highly turbid water is an important issue for environmental engineers.5 Fortunately, the flocculation method has attracted much attention owing to its high efficiency, low cost, convenient operation and enhancement of its functions via modification.
Cationic polyacrylamide (CPAM) has been developed and widely used for the separation and treatment of high-turbidity water because of its satisfactory solid-water separation performance and the negative charge properties of most high-turbidity wastewater.6,7 Negatively charged particles can be thoroughly neutralized and destabilized by the cationic chemical group, and then these destabilized particles will be captured by the molecular chain of the polymer to agglomerate and form large and compact flocs.8 As a result, these particles are thoroughly separated and removed from the water. Thus far, various CPAMs and their modified forms have been successfully synthesized for use in heavy metal removal, oil mill effluent treatment, kaolin wastewater removal, high-turbidity water separation and so on.9–12 These flocculants perform well and exhibit excellent flocculation performance for the removal and separation of particles. Although progress and triumphs in the design and development of polymers have been achieved, great efforts are still needed to design new economic and efficient flocculants or propose new ways to overcome bottlenecks in existing methods for preparing novel flocculants. Template synthesis technology has become increasingly attractive for synthesizing nanotubes, nanopore arrays, and nanostructures owing to its controllable and tunable advantages.13–16 In order to obtain the desired products, a template with a specific and novel structure is used to construct the skeleton, and the materials used for the products will combine with the template to form precursors of the desired products via electrostatic attraction, hydrogen bonding interactions and chemical/physical effects.17 When the template is separated, the remaining materials will have the same desired structure as that of the template, and thus this technology is so powerful. If template synthesis technology is introduced and used to develop flocculants with novel structures, the flocculation ability of the flocculants will undergo a great improvement. As shown in Fig. 1, the novel microblock structure in the polymer chain will have a strong electrostatic charge force and high charge efficiency to neutralize negatively charged particles completely to form a more compact floc structure, whereas a random distribution of charges in the polymer chain will lead to poor flocculation performance. However, there have been few reports of the use of this new template synthesis technology in the design and development of polymers, and hence it will be more meaningful and constructive to use this method for the preparation of polymers.
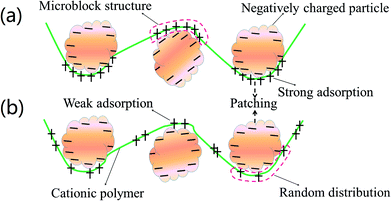 |
| | Fig. 1 Flocculation models for (a) templated copolymer with microblock structure and (b) random distributed copolymer. | |
(3-Acrylamidopropyl)trimethylammonium chloride (ATAC) and acrylamide (AM) are common monomers used for the preparation of polymers, and their products have been widely used in the removal of high-turbidity water.18,19 Therefore, ATAC and AM were selected as the monomers to prepare the templated copolymer TPAA with the novel microblock structure by template polymerization, as this would be more significant and challenging. Sodium polyacrylate (NaPAA) was chosen as the template in this experiment because its molecular weight is tunable and it is easily separated with ethyl alcohol. Moreover, ultrasound (US)-initiated polymerization is a popular topic owing to its advantages such as low cost, easy operation, high efficiency and environmental safety.20,21 It has also been reported that US-initiated polymerization has a specific function in modifying the polymer surface and obtaining a more porous and coarse surface morphology, which thus improves the dissolution of the polymer and enhances its flocculation performance.22 On the basis of the merits of US-initiated polymerization, US-initiated template polymerization technology should be adopted to prepare the flocculant TPAA with the novel microblock structure.
In view of all the aforementioned aspects, this study aimed to: (1) synthesize the templated copolymer (TPAA) with the cationic microblock structure by US-initiated template polymerization technology using ATAC and AM as the monomers and NaPAA as the template; (2) examine the synthesis conditions, namely, the ultrasound power, ultrasound time, initiator concentration, pH, and mAM![[thin space (1/6-em)]](https://www.rsc.org/images/entities/char_2009.gif) :
:![[thin space (1/6-em)]](https://www.rsc.org/images/entities/char_2009.gif) mATAC and nNaPAA
mATAC and nNaPAA![[thin space (1/6-em)]](https://www.rsc.org/images/entities/char_2009.gif) :
:![[thin space (1/6-em)]](https://www.rsc.org/images/entities/char_2009.gif) nATAC values, depending on the intrinsic viscosity and conversion; (3) determine the template polymerization mechanism by investigating the association constant (KM), conversion (Cv) and polymerization rate (Rp); (4) characterize the structural properties of the polymers by employing FTIR, 1H NMR, TGA and scanning electron microscopy (SEM); (5) evaluate the flocculation performance of the polymers in terms of residual turbidity, floc size, recoverability, fractal dimension and settling behaviors; and (6) discuss the flocculation mechanism via analyses of the zeta potentials and FTIR spectra of the formed flocs.
nATAC values, depending on the intrinsic viscosity and conversion; (3) determine the template polymerization mechanism by investigating the association constant (KM), conversion (Cv) and polymerization rate (Rp); (4) characterize the structural properties of the polymers by employing FTIR, 1H NMR, TGA and scanning electron microscopy (SEM); (5) evaluate the flocculation performance of the polymers in terms of residual turbidity, floc size, recoverability, fractal dimension and settling behaviors; and (6) discuss the flocculation mechanism via analyses of the zeta potentials and FTIR spectra of the formed flocs.
2. Experimental section
2.1. Materials
Acrylamide (AM) was a gift from Lanjie Tap Water Company (Chongqing, China) and was of industrial grade. (3-Acrylamidopropyl)trimethylammonium chloride (ATAC) (74–76 wt% in water, industrial grade) was obtained from Longsheng Chemical Co., Ltd (Shanghai, China). Sodium polyacrylate (NaPAA) with a molecular weight (MW) of 5300 and the initiator 2,2′-azobis[2-(2-imidazolin-2-yl)propane] dihydrochloride (VA-044) were both purchased from Apotheker Chemical Reagent Co., Ltd (Chendou, China) and were both of analytical grade. In order to carry out a controlled trial, the commercial flocculants CCPDA and CCPMA were purchased from Lanjie Tap Water Company (Chongqing, China). CCPDA was prepared from AM and acryloyloxyethyltrimethylammonium chloride (DAC), and CCPMA was formed by copolymerization of AM and methacryloxyethyltrimethylammonium chloride (DMC). Besides, polyacrylamide (PAM) made in the laboratory was used for the characterization analysis.
2.2. Synthesis of copolymers
Possible routes for the US-initiated synthesis of the templated copolymer TPAA and randomly distributed copolymer CPAA are illustrated in Fig. 2, and the procedure for the preparation of the templated copolymer TPAA was as follows: predetermined doses of AM, ATAC, NaPAA (nNaPAA![[thin space (1/6-em)]](https://www.rsc.org/images/entities/char_2009.gif) :
:![[thin space (1/6-em)]](https://www.rsc.org/images/entities/char_2009.gif) nATAC = 1
nATAC = 1![[thin space (1/6-em)]](https://www.rsc.org/images/entities/char_2009.gif) :
:![[thin space (1/6-em)]](https://www.rsc.org/images/entities/char_2009.gif) 1) and deionized water were added to a 100 mL glass vessel, and the vessel was shaken several times until the reagents dissolved. The total monomer concentration was fixed at 30%. Then, the pH of the above aqueous solution was adjusted to the set value with 0.5 mol L−1 HCl and NaOH. Subsequently, nitrogen was bubbled into the solution for 30 min, and the vessel was sealed immediately after the addition of the initiator VA-044. After the above procedures were performed, the solution was subjected to ultrasonic radiation generated by an ultrasound generator (Sonics Vibra-Cell VCX 500; power: 0–500 W; frequency: 20 kHz; horn type; sonic wave probe: tip diameter = 13 mm, length = 136 mm) for 15 min at room temperature to finish the copolymerization reaction. Finally, the solid product was purified with ethyl alcohol and desiccated in a vacuum oven at 95 °C for 24 h to obtain the final product. On the other hand, the method for the preparation of the randomly distributed copolymer CPAA was similar to that used for TPAA, and the only difference was that no NaPAA was added for CPAA. In addition, polyacrylamide (PAM) was prepared by the above method (US-initiated polymerization) to perform a comparative characterization of the polymers.
1) and deionized water were added to a 100 mL glass vessel, and the vessel was shaken several times until the reagents dissolved. The total monomer concentration was fixed at 30%. Then, the pH of the above aqueous solution was adjusted to the set value with 0.5 mol L−1 HCl and NaOH. Subsequently, nitrogen was bubbled into the solution for 30 min, and the vessel was sealed immediately after the addition of the initiator VA-044. After the above procedures were performed, the solution was subjected to ultrasonic radiation generated by an ultrasound generator (Sonics Vibra-Cell VCX 500; power: 0–500 W; frequency: 20 kHz; horn type; sonic wave probe: tip diameter = 13 mm, length = 136 mm) for 15 min at room temperature to finish the copolymerization reaction. Finally, the solid product was purified with ethyl alcohol and desiccated in a vacuum oven at 95 °C for 24 h to obtain the final product. On the other hand, the method for the preparation of the randomly distributed copolymer CPAA was similar to that used for TPAA, and the only difference was that no NaPAA was added for CPAA. In addition, polyacrylamide (PAM) was prepared by the above method (US-initiated polymerization) to perform a comparative characterization of the polymers.
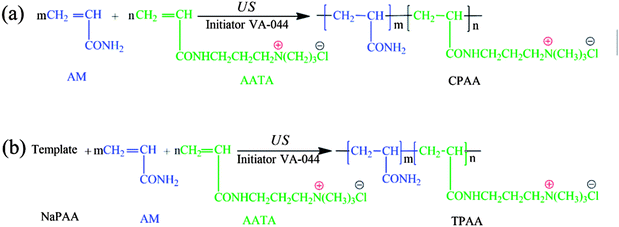 |
| | Fig. 2 Possible routes for the US-initiated synthesis of (a) the randomly distributed copolymer CPAA and (b) the templated copolymer TPAA. | |
2.3. Characteristics of copolymers
According to previous research, the total monomer conversion and the intrinsic viscosities of the polymers (η) were measured by the gravimetric and one-point methods, respectively.1,23 The positive charge density of the polymers, which was used to evaluate their charge neutralization ability, was measured by a titration method.24 Poly(vinyl sulfate) potassium salt (PVSK) and toluidine blue O (TBO) were used as the titrant and indicator, respectively.
Instrumental analyses such as FTIR and 1H NMR spectroscopy of the polymers were performed with a 550 Series II infrared spectrometer (Mettler Toledo Instruments Co., Ltd, Switzerland) using KBr pellets and an Avance 500 nuclear magnetic resonance spectrometer (Bruker Company, Ettlingen, Germany) using deuterium oxide (D2O) as the solvent, respectively. The morphologies of the copolymers were recorded with a MIRA 3 LMU SEM system (TESCAN Company, Czech Republic). Thermogravimetric analysis (TGA) was conducted with a DTG-60H simultaneous thermal analyzer (Shimadzu, Kyoto, Japan) at a heating rate of 10 °C min−1 and a nitrogen flow rate of 20 mL min−1 in the temperature range of 20–600 °C.
2.4. Determination of KM, Cv and Rp
On the basis of previous studies, the association constant (KM) can be used to examine the strength of the interaction between the template NaPAA and the cationic monomer and also the mechanism of template polymerization.25,26 Besides, measurements of the conversion (Cv) and polymerization rate (Rp) are also important and helpful for understanding the template polymerization mechanism and the effect of the template on the polymerization. In this study, dialysis and conductometric titration methods were used to determine the values of KM, Cv and Rp, and details of these methods are displayed in ESI S1.†
2.5. Flocculation experiments
2.5.1. Jar tests. Jar tests were conducted using a program-controlled jar test apparatus (ZR4-6, Zhongrun Water Industry Technology Development Co. Ltd, China) with a six-place programmed paddle mixer at room temperature. A kaolin suspension (0.5 g L−1) with an original turbidity of 143 NTU and an original zeta potential of −43.7 mV at a pH of 7 was used as simulated high-turbidity wastewater. The kaolin used in this experiment was characterized by an average size of 3.5 μm, a density of 2.6 g cm−3 and a purity of 98%. Coagulation experiments were also performed at different pH values, and the pH was adjusted using appropriate volumes of 0.1 mol L−1 HCl and NaOH. The detailed procedure of the jar tests comprised rapid stirring at 200 rpm for 5 min to ensure sufficient mixing of the flocculants with the wastewater, slow stirring at 50 rpm for 15 min for the growth of flocs, and finally a settling period of 30 min for floc sedimentation. After the completion of these steps, samples were collected from the supernatants for further measurements of the residual turbidity using a 2100P turbidity meter (Hach, Loveland, CO), zeta potential (ZP) measurements using a Zetasizer Nano ZS90 analyzer (Malvern Instruments Ltd, Malvern, UK) and floc size analysis using a Zetasizer 3000HSA (Malvern Instruments, UK), respectively. Each result recorded under the corresponding conditions was the average of three repeated measurements, and the standard deviation was controlled at less than 5%. Details of the flocculants used for the characterization and jar tests are shown in Table 1. Besides, the flocculation kinetics of the four flocculants was also investigated using eqn (1), which is expressed as follows:| |
 | (1) |
where N0 is the initial turbidity (143 NTU), Nt is the turbidity as a function of time (1, 4, 7, 11, 14, 17, and 20 min) after slow stirring (50 rpm for 15 min) during each flocculation test, and k is the kinetic constant of the flocculation system.
Table 1 Details of flocculants used for the characterization and jar tests
| Flocculanta |
Cationic monomer molar content (%) |
Intrinsic viscosity (dL g−1) |
Conversion rate (%) |
Synthetic method |
| TPAA: templated copolymer of ATAC and AM produced by US-initiated template copolymerization (UTP); CPAA: copolymer of ATAC and AM produced by non-US-initiated template copolymerization (N-UTP); PAM: homopolymer of AM produced by N-UTP; CCPDA: commercial copolymer of DAC and AM; CCPMA: commercial copolymer of DMC and AM. |
| TPAA |
30.0 |
8.49 |
99.7 |
UTP |
| CPAA |
30.0 |
8.50 |
99.6 |
N-UTP |
| CCPDA |
30.0 |
8.51 |
— |
— |
| CCPMA |
30.0 |
8.51 |
— |
— |
| PAM |
— |
8.50 |
99.8 |
N-UTP |
2.5.2. Determination of fractal dimension (Df). Fractal geometry has been widely used to describe the structure of particles, and the aggregate structure can be simply described by the fractal dimension (Df).27,28 Df is an important index that represents the degree of compactness of the primary particles and was used to evaluate the solid/liquid separation efficiency. In this experiment, the Df value of the kaolin floc that formed was measured after the settling period. Details of the Df measurements are available in ESI S2.†
3. Results and discussion
3.1. Optimizing synthesis conditions
3.1.1. Effect of ultrasound power on copolymerization. The ultrasound waves, which are regarded as the core component of the US-initiated polymerization system, released more energy to promote molecular collisions and accelerate the cleavage of the initiator to form more free radicals and thereby initiated the copolymerization of the monomers. Therefore, the effect of the ultrasound power on copolymerization was investigated at an ultrasound time of 15 min, an initiator concentration of 0.06 wt‰, pH = 4.5, mAM![[thin space (1/6-em)]](https://www.rsc.org/images/entities/char_2009.gif) :
:![[thin space (1/6-em)]](https://www.rsc.org/images/entities/char_2009.gif) mATAC = 3
mATAC = 3![[thin space (1/6-em)]](https://www.rsc.org/images/entities/char_2009.gif) :
:![[thin space (1/6-em)]](https://www.rsc.org/images/entities/char_2009.gif) 1 and nNaPAA
1 and nNaPAA![[thin space (1/6-em)]](https://www.rsc.org/images/entities/char_2009.gif) :
:![[thin space (1/6-em)]](https://www.rsc.org/images/entities/char_2009.gif) nATAC = 1
nATAC = 1![[thin space (1/6-em)]](https://www.rsc.org/images/entities/char_2009.gif) :
:![[thin space (1/6-em)]](https://www.rsc.org/images/entities/char_2009.gif) 1. As depicted in Fig. 3(a), it was shown that an ultrasound power of 200 W was more favorable for copolymerization, whereas an ultrasound power of higher or lower than 200 W was unsatisfactory for copolymerization. At a lower ultrasound power, the initiation energy was not sufficiently high to generate enough free radicals, and the collision of monomers was inefficient. As a result, the copolymerization efficiency was reduced, which thus led to decreases in the intrinsic viscosity and conversion. In contrast, a higher ultrasound power promoted the cleavage of the initiator to generate superfluous free radicals within a short time and also resulted in violent collisions of monomers. Thus, chain transfer and chain termination accelerated, and decreases in intrinsic viscosity and conversion occurred.29 Besides, the stronger shear force caused by the swelling and collapse of cavities destroyed and fragmented the polymer chains that formed, which thus led to low intrinsic viscosity. Accordingly, the favorable ultrasound power of 200 W was used in this study to achieve high-efficiency copolymerization.
1. As depicted in Fig. 3(a), it was shown that an ultrasound power of 200 W was more favorable for copolymerization, whereas an ultrasound power of higher or lower than 200 W was unsatisfactory for copolymerization. At a lower ultrasound power, the initiation energy was not sufficiently high to generate enough free radicals, and the collision of monomers was inefficient. As a result, the copolymerization efficiency was reduced, which thus led to decreases in the intrinsic viscosity and conversion. In contrast, a higher ultrasound power promoted the cleavage of the initiator to generate superfluous free radicals within a short time and also resulted in violent collisions of monomers. Thus, chain transfer and chain termination accelerated, and decreases in intrinsic viscosity and conversion occurred.29 Besides, the stronger shear force caused by the swelling and collapse of cavities destroyed and fragmented the polymer chains that formed, which thus led to low intrinsic viscosity. Accordingly, the favorable ultrasound power of 200 W was used in this study to achieve high-efficiency copolymerization.
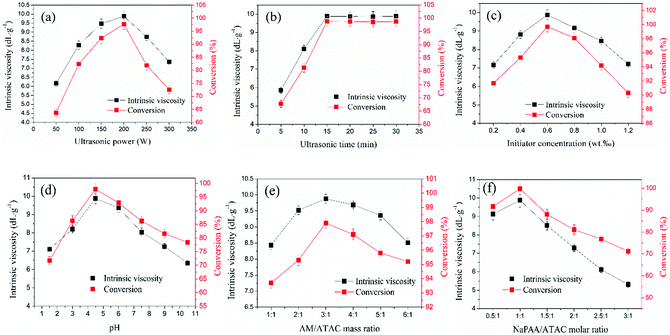 |
| | Fig. 3 Effects of (a) ultrasound power, (b) ultrasound time, (c) initiator concentration, (d) pH, (e) AM/ATAC mass ratio and (f) NaPAA/ATAC molar ratio on polymerization. | |
3.1.2. Effect of ultrasound time on copolymerization. As shown in Fig. 3(c), the effect of varying the US irradiation time on polymerization was evaluated while the other factors were kept constant. It was obvious that the intrinsic viscosity and conversion increased rapidly with an increase in the US irradiation time from 10 min to 15 min, whereas almost no increases in the intrinsic viscosity and conversion were observed when the US irradiation time was more than 15 min. The US radiation would decompose the initiator and generate free radicals to accelerate the breaking of molecular bonds and increase the number of grafting sites and thus lead to rapid increases in the intrinsic viscosity and conversion.30 However, the initiator would disintegrate and be used up under continued US radiation (>15 min), and no free radicals would be generated any longer. Consequently, the intrinsic viscosity and conversion maintained an unchanged trend when the irradiation time exceeded 15 min. Therefore, 15 min was chosen as the optimal irradiation time in this study.
3.1.3. Effect of initiator dosage on copolymerization. Fig. 3(b) shows the effect of varying the initiator dosage on the intrinsic viscosity and conversion while keeping the other factors constant. The intrinsic viscosity and conversion increased initially with an increase in the initiator dosage from 0.01 wt‰ to 0.06 wt‰ and then declined rapidly with a further increase in the initiator concentration. The few free radicals generated by a lower initiator dosage would be surrounded by a large number of solvent molecules, resulting in a “cage effect”, which would prevent the formation of monomeric free radicals and further chain growth.31 A relatively higher initiator dosage was favorable for increasing the intrinsic viscosity and conversion. However, an excessive initiator dosage would accelerate chain transfer and chain termination and thus cause a decline in intrinsic viscosity and conversion.32 In addition, the crosslinking and collapse caused by the excess initiator were unfavorable for increases in intrinsic viscosity and conversion. Thus, the optimal monomer concentration was deemed to be 0.06 wt‰ in this study.
3.1.4. Effect of pH on copolymerization. According to a previous study, pH is an important factor that significantly affects copolymerization reactions. Other conditions remained constant, and the effect of pH on the intrinsic viscosity and conversion was investigated. The results shown in Fig. 3(d) indicate that the intrinsic viscosity and conversion greatly increased with an increase in pH from 1.5 to 4.5, but a distinct decrease occurred with a further increase in pH. At a lower pH (pH ≤ 3.0), intramolecular imidization of AM easily occurred to form a branched or crosslinked polymer, which thereby reduced the intrinsic viscosity and conversion of the copolymer.33 Moreover, the strongly acidic conditions caused the acidification of the –COO− group in NaPAA to form a –COOH group, which reduced the solubility of NaPAA and hindered the copolymerization reaction. In contrast, a high pH (pH > 9) would accelerate the hydrolysis of the quaternary ammonium group in the ATAC monomer and hinder chain growth, resulting in a higher intrinsic viscosity and conversion.34 Therefore, the optimum pH value for copolymerization was set at 4.5.
3.1.5. Effect of AM/ATAC mass ratio on copolymerization. Fig. 3(e) shows the effect of varying the AM/ATAC mass ratio on the intrinsic viscosity and conversion while the other factors were kept constant. It was obvious that both the intrinsic viscosity and the conversion initially increased to a maximum and then decreased with a further increase in the value of mAM![[thin space (1/6-em)]](https://www.rsc.org/images/entities/char_2009.gif) :
:![[thin space (1/6-em)]](https://www.rsc.org/images/entities/char_2009.gif) mATAC. When the AM/ATAC mass ratio was 3
mATAC. When the AM/ATAC mass ratio was 3![[thin space (1/6-em)]](https://www.rsc.org/images/entities/char_2009.gif) :
:![[thin space (1/6-em)]](https://www.rsc.org/images/entities/char_2009.gif) 1, the intrinsic viscosity and conversion reached their maximum values of 9.88 dL g−1 and 99.7%, respectively. In the early stage of copolymerization, the number of free radicals and the chance of collisions between monomers were vital to the intrinsic viscosity and conversion of the polymer.35 Because AM has a higher reactivity ratio in comparison with other monomers, a higher AM concentration increased the number of primary free radicals and the chance of collisions, and hence chain propagation and further conversion were more likely to happen. However, an excessive concentration of AM monomer reacted vigorously and thereby accelerated chain transfer and chain termination. As a result, it led to lower intrinsic viscosity and conversion. Therefore, the optimal mass ratio of AM to ATAC was deemed to be 3
1, the intrinsic viscosity and conversion reached their maximum values of 9.88 dL g−1 and 99.7%, respectively. In the early stage of copolymerization, the number of free radicals and the chance of collisions between monomers were vital to the intrinsic viscosity and conversion of the polymer.35 Because AM has a higher reactivity ratio in comparison with other monomers, a higher AM concentration increased the number of primary free radicals and the chance of collisions, and hence chain propagation and further conversion were more likely to happen. However, an excessive concentration of AM monomer reacted vigorously and thereby accelerated chain transfer and chain termination. As a result, it led to lower intrinsic viscosity and conversion. Therefore, the optimal mass ratio of AM to ATAC was deemed to be 3![[thin space (1/6-em)]](https://www.rsc.org/images/entities/char_2009.gif) :
:![[thin space (1/6-em)]](https://www.rsc.org/images/entities/char_2009.gif) 1.
1.
3.1.6. Effect of NaPAA/ATAC molar ratio on polymerization. Fig. 3(f) shows the effect of varying nNaPAA![[thin space (1/6-em)]](https://www.rsc.org/images/entities/char_2009.gif) :
:![[thin space (1/6-em)]](https://www.rsc.org/images/entities/char_2009.gif) nATAC on the intrinsic viscosity and conversion while the other factors were constant. It was clear that the intrinsic viscosity and conversion changed greatly at different nNaPAA
nATAC on the intrinsic viscosity and conversion while the other factors were constant. It was clear that the intrinsic viscosity and conversion changed greatly at different nNaPAA![[thin space (1/6-em)]](https://www.rsc.org/images/entities/char_2009.gif) :
:![[thin space (1/6-em)]](https://www.rsc.org/images/entities/char_2009.gif) nATAC values, which indicated that NaPAA had a great effect on the polymerization. The intrinsic viscosity and conversion initially increased, reached their maximum value at nNaPAA
nATAC values, which indicated that NaPAA had a great effect on the polymerization. The intrinsic viscosity and conversion initially increased, reached their maximum value at nNaPAA![[thin space (1/6-em)]](https://www.rsc.org/images/entities/char_2009.gif) :
:![[thin space (1/6-em)]](https://www.rsc.org/images/entities/char_2009.gif) nATAC = 1
nATAC = 1![[thin space (1/6-em)]](https://www.rsc.org/images/entities/char_2009.gif) :
:![[thin space (1/6-em)]](https://www.rsc.org/images/entities/char_2009.gif) 1 and then decreased rapidly with a further increase in nNaPAA
1 and then decreased rapidly with a further increase in nNaPAA![[thin space (1/6-em)]](https://www.rsc.org/images/entities/char_2009.gif) :
:![[thin space (1/6-em)]](https://www.rsc.org/images/entities/char_2009.gif) nATAC. When the anionic polymer NaPAA was added to the reaction system, the cationic monomer ATAC was adsorbed and distributed along the template molecular chain via electrostatic forces. The reaction of the cationic monomers adsorbed on the NaPAA polymer was easily initiated by free radicals with low hindrance, which thus increased the chain propagation and polymer conversion. In contrast, a higher nNaPAA
nATAC. When the anionic polymer NaPAA was added to the reaction system, the cationic monomer ATAC was adsorbed and distributed along the template molecular chain via electrostatic forces. The reaction of the cationic monomers adsorbed on the NaPAA polymer was easily initiated by free radicals with low hindrance, which thus increased the chain propagation and polymer conversion. In contrast, a higher nNaPAA![[thin space (1/6-em)]](https://www.rsc.org/images/entities/char_2009.gif) :
:![[thin space (1/6-em)]](https://www.rsc.org/images/entities/char_2009.gif) nATAC value would reduce the intrinsic viscosity and conversion. Because NaPAA with –COO− groups has high steric hindrance, superfluous NaPAA molecules would wrap the NaPAA polymer to create a cage effect, which would distinctly decrease the chance of collisions with free radicals and inhibit the reaction. As a result, the intrinsic viscosity and conversion of the polymer were both reduced. Therefore, the favorable molar ratio of NaPAA to ATAC was determined to be 1
nATAC value would reduce the intrinsic viscosity and conversion. Because NaPAA with –COO− groups has high steric hindrance, superfluous NaPAA molecules would wrap the NaPAA polymer to create a cage effect, which would distinctly decrease the chance of collisions with free radicals and inhibit the reaction. As a result, the intrinsic viscosity and conversion of the polymer were both reduced. Therefore, the favorable molar ratio of NaPAA to ATAC was determined to be 1![[thin space (1/6-em)]](https://www.rsc.org/images/entities/char_2009.gif) :
:![[thin space (1/6-em)]](https://www.rsc.org/images/entities/char_2009.gif) 1.
1.
3.2. Association constant (KM) and template polymerization mechanism
In order to obtain an in-depth understanding of the possible template polymerization mechanism, the strength of the interaction between the template and the cationic monomer ATAC was measured via the association constant (KM). In this template polymerization system, a KM value of 13.97 was determined at nNaPAA![[thin space (1/6-em)]](https://www.rsc.org/images/entities/char_2009.gif) :
:![[thin space (1/6-em)]](https://www.rsc.org/images/entities/char_2009.gif) nATAC = 1. The KM value of 13.97 indicated that more than three-quarters of the ATAC molecules were pre-adsorbed and arranged along the molecular chain of the NaPAA polymer to form a precursor of the microblock structure under the electrostatic force between ATAC and NaPAA. When the reaction of the ATAC microblock structure was initiated by the US radiation, the cationic ATAC microblock structure was successfully synthesized. Finally, the desired templated copolymer TPAA characterized by the novel cationic microblock structure was obtained after the template NaPAA was separated with alcohol. On the basis of the above analyses, a possible zip (type I) mechanism was proposed for this template polymerization, as shown in Fig. 4.
nATAC = 1. The KM value of 13.97 indicated that more than three-quarters of the ATAC molecules were pre-adsorbed and arranged along the molecular chain of the NaPAA polymer to form a precursor of the microblock structure under the electrostatic force between ATAC and NaPAA. When the reaction of the ATAC microblock structure was initiated by the US radiation, the cationic ATAC microblock structure was successfully synthesized. Finally, the desired templated copolymer TPAA characterized by the novel cationic microblock structure was obtained after the template NaPAA was separated with alcohol. On the basis of the above analyses, a possible zip (type I) mechanism was proposed for this template polymerization, as shown in Fig. 4.
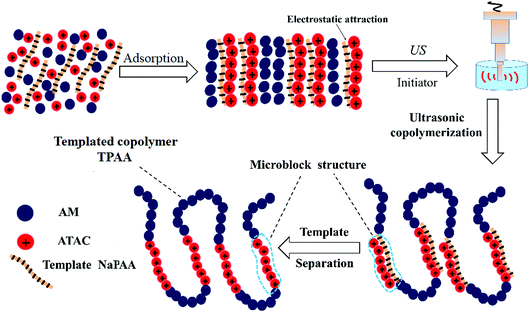 |
| | Fig. 4 Possible mechanism of the template copolymerization. | |
3.3. Effect of nNaPAA/nATAC on conversion (Cv) and polymerization rate (Rp)
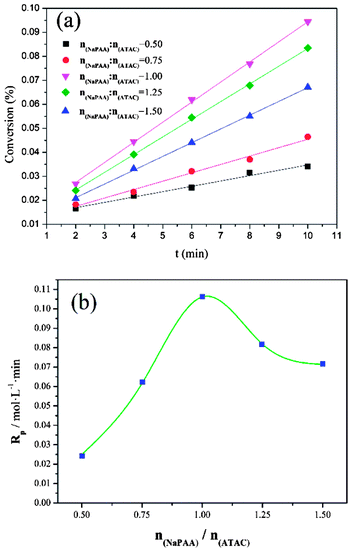
In addition to the investigation based on KM, the effect of the template on the conversion (Cv) and polymerization rate (Rp) was investigated to further comprehend the template polymerization system. As shown in Fig. 5(a), it was found that the conversion initially increased to a maximum and then declined with an increase in nNaPAA/nATAC. When the nNaPAA/nATAC value was 1, the maximum value of Cv reached 9.51%. Moreover, the variation trend in Rp shown in Fig. 5(b) was similar to that in Cv, and the maximum value of Rp (0.105 mol L−1 min) was also observed at nNaPAA/nATAC = 1. The above phenomenon could be explained as follows. At a lower nNaPAA/nATAC value (<1), an adequate number of ATAC monomers were adsorbed on the molecular chain of the NaPAA template under the electrostatic force, and thus almost no vacant sites were left. As a result, the reaction of ATAC was rapidly initiated and higher values of Cv and Rp were observed. In contrast, at higher nNaPAA/nATAC values (>1), there were vacant sites and gaps in the molecular chain of the NaPAA template because of a lack of sufficient ATAC monomers to fill the vacant sites on NaPAA. In these conditions, the polymerization reaction was inhibited and controlled by the gaps and vacant sites, and therefore a decrease in the variation trends in Cv and Rp was observed. According to the above analyses, the conclusion that a type I (zip) template polymerization mechanism was involved was again confirmed via the investigation based on Cv and Rp.
 |
| | Fig. 5 Effects of nNaPAA![[thin space (1/6-em)]](https://www.rsc.org/images/entities/char_2009.gif) : :![[thin space (1/6-em)]](https://www.rsc.org/images/entities/char_2009.gif) nATAC on (a) conversion (Cv) and (b) Rp at mAM nATAC on (a) conversion (Cv) and (b) Rp at mAM![[thin space (1/6-em)]](https://www.rsc.org/images/entities/char_2009.gif) : :![[thin space (1/6-em)]](https://www.rsc.org/images/entities/char_2009.gif) mATAC = 3 mATAC = 3![[thin space (1/6-em)]](https://www.rsc.org/images/entities/char_2009.gif) : :![[thin space (1/6-em)]](https://www.rsc.org/images/entities/char_2009.gif) 1, pH = 4.5 and T = 30 °C. 1, pH = 4.5 and T = 30 °C. | |
3.4. Characterization of flocculants
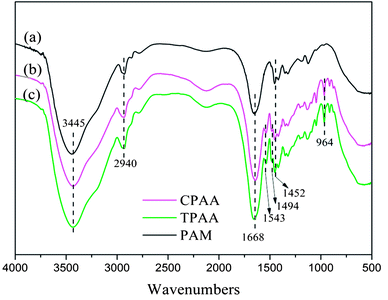
3.4.1. FTIR spectral analysis. FTIR spectroscopy is regarded as an easy and convenient way to characterize copolymers.36 Fig. 6 shows the FTIR spectra of TPAA, CPAA and PAM. The stretching vibrations of NH2 and C![[double bond, length as m-dash]](https://www.rsc.org/images/entities/char_e001.gif) O groups in AM were observed at 3445 cm−1 and 1668 cm−1, respectively.37 The stretching vibrations of CH3 groups in AM appeared at 2940 cm−1.38 Characteristic peaks of TPAA and CPAA appeared at 1543 cm−1 for NH bending vibrations in ATAC, 1494 cm−1 for CH3 stretching vibrations in –N+–(CH3)3 groups, 964 cm−1 for –N+–(CH3)3 bending vibrations, and 1452 cm−1 for CH2 bending vibrations in –CH2–N+ groups.39 In comparison with PAM, the absorption peaks of AM and ATAC all appeared in the FTIR spectra of TPAA and CPAA, which thus indicated the successful copolymerization of AM and ATAC. Moreover, TPAA and CPAA displayed the same absorption peaks, and new absorption peaks were not discovered for either TPAA or CPAA. Therefore, the conclusion could be drawn that US-initiated template polymerization had no influence on the chemical functional groups of the copolymers.
O groups in AM were observed at 3445 cm−1 and 1668 cm−1, respectively.37 The stretching vibrations of CH3 groups in AM appeared at 2940 cm−1.38 Characteristic peaks of TPAA and CPAA appeared at 1543 cm−1 for NH bending vibrations in ATAC, 1494 cm−1 for CH3 stretching vibrations in –N+–(CH3)3 groups, 964 cm−1 for –N+–(CH3)3 bending vibrations, and 1452 cm−1 for CH2 bending vibrations in –CH2–N+ groups.39 In comparison with PAM, the absorption peaks of AM and ATAC all appeared in the FTIR spectra of TPAA and CPAA, which thus indicated the successful copolymerization of AM and ATAC. Moreover, TPAA and CPAA displayed the same absorption peaks, and new absorption peaks were not discovered for either TPAA or CPAA. Therefore, the conclusion could be drawn that US-initiated template polymerization had no influence on the chemical functional groups of the copolymers.
 |
| | Fig. 6 FTIR spectra of (a) PAM, (b) CPAA and (c) TPAA. | |
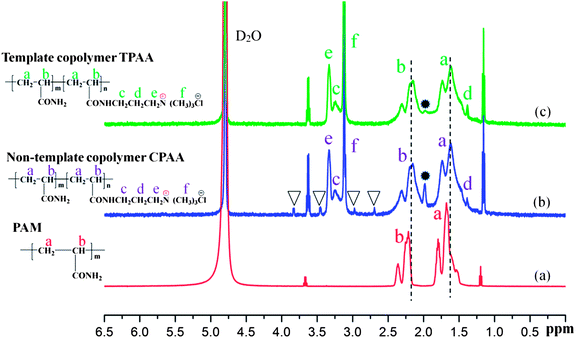
3.4.2. 1H NMR spectral analysis. To further confirm the microstructure of the prepared polymer, the 1H NMR spectra of PAM, CPAA and TPAA are shown in Fig. 7. Characteristic absorption peaks of PAM are displayed at δ = 1.66 ppm for CH2 (a) and δ = 2.23 ppm for CH (b), respectively.40 Owing to the addition of the monomer ATAC, several characteristic peaks of TPAA and CPAA were observed. In the spectra of TPAA and CPAA, peaks due to ATAC were observed at δ = 3.27 ppm (Hc), δ = 1.36 ppm (Hd), δ = 3.34 ppm (He) and δ = 3.13 ppm (Hf).31,41 Moreover, chemical shifts due to CH2 (a) and CH (b) were observed in the spectra of TPAA and CPAA. Because of the grafting of ATAC, the chemical structures of TPAA and CPAA were different from that of PAM, which thus resulted in a chemical shift. The above 1H NMR spectral analyses indicated that TPAA and CPAA were successfully formed by copolymerization of AM and ATAC. However, several subtle differences between TPAA and CPAA should not be ignored and were vital for the formation of the microblock structure. Four additional peaks (δ = 2.68 ppm, δ = 3.03 ppm, δ = 3.40 ppm and δ = 3.74 ppm) marked with triangular symbols appeared in the 1H NMR spectrum of CPAA, whereas these did not appear in the 1H NMR spectrum of TPAA. Besides, the intensity of the peak at 1.99 ppm was high in the spectrum of CPAA but became low in that of TPAA. The difference between TPAA and CPAA was connected to their stereochemical properties. Because of the formation of the cationic microblocks in TPAA, the chemical environments of the protons in the chemical groups (CH, CH2–N+, N+–(CH3)3) in the TPAA polymer chain became identical, and only one resonance peak was observed for each group in principle.42 However, the random distribution of the cationic monomer ATAC in CPAA generated a different chemical environment from that in TPAA. Thus, individual split proton peaks with low intensity were observed for each group in CPAA. This phenomenon was in accordance with the analytical results based on the association constant (KM) and TG/DSC analysis, which further confirmed that the cationic microblock structure was successfully synthesized in TPAA.
 |
| | Fig. 7 1H NMR spectra of (a) PAM, (b) CPAA and (c) TPAA. | |
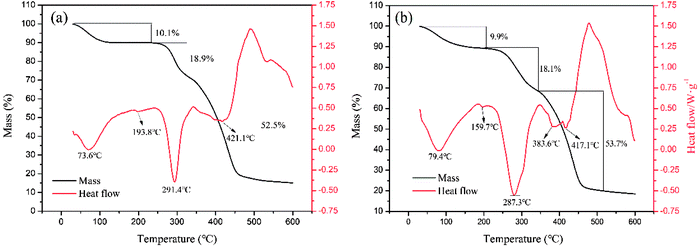
3.4.3. TG/DSC analysis. Fig. 8 shows the TGA thermographs of the polymers, in which three stages of weight loss were observed. The loss of absorbed moisture in the polymers (CPAA: 10.1 wt%, TPAA: 9.9 wt%) occurred within the temperature range of 30–195 °C.43 The thermal decomposition of the imine in the amide groups (CPAA: 18.9 wt%, TPAA: 18.1 wt%) occurred between the temperatures of 195 and 350 °C.44 Carbonization of the polymeric backbone and the decomposition of N+–(CH3)3 groups (CPAA: 52.5 wt%, TPAA: 53.7 wt%) were observed in the range of 350–520 °C.45 Obviously, double hump-like heat absorption peaks (383.6 and 417.1 °C) were observed for TPAA, whereas only one absorption peak (421.1 °C) was observed for CPAA. Because there were two different structural blocks (ATAC and AM blocks) in the TPAA polymer chain, their decomposition generated two different heat absorption peaks. However, the random distribution of ATAA and AM monomers in the CPAA molecular chain severely hindered the formation of the microblock fragments, and hence only a single absorption peak was observed. The results of thermal analysis provided another proof of the formation of the ATAC microblock structure in the TPAA polymer chain.
 |
| | Fig. 8 Thermogravimetric curves of (a) CPAA and (b) TPAA. | |
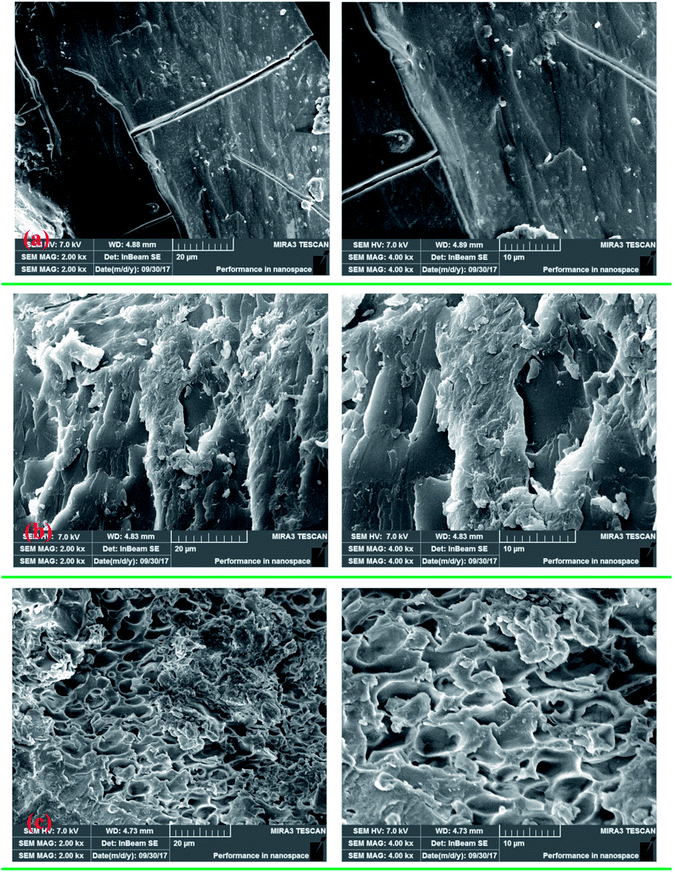
3.4.4. SEM of polymers. SEM images of PAM, CPAA and TPAA were obtained, as displayed in Fig. 9, to investigate their amorphous morphology and intuitively observe visualized surface information for the polymers. It was evident that the polymers displayed different surface morphologies. As shown in Fig. 9(a), PAM had a smooth and regular surface morphology similar to that in a previous study.46 After the grafting of DMC on AM, CPAA and TPAA had rough and coarse surface morphologies, which were significantly different from that of PAM. The reason for this change was that the introduction of ATAC into the AM chain destroyed the original structure of PAM and thus resulted in a porous and rough surface morphology with an irregular structure. Moreover, CPAA displayed a multilayered folded structure with a less porous surface, whereas TPAA had an evident macroporous structure with a rough and coarse surface after the US-initiated template copolymerization. The difference in surface morphology between CPAA and TPAA was caused by the formation of the cationic microblock structure and the use of US-initiated template copolymerization. The template tightly bound the cationic monomers and occupied a certain spatial location in the initial phase of formation of the cationic microblock structure. Then, with the removal of the template, a certain pore formed at the original position of the template, whereby the porosity of TPAA was significantly increased. Thus, a more ragged and macroporous surface morphology was observed for TPAA. In addition, US-initiated copolymerization has been demonstrated to be a useful method for modifying and increasing the surface porosity of prepared polymers.22 According to the results of previous studies, TPAA with a porous structure would have a huge surface area, which could enhance its water solubility and improve its flocculation performance.35,39
 |
| | Fig. 9 SEM micrographs of (a) PAM, (b) CPAA and (c) TPAA. | |
4. Flocculation performance
4.1. Effect of flocculant dosage
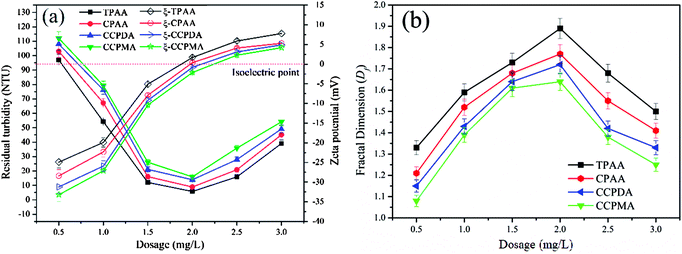
In a flocculation process, the flocculant dosage and pH of the wastewater are the two usual main factors used to evaluate the flocculation performance of the flocculants.47 In this study, the flocculation performance of CPAA and TPAA, as well as that of commercial flocculants (CCPDA and CCPMA), was examined and compared in terms of residual turbidity and floc fractal dimension (Df) at various dosages and pH values. As shown in Fig. 10, the residual turbidity exhibited a similar variation trend of initially decreasing and then rapidly increasing with an increase in the polymer dosage from 0.5 mg L−1 to 3.5 mg L−1, but the behavior of the Df value was exactly the opposite. The minimum residual turbidity and maximum Df value, namely, 5.8 NTU and 1.89, 8.9 NTU and 1.77, 13.9 NTU and 1.72, and 15.8 NTU and 1.64, were observed for TPAA, CPAA, CCPDA and CCPMA, respectively, at a dosage of 2.0 mg L−1. This phenomenon could be explained by the following reasons. Numerous negatively charged kaolin particles would generate strong charge repulsion, which caused the kaolin wastewater system to become more stable and thus led to higher turbidity. At low flocculant dosages, insufficient positive charges were available to neutralize the kaolin colloids, as well as inadequate surface adhesion to intercept suspended kaolin particles.48 Consequently, a sufficient dose of the cationic flocculant was urgently required to neutralize the negatively charged kaolin particles and adsorb them. However, with an excessive flocculant dosage, suspended kaolin particles were surrounded by cationic polymers, which resulted in a caking effect, and the electrostatic repulsion between fine aggregates also increased.49 As a result, the fine aggregates became more unstable and decomposed to form a fluffy and uncompacted floc structure with a low Df value, as shown in Fig. 10(b). Moreover, TPAA displayed superior flocculation performance, in terms of lower residual turbidity and a higher Df value, than the other three flocculants (CPAA, CCPDA and CCPMA) over the entire dosage range. The excellent flocculation performance of TPAA was attributed to the cationic microblocks. Owing to the formation of cationic microblocks in the polymer chain of TPAA, its charge neutralization and patching abilities were greatly enhanced (TPAA had the highest zeta potential value among the flocculants listed in Fig. 10(a)). Therefore, increasing numbers of negatively charged kaolin particles were neutralized and thoroughly destabilized by the cationic microblocks and thus formed large and compact flocs. In addition, the cationic microblocks in TPAA generated a ragged and macroporous surface morphology, which was helpful for the rapid dissolution of the polymer chain to adsorb and capture more kaolin particles. Consequently, desirable flocculation performance with low residual turbidity and a denser floc structure was observed for TPAA.
 |
| | Fig. 10 Effect of dosage on (a) residual turbidity and zeta potential and (b) floc fractal dimension (Df). | |
4.2. Effect of pH
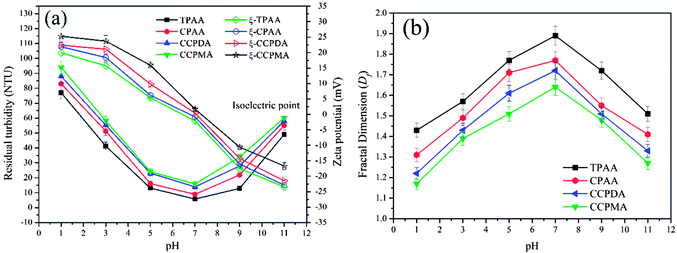
The effect of pH on the flocculation performance was evaluated at a dosage of 2.0 mg L−1, and the results are displayed in Fig. 11. Obviously, different flocculation performance was observed for each flocculant, which indicated that the pH exerted a significant influence on the removal of kaolin particles. At a lower pH, numerous H+ ions generated by the strongly acidic environment would cause the protonation of amino groups (NH3+), as well as strong charge repulsion between kaolin particles, and thus lessen the charge neutralization and adsorption bridging ability.50 Consequently, a deterioration in flocculation performance, with higher residual turbidity and a lower Df value, occurred. Conversely, a higher pH increased the concentration of charged hydroxide ions (OH−) and caused the deprotonation of NH2 groups, which also had adverse effects with respect to the enhancement of the charge neutralization and adsorption bridging ability of the flocculants.51 After the addition of the flocculants, the zeta potential of the supernatant significantly increased, which indicated that charge neutralization played an important role in the flocculation process. Moreover, it was found that TPAA exhibited the most prominent flocculation performance (the lowest residual turbidity of 5.8 NTU, and the highest Df value of 1.89) among the flocculants over the entire pH range. Owing to the cationic microblocks in the TPAA molecular chain, the charge neutralization and patching ability was greatly increased, whereby the zeta potential of the supernatant treated with TPAA was the highest among the four flocculants. During the flocculation process, more negatively charged kaolin particles were neutralized completely for the next steps of adsorption and bridging. Besides, the cationic microblocks would result in strong repulsion, which was more favorable for the stretching and extension of the polymer chain and thus improved the bridging effect.52 In these conditions, kaolin particles were captured and anchored by the molecular chain of TPAA to form a large and compact floc structure. Finally, TPAA was suitable over a wider pH range from 5.0 to 9.0, in which TPAA displayed higher flocculation efficiency for the removal of turbidity due to kaolin.
 |
| | Fig. 11 Effect of pH on (a) residual turbidity and zeta potential and (b) floc fractal dimension (Df). | |
4.3. Effect of flocculants on settling behavior of kaolin
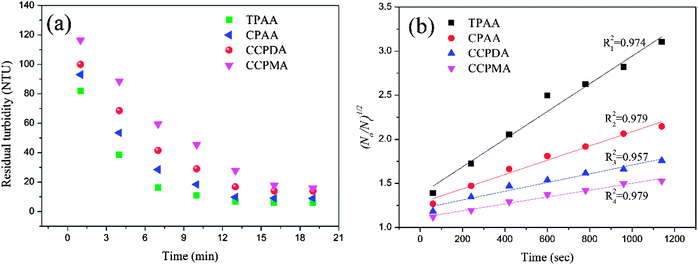
As previous studies revealed, aspects of the settling behavior of kaolin such as the floc size and floc kinetic can be used as acceptable indices to evaluate the flocculation performance and efficiency of flocculants.53,54 In general, it was suggested that a higher floc kinetic and a large floc size corresponded to excellent flocculation ability.55 Flocs with a small size and a low floc kinetic would become more mobile and randomly distributed in wastewater, which would thus increase the difficulty of separation and reduce the flocculation efficiency. Therefore, it was significant to investigate the floc kinetic and floc size after flocculation under the optimal flocculation conditions (dosage of 2.0 mg L−1 and pH of 7.0), and the results are illustrated in Fig. 12 and 13.
 |
| | Fig. 12 (a) Variations in residual turbidity and (b) (N0/Nt)1/2 as a function of settling time for different flocculants. | |
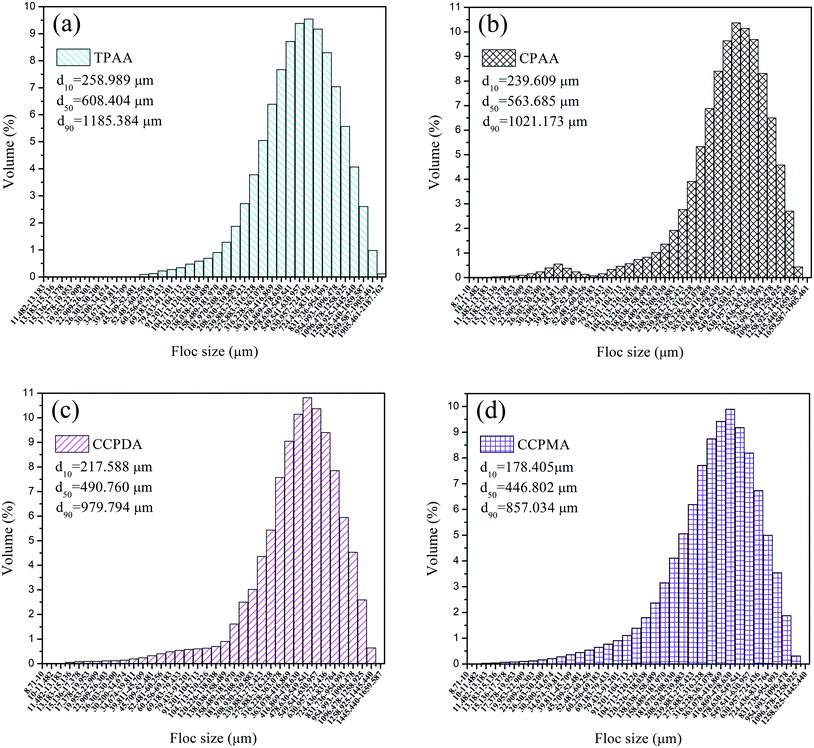 |
| | Fig. 13 Size distribution of kaolin floc formed by (a) TPAA, (b) CPAA, (c) CCPDA and (d) CCPMA. | |
As shown in Fig. 12(a), similar variations in the residual turbidity of kaolin, which rapidly decreased at first and then slowly declined to a minimum value, were observed for the four flocculants. However, the turbidity of kaolin treated with TPAA decreased sharply during the first 7 min, which was associated with the largest slope (kN0 = 15.86 × 10⁻⁴ s−1) among the flocculants. The above phenomenon suggested that the cationic microblock structure in TPAA could greatly improve the flocculation performance. The strong charge neutralization and patching ability generated by the cationic microblocks could attract and thoroughly neutralize the negatively charged kaolin particles and thereby cause kaolin colloids to lose their stability for the next flocculation step of adsorption and bridging.56 Besides, the cationic microblocks in TPAA would lead to strong electrostatic repulsion, which is favorable for the stretching and extension of polymer chains.52 In this case, numerous kaolin particles would be intercepted efficiently and anchored on the polymer chain of TPAA to aggregate and form a large and compact floc structure. Therefore, the residual turbidity of the kaolin wastewater conditioned by TPAA decreased rapidly, and desirable flocculation performance was achieved (Table 2).
Table 2 Flocculation kinetics (kN0) for the four flocculants (TPAA, CPAA, CCPDA and CCPMA)
| Flocculant |
Flocculation kinetics kN0 (×10−4 s−1) |
R2 |
| TPAA |
15.86 |
0.974 |
| CPAA |
8.21 |
0.979 |
| CCPDA |
5.24 |
0.957 |
| CCPMA |
3.78 |
0.979 |
Fig. 13 illustrates the size distribution after flocculation of kaolin flocs formed by TPAA, CPAA, CCPDA and CCPMA. The floc size d50 (median equivalent volumetric diameter) was selected as the evaluation index, and the results showed that the d50 values for TPAA, CPAA, CCPDA and CCPMA were 608.404, 563.685, 490.760, and 446.802 μm, respectively. Clearly, TPAA gave rise to a larger floc size than the other three flocculants, which indicated that TPAA was superior in the separation and removal of kaolin. The large floc size was ascribed to the cationic microblocks in TPAA. On the one hand, the cationic microblocks could lead to strong charge neutralization and patching ability, and hence TPAA could neutralize more negatively charged kaolin particles to form large and compact flocs. On the other hand, the strong electrostatic repulsion generated by the cationic microblocks was favorable for the extension of the molecular chain. Thus, the bridging ability of TPAA was greatly enhanced, and a large kaolin floc size was attained.
4.4. FTIR analysis of the formed kaolin flocs
In order to analyze the interaction between the flocculants and kaolin particles and further understand the mechanism involved in the flocculation process, the FTIR spectra of flocs generated by kaolin + TPAA and kaolin + CPAA were compared. As shown in Fig. 14, the characteristic absorption peaks of kaolin particles were observed at 1118 cm−1 and 556 cm−1, which were ascribed to vibrations of Si–O and Si–O–Al groups, respectively.57,58 After flocculation, these absorption peaks both appeared in the FTIR spectra of kaolin + TPAA and kaolin + CPAA. Moreover, the characteristic absorption peaks of TPAA and CPAA were all observed in the FTIR spectra of kaolin + TPAA and kaolin + CPAA. For example, the peaks at 2920 cm−1, 1661 cm−1, 1543 cm−1 and 964 cm−1 were assigned to CH3, C![[double bond, length as m-dash]](https://www.rsc.org/images/entities/char_e001.gif) O, NH and N+–(CH3)3 groups, respectively. The above results indicated the successful occurrence of flocculation between kaolin particles and the flocculants, as well as the removal of kaolin particles from water. However, new chemical bonds were not observed in a comparison of the FTIR spectra of kaolin, kaolin + TPAA and kaolin + CPAA, which indicated that a chemical reaction did not occur between kaolin and the flocculants, and the flocs were mainly formed by electrostatic interaction, patching and bridging.
O, NH and N+–(CH3)3 groups, respectively. The above results indicated the successful occurrence of flocculation between kaolin particles and the flocculants, as well as the removal of kaolin particles from water. However, new chemical bonds were not observed in a comparison of the FTIR spectra of kaolin, kaolin + TPAA and kaolin + CPAA, which indicated that a chemical reaction did not occur between kaolin and the flocculants, and the flocs were mainly formed by electrostatic interaction, patching and bridging.
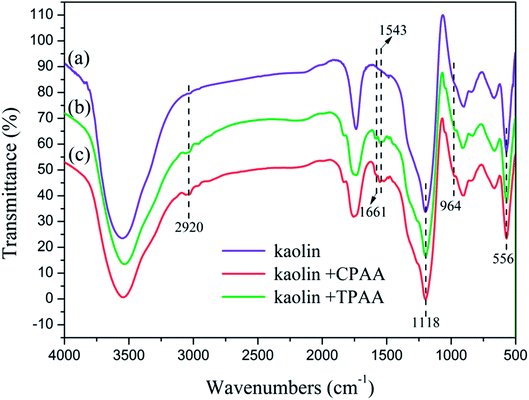 |
| | Fig. 14 FTIR spectra of kaolin particles and flocs. | |
5. Flocculation mechanism
On the basis of the investigation of the zeta potential, floc size and fractal dimension, and floc kinetic and the evaluation of the flocculation performance for kaolin, a possible flocculation mechanism for the templated polymer TPAA was proposed, as shown in Fig. 15. It is more acceptable and straightforward to understand the flocculation mechanism from the following aspects: (1) the charge neutralization and patching ability of TPAA was greatly enhanced owing to the formation of cationic microblocks in TPAA. Thus, negatively charged kaolin particles were neutralized completely and hence lost their colloidal stability. Besides, electrostatic patching was also more beneficial for the occurrence of the desired flocculation, because the adsorption of a polymer with a cationic microblock structure onto local sites of particles caused patches of local charge reversal and resulted in positive–negative attraction between the particles. (2) The cationic microblocks were helpful for improving the bridging effect, because the strong charge repulsion generated by the cationic microblocks was favorable for stretching and extension of the polymer chain. (3) The FTIR analysis of the kaolin flocs that formed confirmed that charge neutralization and bridging were dominant in the kaolin flocculation process. (4) Owing to the enhanced charge neutralization and bridging effect of the flocculant TPAA with its cationic microblock structure, numerous negatively charged kaolin particles were neutralized and adsorbed to aggregate and form large and compact flocs. These large and compact flocs contributed greatly to the achievement of a rapid settling rate and desirable flocculation performance in the removal and separation of kaolin, which thus decreased the turbidity due to kaolin.
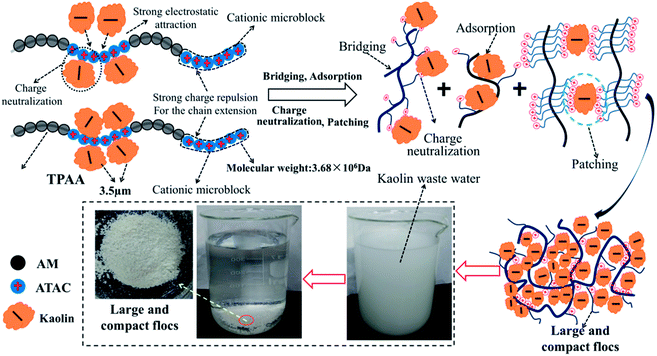 |
| | Fig. 15 Possible flocculation mechanism of TPAA. | |
6. Conclusions
A new cationic flocculant, namely, TPAA, with a cationic microblock structure was successfully prepared for the treatment of high-turbidity wastewater. US-initiated template polymerization was employed to synthesize the templated copolymer TPAA using AM and ATAC as the monomers and NaPAA as the template. The conditions that affected the copolymerization to form TPAA were investigated, and the optimized conditions were an ultrasound power of 200 W, an ultrasound time of 15 min, an initiator concentration of 0.06 wt‰, a pH of 4.5, an mAM![[thin space (1/6-em)]](https://www.rsc.org/images/entities/char_2009.gif) :
:![[thin space (1/6-em)]](https://www.rsc.org/images/entities/char_2009.gif) mATAC ratio of 3
mATAC ratio of 3![[thin space (1/6-em)]](https://www.rsc.org/images/entities/char_2009.gif) :
:![[thin space (1/6-em)]](https://www.rsc.org/images/entities/char_2009.gif) 1 and an nNaPAA
1 and an nNaPAA![[thin space (1/6-em)]](https://www.rsc.org/images/entities/char_2009.gif) :
:![[thin space (1/6-em)]](https://www.rsc.org/images/entities/char_2009.gif) nATAC ratio of 1. Under these conditions, an intrinsic viscosity of 9.88 dL g−1 and a conversion of 99.7% were achieved using TPAA. The structural properties of TPAA were characterized by analytical techniques such as FTIR, 1H NMR, TGA and SEM, and the results indicated the successful formation of the cationic microblock structure. Moreover, a type I (zip) template polymerization mechanism was determined from the results of analyses based on KM (13.97), Cv (9.51%) and Rp (0.105 mol L−1 min), which also provided another convincing proof of the generation of the cationic microblock structure. A flocculation test involving the treatment of high-turbidity water confirmed that the microblock structure in TPAA could significantly increase its charge neutralization, patching and bridging ability, which contributed greatly to excellent flocculation performance (turbidity: 5.8 NTU, Df: 1.89, floc size d50: 608.404 μm and floc kinetic: 15.86 × 10⁻⁴ s−1). FTIR analysis of the kaolin flocs that formed indicated that the cationic microblock structure could generate a strong and powerful bond between TPAA and kaolin particles, but not chemical bonds, via the effect of charge neutralization, patching and bridging. In this case, the flocs generated by TPAA were dense and large, which thus resulted in a rapid settling rate for the removal of kaolin particles and the reduction of their high turbidity.
nATAC ratio of 1. Under these conditions, an intrinsic viscosity of 9.88 dL g−1 and a conversion of 99.7% were achieved using TPAA. The structural properties of TPAA were characterized by analytical techniques such as FTIR, 1H NMR, TGA and SEM, and the results indicated the successful formation of the cationic microblock structure. Moreover, a type I (zip) template polymerization mechanism was determined from the results of analyses based on KM (13.97), Cv (9.51%) and Rp (0.105 mol L−1 min), which also provided another convincing proof of the generation of the cationic microblock structure. A flocculation test involving the treatment of high-turbidity water confirmed that the microblock structure in TPAA could significantly increase its charge neutralization, patching and bridging ability, which contributed greatly to excellent flocculation performance (turbidity: 5.8 NTU, Df: 1.89, floc size d50: 608.404 μm and floc kinetic: 15.86 × 10⁻⁴ s−1). FTIR analysis of the kaolin flocs that formed indicated that the cationic microblock structure could generate a strong and powerful bond between TPAA and kaolin particles, but not chemical bonds, via the effect of charge neutralization, patching and bridging. In this case, the flocs generated by TPAA were dense and large, which thus resulted in a rapid settling rate for the removal of kaolin particles and the reduction of their high turbidity.
Conflicts of interest
There are no conflicts to declare.
Acknowledgements
The authors are grateful for the financial support provided by the National Natural Science Foundation of China (Project No. 21477010) and China Postdoctoral Science Foundation funded project (Project No. 2017M622970).
References
- J. Ma, J. Shi, H. Ding, G. Zhu, K. Fu and X. Fu, Chem. Eng. J., 2017, 312, 20–29 CrossRef CAS.
- A. L. Mather and R. L. Johnson, J. Hydrol., 2015, 530, 751–761 CrossRef.
- R. Das, S. Ghorai and S. Pal, Chem. Eng. J., 2013, 229, 144–152 CrossRef CAS.
- C. Hu, S. Lo, C. Chang, F. Chen, Y. Wu and J. Ma, Sep. Purif. Technol., 2013, 104, 322–326 CrossRef CAS.
- G. Muthuraman and S. Sasikala, J. Ind. Eng. Chem., 2014, 20, 1727–1731 CrossRef CAS.
- M. Huang, Y. Wang, J. Cai, J. Bai, H. Yang and A. Li, Water Res., 2016, 98, 128–137 CrossRef CAS PubMed.
- W. Ren, A. Zhang, S. Qin and Z. Li, Carbohydr. Polym., 2016, 144, 238–244 CrossRef CAS PubMed.
- X. Huang, B. Gao, Y. Sun, Q. Yue, Y. Wang, Q. Li and X. Xu, Sep. Purif. Technol., 2017, 173, 209–217 CrossRef CAS.
- B. Xu, C. Zheng, H. Zheng, Y. Wang, C. Zhao, C. Zhao and S. Zhang, RSC Adv., 2017, 7, 47029–47037 RSC.
- A. Ariffin, R. S. A. Shatat, A. R. N. Norulaini and A. K. M. Omar, Desalination, 2005, 173, 201–208 CrossRef CAS.
- T. Nasim and A. Bandyopadhyay, Sep. Purif. Technol., 2012, 88, 87–94 CrossRef CAS.
- J. Ma, K. Fu, L. Jiang, L. Ding, Q. Guan, S. Zhang, H. Zhang, J. Shi and X. Fu, Sep. Purif. Technol., 2017, 181, 201–212 CrossRef CAS.
- F. Yang, X. Wang, M. Li, X. Liu, X. Zhao, D. Zhang, Y. Zhang, J. Yang and Y. Li, Acc. Chem. Res., 2016, 49, 606–615 CrossRef CAS PubMed.
- M. Guli, E. M. Lambert, M. Li and S. Mann, Angew. Chem., 2010, 49, 520–523 CrossRef CAS PubMed.
- X. Xiao, H. Song, S. Lin, Y. Zhou, X. Zhan, Z. Hu, Q. Zhang, J. Sun, B. Yang, T. Li, L. Jiao, J. Zhou, J. Tang and Y. Gogotsi, Nat. Commun., 2016, 7, 11296 CrossRef CAS PubMed.
- Y. Wang, A. S. Angelatos and F. Caruso, Chem. Mater., 2008, 20, 848–858 CrossRef CAS.
- S. Połowiński, Prog. Polym. Sci., 2002, 27, 537–577 CrossRef.
- B. Bolto and J. Gregory, Water Res., 2007, 41, 2301–2324 CrossRef CAS PubMed.
- M. Constantin, I. Mihalcea, I. Oanea, V. Harabagiu and G. Fundueanu, Carbohydr. Polym., 2011, 84, 926–932 CrossRef CAS.
- J. Li, Y. Li, S. Niu and N. Li, Ultrason. Sonochem., 2017, 36, 277–285 CrossRef CAS PubMed.
- B. A. Bhanvase, D. V. Pinjari, S. H. Sonawane, P. R. Gogate and A. B. Pandit, Ultrason. Sonochem., 2012, 19, 97–103 CrossRef CAS PubMed.
- J. Li, Y. Li, Y. Song, S. Niu and N. Li, Ultrason. Sonochem., 2017, 39, 853–862 CrossRef CAS PubMed.
- H. Shang, J. Liu, Y. Zheng and L. Wang, J. Appl. Polym. Sci., 2010, 111, 1594–1599 CrossRef.
- H. Ren, W. Chen, Y. Zheng and Z. Luan, React. Funct. Polym., 2007, 67, 601–608 CrossRef CAS.
- X. Wu, W. R. Carroll and K. D. Shimizu, Chem. Mater., 2008, 20, 4335–4346 CrossRef CAS.
- Z. Hua, S. Zhou and M. Zhao, Biosens. Bioelectron., 2009, 25, 615–622 CrossRef CAS PubMed.
- Y. X. Zhao, S. Phuntsho, B. Y. Gao, X. Huang, Q. B. Qi, Q. Y. Yue, Y. Wang, J. H. Kim and H. K. Shon, Environ. Sci. Technol., 2013, 47, 12966–12975 CrossRef CAS PubMed.
- P. Jarvis, B. Jefferson and S. A. Parsons, Environ. Sci. Technol., 2005, 39, 2307–2314 CrossRef CAS PubMed.
- Y. Fang, X. Liu, X. Liang, H. Liu, X. Gao and Z. Zhang, Appl. Energy, 2014, 132, 551–556 CrossRef CAS.
- S. K. Ooi and S. Biggs, Ultrason. Sonochem., 2000, 7, 125–133 CrossRef CAS PubMed.
- Y. Liao, H. Zheng, L. Qian, Y. Sun, L. Dai and W. Xue, Ind. Eng. Chem. Res., 2014, 53, 11193–11203 CrossRef CAS.
- S. A. Seabrook and R. G. Gilbert, Polymer, 2007, 48, 4733–4741 CrossRef CAS.
- K. B. Thapa, Y. Qi, S. A. Clayton and A. F. A. Hoadley, Water Res., 2009, 43, 623–634 CrossRef CAS PubMed.
- Y. Bao, J. Ma and N. Li, Carbohydr. Polym., 2011, 84, 76–82 CrossRef CAS.
- Y. Sun, C. Zhu, W. Sun, Y. Xu, X. Xiao, H. Zheng, H. Wu and C. Liu, Carbohydr. Polym., 2017, 164, 222–232 CrossRef CAS PubMed.
- T. Chen, Q. Fang, Q. Zhong, Y. Chen and J. Wang, Polymers, 2015, 7, 909–920 CrossRef CAS.
- J. Li, L. Zhang, J. Gu, Y. Sun and X. Ji, RSC Adv., 2015, 5, 19859–19864 RSC.
- S. Gou, Q. Zhang, C. Yang, Q. Li, S. Xu, Y. Wu and Q. Guo, RSC Adv., 2016, 6, 76696–76706 RSC.
- X. Li, H. Zheng, Y. Wang, Y. Sun, B. Xu and C. Zhao, Chem. Eng. J., 2017, 319, 119–130 CrossRef CAS.
- S. Gou, S. Li, M. Feng, Q. Zhang, Q. Pan, J. Wen, Y. Wu and Q. Guo, Ind. Eng. Chem. Res., 2017, 56, 942–951 CrossRef CAS.
- A. Pourjavadi, S. M. Fakoorpoor and S. H. Hosseini, Carbohydr. Polym., 2013, 93, 506–511 CrossRef CAS PubMed.
- Z. Abdollahi, M. Frounchi and S. Dadbin, J. Ind. Eng. Chem., 2011, 17, 580–586 CrossRef CAS.
- J. Li, C. Hu, J. Shao, H. Li, P. Li, X. Li and W. He, Polymer, 2017, 119, 152–159 CrossRef CAS.
- Z. L. Yang, B. Y. Gao, C. X. Li, Q. Y. Yue and B. Liu, Chem. Eng. J., 2010, 161, 27–33 CrossRef CAS.
- H. Zheng, J. Ma, C. Zhu, Z. Zhang, L. Liu, Y. Sun and X. Tang, Sep. Purif. Technol., 2014, 123, 35–44 CrossRef CAS.
- H. Zheng, Y. Sun, J. Guo, F. Li, W. Fan, Y. Liao and Q. Guan, Ind. Eng. Chem. Res., 2014, 53, 2572–2582 CrossRef CAS.
- Z. Yang, K. Ren, E. Guibal, S. Jia, J. Shen, X. Zhang and W. Yang, Chemosphere, 2016, 161, 482–490 CrossRef CAS PubMed.
- Z. Yang, Y. Shang, Y. Lu, Y. Chen, X. Huang, A. Chen, Y. Jiang, W. Gu, X. Qian, H. Yang and R. Cheng, Chem. Eng. J., 2011, 172, 287–295 CrossRef CAS.
- Z. Yang, H. Yang, Z. Jiang, T. Cai, H. Li, H. Li, A. Li and R. Cheng, J. Hazard. Mater., 2013, 255, 36–45 CrossRef PubMed.
- L. You, L. Song, A. Wang, F. Lu and Q. Zhang, Colloids Surf., A, 2017, 520, 841–849 CrossRef CAS.
- M. K. R. Konduri and P. Fatehi, Colloids Surf., A, 2017, 530, 20–32 CrossRef CAS.
- C. Zhao, H. Zheng, B. Gao, Y. Liu, J. Zhai, S. Zhang and B. Xu, Ultrason. Sonochem., 2018, 42, 31–41 CrossRef CAS PubMed.
- J. Ma, K. Fu, X. Fu, Q. Guan, L. Ding, J. Shi, G. Zhu, X. Zhang, S. Zhang and L. Jiang, Sep. Purif. Technol., 2017, 182, 134–143 CrossRef CAS.
- Y. X. Zhao, B. Y. Gao, H. K. Shon, J. H. Kim, Q. Y. Yue and Y. Wang, Sep. Purif. Technol., 2011, 81, 332–338 CrossRef CAS.
- R. Mao, Y. Wang, B. Zhang, W. Xu, M. Dong and B. Gao, Desalination, 2013, 314, 161–168 CrossRef CAS.
- Y. Adachi, L. Feng and M. Kobayashi, Colloids Surf., A, 2015, 471, 38–44 CrossRef CAS.
- A. Tironi, M. A. Trezza, E. F. Irassar and A. N. Scian, Procedia Mater. Sci., 2012, 1, 343–350 CrossRef CAS.
- B. Y. Du, Z. Cao, Z. B. Li, A. X. Mei, X. H. Zhang, J. J. Nie, J. T. Xu and Z. Q. Fan, Langmuir, 2009, 25, 12367–12373 CrossRef CAS PubMed.
Footnote |
| † Electronic supplementary information (ESI) available. See DOI: 10.1039/c8ra02006j |
|
| This journal is © The Royal Society of Chemistry 2018 |
Click here to see how this site uses Cookies. View our privacy policy here.  Open Access Article
 ab,
Huaili Zheng*ab,
Xiaomin Tangbc,
Xinyu Zhengb,
Shuang Liuab,
Qiang Sunb and
Moxi Wangb
![[thin space (1/6-em)]](https://www.rsc.org/images/entities/char_2009.gif) :
:![[thin space (1/6-em)]](https://www.rsc.org/images/entities/char_2009.gif) mATAC and nNaPAA
mATAC and nNaPAA![[thin space (1/6-em)]](https://www.rsc.org/images/entities/char_2009.gif) :
:![[thin space (1/6-em)]](https://www.rsc.org/images/entities/char_2009.gif) nATAC values were investigated. The properties of the polymers were characterized by Fourier transform infrared spectroscopy (FTIR), 1H nuclear magnetic resonance spectroscopy (1H NMR), thermogravimetric analysis (TGA) and scanning electron microscopy (SEM). The results indicated the successful formation of a cationic microblock structure in TPAA. In addition, TPAA displayed favorable thermal decomposition properties and a rough and coarse surface morphology, as shown by analyses using TGA and SEM, respectively. Moreover, a zip (type I) template polymerization mechanism was identified via analyses of the association constant (KM), conversion (Cv) and polymerization rate (Rp). The flocculation performance of the templated copolymer TPAA was evaluated by treating high-turbidity water. According to the results for the zeta potentials and FTIR spectra of the generated flocs, it was indicated that the cationic microblocks in the templated copolymer could greatly enhance its charge neutralization, patching and bridging ability, and therefore excellent flocculation performance (residual turbidity: 5.8 NTU, Df: 1.89, floc size d50: 608.404 μm and floc kinetic: 15.86 × 10⁻⁴ s−1) for treating high-turbidity water was achieved.
nATAC values were investigated. The properties of the polymers were characterized by Fourier transform infrared spectroscopy (FTIR), 1H nuclear magnetic resonance spectroscopy (1H NMR), thermogravimetric analysis (TGA) and scanning electron microscopy (SEM). The results indicated the successful formation of a cationic microblock structure in TPAA. In addition, TPAA displayed favorable thermal decomposition properties and a rough and coarse surface morphology, as shown by analyses using TGA and SEM, respectively. Moreover, a zip (type I) template polymerization mechanism was identified via analyses of the association constant (KM), conversion (Cv) and polymerization rate (Rp). The flocculation performance of the templated copolymer TPAA was evaluated by treating high-turbidity water. According to the results for the zeta potentials and FTIR spectra of the generated flocs, it was indicated that the cationic microblocks in the templated copolymer could greatly enhance its charge neutralization, patching and bridging ability, and therefore excellent flocculation performance (residual turbidity: 5.8 NTU, Df: 1.89, floc size d50: 608.404 μm and floc kinetic: 15.86 × 10⁻⁴ s−1) for treating high-turbidity water was achieved.
![[thin space (1/6-em)]](https://www.rsc.org/images/entities/char_2009.gif) :
:![[thin space (1/6-em)]](https://www.rsc.org/images/entities/char_2009.gif) mATAC and nNaPAA
mATAC and nNaPAA![[thin space (1/6-em)]](https://www.rsc.org/images/entities/char_2009.gif) :
:![[thin space (1/6-em)]](https://www.rsc.org/images/entities/char_2009.gif) nATAC values, depending on the intrinsic viscosity and conversion; (3) determine the template polymerization mechanism by investigating the association constant (KM), conversion (Cv) and polymerization rate (Rp); (4) characterize the structural properties of the polymers by employing FTIR, 1H NMR, TGA and scanning electron microscopy (SEM); (5) evaluate the flocculation performance of the polymers in terms of residual turbidity, floc size, recoverability, fractal dimension and settling behaviors; and (6) discuss the flocculation mechanism via analyses of the zeta potentials and FTIR spectra of the formed flocs.
nATAC values, depending on the intrinsic viscosity and conversion; (3) determine the template polymerization mechanism by investigating the association constant (KM), conversion (Cv) and polymerization rate (Rp); (4) characterize the structural properties of the polymers by employing FTIR, 1H NMR, TGA and scanning electron microscopy (SEM); (5) evaluate the flocculation performance of the polymers in terms of residual turbidity, floc size, recoverability, fractal dimension and settling behaviors; and (6) discuss the flocculation mechanism via analyses of the zeta potentials and FTIR spectra of the formed flocs.![[thin space (1/6-em)]](https://www.rsc.org/images/entities/char_2009.gif) :
:![[thin space (1/6-em)]](https://www.rsc.org/images/entities/char_2009.gif) nATAC = 1
nATAC = 1![[thin space (1/6-em)]](https://www.rsc.org/images/entities/char_2009.gif) :
:![[thin space (1/6-em)]](https://www.rsc.org/images/entities/char_2009.gif) 1) and deionized water were added to a 100 mL glass vessel, and the vessel was shaken several times until the reagents dissolved. The total monomer concentration was fixed at 30%. Then, the pH of the above aqueous solution was adjusted to the set value with 0.5 mol L−1 HCl and NaOH. Subsequently, nitrogen was bubbled into the solution for 30 min, and the vessel was sealed immediately after the addition of the initiator VA-044. After the above procedures were performed, the solution was subjected to ultrasonic radiation generated by an ultrasound generator (Sonics Vibra-Cell VCX 500; power: 0–500 W; frequency: 20 kHz; horn type; sonic wave probe: tip diameter = 13 mm, length = 136 mm) for 15 min at room temperature to finish the copolymerization reaction. Finally, the solid product was purified with ethyl alcohol and desiccated in a vacuum oven at 95 °C for 24 h to obtain the final product. On the other hand, the method for the preparation of the randomly distributed copolymer CPAA was similar to that used for TPAA, and the only difference was that no NaPAA was added for CPAA. In addition, polyacrylamide (PAM) was prepared by the above method (US-initiated polymerization) to perform a comparative characterization of the polymers.
1) and deionized water were added to a 100 mL glass vessel, and the vessel was shaken several times until the reagents dissolved. The total monomer concentration was fixed at 30%. Then, the pH of the above aqueous solution was adjusted to the set value with 0.5 mol L−1 HCl and NaOH. Subsequently, nitrogen was bubbled into the solution for 30 min, and the vessel was sealed immediately after the addition of the initiator VA-044. After the above procedures were performed, the solution was subjected to ultrasonic radiation generated by an ultrasound generator (Sonics Vibra-Cell VCX 500; power: 0–500 W; frequency: 20 kHz; horn type; sonic wave probe: tip diameter = 13 mm, length = 136 mm) for 15 min at room temperature to finish the copolymerization reaction. Finally, the solid product was purified with ethyl alcohol and desiccated in a vacuum oven at 95 °C for 24 h to obtain the final product. On the other hand, the method for the preparation of the randomly distributed copolymer CPAA was similar to that used for TPAA, and the only difference was that no NaPAA was added for CPAA. In addition, polyacrylamide (PAM) was prepared by the above method (US-initiated polymerization) to perform a comparative characterization of the polymers.


![[thin space (1/6-em)]](https://www.rsc.org/images/entities/char_2009.gif) :
:![[thin space (1/6-em)]](https://www.rsc.org/images/entities/char_2009.gif) mATAC = 3
mATAC = 3![[thin space (1/6-em)]](https://www.rsc.org/images/entities/char_2009.gif) :
:![[thin space (1/6-em)]](https://www.rsc.org/images/entities/char_2009.gif) 1 and nNaPAA
1 and nNaPAA![[thin space (1/6-em)]](https://www.rsc.org/images/entities/char_2009.gif) :
:![[thin space (1/6-em)]](https://www.rsc.org/images/entities/char_2009.gif) nATAC = 1
nATAC = 1![[thin space (1/6-em)]](https://www.rsc.org/images/entities/char_2009.gif) :
:![[thin space (1/6-em)]](https://www.rsc.org/images/entities/char_2009.gif) 1. As depicted in Fig. 3(a), it was shown that an ultrasound power of 200 W was more favorable for copolymerization, whereas an ultrasound power of higher or lower than 200 W was unsatisfactory for copolymerization. At a lower ultrasound power, the initiation energy was not sufficiently high to generate enough free radicals, and the collision of monomers was inefficient. As a result, the copolymerization efficiency was reduced, which thus led to decreases in the intrinsic viscosity and conversion. In contrast, a higher ultrasound power promoted the cleavage of the initiator to generate superfluous free radicals within a short time and also resulted in violent collisions of monomers. Thus, chain transfer and chain termination accelerated, and decreases in intrinsic viscosity and conversion occurred.29 Besides, the stronger shear force caused by the swelling and collapse of cavities destroyed and fragmented the polymer chains that formed, which thus led to low intrinsic viscosity. Accordingly, the favorable ultrasound power of 200 W was used in this study to achieve high-efficiency copolymerization.
1. As depicted in Fig. 3(a), it was shown that an ultrasound power of 200 W was more favorable for copolymerization, whereas an ultrasound power of higher or lower than 200 W was unsatisfactory for copolymerization. At a lower ultrasound power, the initiation energy was not sufficiently high to generate enough free radicals, and the collision of monomers was inefficient. As a result, the copolymerization efficiency was reduced, which thus led to decreases in the intrinsic viscosity and conversion. In contrast, a higher ultrasound power promoted the cleavage of the initiator to generate superfluous free radicals within a short time and also resulted in violent collisions of monomers. Thus, chain transfer and chain termination accelerated, and decreases in intrinsic viscosity and conversion occurred.29 Besides, the stronger shear force caused by the swelling and collapse of cavities destroyed and fragmented the polymer chains that formed, which thus led to low intrinsic viscosity. Accordingly, the favorable ultrasound power of 200 W was used in this study to achieve high-efficiency copolymerization.
![[thin space (1/6-em)]](https://www.rsc.org/images/entities/char_2009.gif) :
:![[thin space (1/6-em)]](https://www.rsc.org/images/entities/char_2009.gif) mATAC. When the AM/ATAC mass ratio was 3
mATAC. When the AM/ATAC mass ratio was 3![[thin space (1/6-em)]](https://www.rsc.org/images/entities/char_2009.gif) :
:![[thin space (1/6-em)]](https://www.rsc.org/images/entities/char_2009.gif) 1, the intrinsic viscosity and conversion reached their maximum values of 9.88 dL g−1 and 99.7%, respectively. In the early stage of copolymerization, the number of free radicals and the chance of collisions between monomers were vital to the intrinsic viscosity and conversion of the polymer.35 Because AM has a higher reactivity ratio in comparison with other monomers, a higher AM concentration increased the number of primary free radicals and the chance of collisions, and hence chain propagation and further conversion were more likely to happen. However, an excessive concentration of AM monomer reacted vigorously and thereby accelerated chain transfer and chain termination. As a result, it led to lower intrinsic viscosity and conversion. Therefore, the optimal mass ratio of AM to ATAC was deemed to be 3
1, the intrinsic viscosity and conversion reached their maximum values of 9.88 dL g−1 and 99.7%, respectively. In the early stage of copolymerization, the number of free radicals and the chance of collisions between monomers were vital to the intrinsic viscosity and conversion of the polymer.35 Because AM has a higher reactivity ratio in comparison with other monomers, a higher AM concentration increased the number of primary free radicals and the chance of collisions, and hence chain propagation and further conversion were more likely to happen. However, an excessive concentration of AM monomer reacted vigorously and thereby accelerated chain transfer and chain termination. As a result, it led to lower intrinsic viscosity and conversion. Therefore, the optimal mass ratio of AM to ATAC was deemed to be 3![[thin space (1/6-em)]](https://www.rsc.org/images/entities/char_2009.gif) :
:![[thin space (1/6-em)]](https://www.rsc.org/images/entities/char_2009.gif) 1.
1.![[thin space (1/6-em)]](https://www.rsc.org/images/entities/char_2009.gif) :
:![[thin space (1/6-em)]](https://www.rsc.org/images/entities/char_2009.gif) nATAC on the intrinsic viscosity and conversion while the other factors were constant. It was clear that the intrinsic viscosity and conversion changed greatly at different nNaPAA
nATAC on the intrinsic viscosity and conversion while the other factors were constant. It was clear that the intrinsic viscosity and conversion changed greatly at different nNaPAA![[thin space (1/6-em)]](https://www.rsc.org/images/entities/char_2009.gif) :
:![[thin space (1/6-em)]](https://www.rsc.org/images/entities/char_2009.gif) nATAC values, which indicated that NaPAA had a great effect on the polymerization. The intrinsic viscosity and conversion initially increased, reached their maximum value at nNaPAA
nATAC values, which indicated that NaPAA had a great effect on the polymerization. The intrinsic viscosity and conversion initially increased, reached their maximum value at nNaPAA![[thin space (1/6-em)]](https://www.rsc.org/images/entities/char_2009.gif) :
:![[thin space (1/6-em)]](https://www.rsc.org/images/entities/char_2009.gif) nATAC = 1
nATAC = 1![[thin space (1/6-em)]](https://www.rsc.org/images/entities/char_2009.gif) :
:![[thin space (1/6-em)]](https://www.rsc.org/images/entities/char_2009.gif) 1 and then decreased rapidly with a further increase in nNaPAA
1 and then decreased rapidly with a further increase in nNaPAA![[thin space (1/6-em)]](https://www.rsc.org/images/entities/char_2009.gif) :
:![[thin space (1/6-em)]](https://www.rsc.org/images/entities/char_2009.gif) nATAC. When the anionic polymer NaPAA was added to the reaction system, the cationic monomer ATAC was adsorbed and distributed along the template molecular chain via electrostatic forces. The reaction of the cationic monomers adsorbed on the NaPAA polymer was easily initiated by free radicals with low hindrance, which thus increased the chain propagation and polymer conversion. In contrast, a higher nNaPAA
nATAC. When the anionic polymer NaPAA was added to the reaction system, the cationic monomer ATAC was adsorbed and distributed along the template molecular chain via electrostatic forces. The reaction of the cationic monomers adsorbed on the NaPAA polymer was easily initiated by free radicals with low hindrance, which thus increased the chain propagation and polymer conversion. In contrast, a higher nNaPAA![[thin space (1/6-em)]](https://www.rsc.org/images/entities/char_2009.gif) :
:![[thin space (1/6-em)]](https://www.rsc.org/images/entities/char_2009.gif) nATAC value would reduce the intrinsic viscosity and conversion. Because NaPAA with –COO− groups has high steric hindrance, superfluous NaPAA molecules would wrap the NaPAA polymer to create a cage effect, which would distinctly decrease the chance of collisions with free radicals and inhibit the reaction. As a result, the intrinsic viscosity and conversion of the polymer were both reduced. Therefore, the favorable molar ratio of NaPAA to ATAC was determined to be 1
nATAC value would reduce the intrinsic viscosity and conversion. Because NaPAA with –COO− groups has high steric hindrance, superfluous NaPAA molecules would wrap the NaPAA polymer to create a cage effect, which would distinctly decrease the chance of collisions with free radicals and inhibit the reaction. As a result, the intrinsic viscosity and conversion of the polymer were both reduced. Therefore, the favorable molar ratio of NaPAA to ATAC was determined to be 1![[thin space (1/6-em)]](https://www.rsc.org/images/entities/char_2009.gif) :
:![[thin space (1/6-em)]](https://www.rsc.org/images/entities/char_2009.gif) 1.
1.![[thin space (1/6-em)]](https://www.rsc.org/images/entities/char_2009.gif) :
:![[thin space (1/6-em)]](https://www.rsc.org/images/entities/char_2009.gif) nATAC = 1. The KM value of 13.97 indicated that more than three-quarters of the ATAC molecules were pre-adsorbed and arranged along the molecular chain of the NaPAA polymer to form a precursor of the microblock structure under the electrostatic force between ATAC and NaPAA. When the reaction of the ATAC microblock structure was initiated by the US radiation, the cationic ATAC microblock structure was successfully synthesized. Finally, the desired templated copolymer TPAA characterized by the novel cationic microblock structure was obtained after the template NaPAA was separated with alcohol. On the basis of the above analyses, a possible zip (type I) mechanism was proposed for this template polymerization, as shown in Fig. 4.
nATAC = 1. The KM value of 13.97 indicated that more than three-quarters of the ATAC molecules were pre-adsorbed and arranged along the molecular chain of the NaPAA polymer to form a precursor of the microblock structure under the electrostatic force between ATAC and NaPAA. When the reaction of the ATAC microblock structure was initiated by the US radiation, the cationic ATAC microblock structure was successfully synthesized. Finally, the desired templated copolymer TPAA characterized by the novel cationic microblock structure was obtained after the template NaPAA was separated with alcohol. On the basis of the above analyses, a possible zip (type I) mechanism was proposed for this template polymerization, as shown in Fig. 4.

![[thin space (1/6-em)]](https://www.rsc.org/images/entities/char_2009.gif) :
:![[thin space (1/6-em)]](https://www.rsc.org/images/entities/char_2009.gif) nATAC on (a) conversion (Cv) and (b) Rp at mAM
nATAC on (a) conversion (Cv) and (b) Rp at mAM![[thin space (1/6-em)]](https://www.rsc.org/images/entities/char_2009.gif) :
:![[thin space (1/6-em)]](https://www.rsc.org/images/entities/char_2009.gif) mATAC = 3
mATAC = 3![[thin space (1/6-em)]](https://www.rsc.org/images/entities/char_2009.gif) :
:![[thin space (1/6-em)]](https://www.rsc.org/images/entities/char_2009.gif) 1, pH = 4.5 and T = 30 °C.
1, pH = 4.5 and T = 30 °C.![[double bond, length as m-dash]](https://www.rsc.org/images/entities/char_e001.gif) O groups in AM were observed at 3445 cm−1 and 1668 cm−1, respectively.37 The stretching vibrations of CH3 groups in AM appeared at 2940 cm−1.38 Characteristic peaks of TPAA and CPAA appeared at 1543 cm−1 for NH bending vibrations in ATAC, 1494 cm−1 for CH3 stretching vibrations in –N+–(CH3)3 groups, 964 cm−1 for –N+–(CH3)3 bending vibrations, and 1452 cm−1 for CH2 bending vibrations in –CH2–N+ groups.39 In comparison with PAM, the absorption peaks of AM and ATAC all appeared in the FTIR spectra of TPAA and CPAA, which thus indicated the successful copolymerization of AM and ATAC. Moreover, TPAA and CPAA displayed the same absorption peaks, and new absorption peaks were not discovered for either TPAA or CPAA. Therefore, the conclusion could be drawn that US-initiated template polymerization had no influence on the chemical functional groups of the copolymers.
O groups in AM were observed at 3445 cm−1 and 1668 cm−1, respectively.37 The stretching vibrations of CH3 groups in AM appeared at 2940 cm−1.38 Characteristic peaks of TPAA and CPAA appeared at 1543 cm−1 for NH bending vibrations in ATAC, 1494 cm−1 for CH3 stretching vibrations in –N+–(CH3)3 groups, 964 cm−1 for –N+–(CH3)3 bending vibrations, and 1452 cm−1 for CH2 bending vibrations in –CH2–N+ groups.39 In comparison with PAM, the absorption peaks of AM and ATAC all appeared in the FTIR spectra of TPAA and CPAA, which thus indicated the successful copolymerization of AM and ATAC. Moreover, TPAA and CPAA displayed the same absorption peaks, and new absorption peaks were not discovered for either TPAA or CPAA. Therefore, the conclusion could be drawn that US-initiated template polymerization had no influence on the chemical functional groups of the copolymers.


![[double bond, length as m-dash]](https://www.rsc.org/images/entities/char_e001.gif) O, NH and N+–(CH3)3 groups, respectively. The above results indicated the successful occurrence of flocculation between kaolin particles and the flocculants, as well as the removal of kaolin particles from water. However, new chemical bonds were not observed in a comparison of the FTIR spectra of kaolin, kaolin + TPAA and kaolin + CPAA, which indicated that a chemical reaction did not occur between kaolin and the flocculants, and the flocs were mainly formed by electrostatic interaction, patching and bridging.
O, NH and N+–(CH3)3 groups, respectively. The above results indicated the successful occurrence of flocculation between kaolin particles and the flocculants, as well as the removal of kaolin particles from water. However, new chemical bonds were not observed in a comparison of the FTIR spectra of kaolin, kaolin + TPAA and kaolin + CPAA, which indicated that a chemical reaction did not occur between kaolin and the flocculants, and the flocs were mainly formed by electrostatic interaction, patching and bridging.
![[thin space (1/6-em)]](https://www.rsc.org/images/entities/char_2009.gif) :
:![[thin space (1/6-em)]](https://www.rsc.org/images/entities/char_2009.gif) mATAC ratio of 3
mATAC ratio of 3![[thin space (1/6-em)]](https://www.rsc.org/images/entities/char_2009.gif) :
:![[thin space (1/6-em)]](https://www.rsc.org/images/entities/char_2009.gif) 1 and an nNaPAA
1 and an nNaPAA![[thin space (1/6-em)]](https://www.rsc.org/images/entities/char_2009.gif) :
:![[thin space (1/6-em)]](https://www.rsc.org/images/entities/char_2009.gif) nATAC ratio of 1. Under these conditions, an intrinsic viscosity of 9.88 dL g−1 and a conversion of 99.7% were achieved using TPAA. The structural properties of TPAA were characterized by analytical techniques such as FTIR, 1H NMR, TGA and SEM, and the results indicated the successful formation of the cationic microblock structure. Moreover, a type I (zip) template polymerization mechanism was determined from the results of analyses based on KM (13.97), Cv (9.51%) and Rp (0.105 mol L−1 min), which also provided another convincing proof of the generation of the cationic microblock structure. A flocculation test involving the treatment of high-turbidity water confirmed that the microblock structure in TPAA could significantly increase its charge neutralization, patching and bridging ability, which contributed greatly to excellent flocculation performance (turbidity: 5.8 NTU, Df: 1.89, floc size d50: 608.404 μm and floc kinetic: 15.86 × 10⁻⁴ s−1). FTIR analysis of the kaolin flocs that formed indicated that the cationic microblock structure could generate a strong and powerful bond between TPAA and kaolin particles, but not chemical bonds, via the effect of charge neutralization, patching and bridging. In this case, the flocs generated by TPAA were dense and large, which thus resulted in a rapid settling rate for the removal of kaolin particles and the reduction of their high turbidity.
nATAC ratio of 1. Under these conditions, an intrinsic viscosity of 9.88 dL g−1 and a conversion of 99.7% were achieved using TPAA. The structural properties of TPAA were characterized by analytical techniques such as FTIR, 1H NMR, TGA and SEM, and the results indicated the successful formation of the cationic microblock structure. Moreover, a type I (zip) template polymerization mechanism was determined from the results of analyses based on KM (13.97), Cv (9.51%) and Rp (0.105 mol L−1 min), which also provided another convincing proof of the generation of the cationic microblock structure. A flocculation test involving the treatment of high-turbidity water confirmed that the microblock structure in TPAA could significantly increase its charge neutralization, patching and bridging ability, which contributed greatly to excellent flocculation performance (turbidity: 5.8 NTU, Df: 1.89, floc size d50: 608.404 μm and floc kinetic: 15.86 × 10⁻⁴ s−1). FTIR analysis of the kaolin flocs that formed indicated that the cationic microblock structure could generate a strong and powerful bond between TPAA and kaolin particles, but not chemical bonds, via the effect of charge neutralization, patching and bridging. In this case, the flocs generated by TPAA were dense and large, which thus resulted in a rapid settling rate for the removal of kaolin particles and the reduction of their high turbidity.


