 Open Access Article
Synthesis and application of hydrophilically-modified Fe3O4 nanoparticles in oil sands separation†
Zisheng Zhang‡
abc,
Hongda Li‡ab,
Hong Suiabd,
Lin He *ab and
Xingang Liabd
aSchool of Chemical Engineering and Technology, Tianjin University, Tianjin 300072, China. E-mail: linhe@tju.edu.cn
bNational Engineering Research Centre for Distillation Technology, Tianjin 300072, China
cDepartment of Chemical and Biomedical Engineering, University of Ottawa, Ottawa, ON K1N 6N5, Canada
dCollaborative Innovation Center of Chemical Science and Engineering (Tianjin), 300072, China
First published on 26th April 2018
Abstract
Nanoparticles have been reported to be a promising candidate for the separation of heavy oil from its host rock's surface. These nanoparticles (NPs) are often dispersed and stabilized in the solution by some surfactants during the unconventional oil ores processing. Herein, the PEG600–KH560 (PK) has been grafted onto Fe3O4 NP surfaces, obtaining a kind of hydrophilically-modified recyclable nanoparticle. Results show that these NPs (averaged at around 16 nm for single sphere) could be well dispersed in water (no settling in 72 h), forming PK-Fe3O4 nanofluids (NFs) at 0.2 wt%. These PK-Fe3O4 NFs are found to be able to be quickly separated from the dispersions by an external magnetic field, and returning back to stable NFs when the magnetic field disappears and by shaking. The PK-Fe3O4 NFs have been further used for the enhancement of heavy oil recovery from oil sands. The floatation results show that the PK-Fe3O4 NFs could improve oil recovery by at least 12% compared with the traditional hot water extraction process (HWEP). After the extraction, up to 70% of the PK-Fe3O4 NPs could be directly recycled from the solution for further use. The rest of the NPs are left in the oil phase and attached on the residual solid surface. However, the efficiency of the PK-Fe3O4 NPs is found to be decreased when the recycling times exceed 5 due to the adsorption of oil components. A mechanistic study shows that the hydrophilic PK-Fe3O4 NPs could be adsorbed on the mineral surface, making the surface more hydrophilic. The hydrophilic surface and the agitation disturbance helps the liberation process of bitumen from the solid surfaces. On the other hand, when adding the PK-Fe3O4 NPs into the heavy oil–water system, the oil–water interface is found to be highly modified by the NPs, resulting in significant reduction of the oil–water interfacial tension. The above findings suggest that the PK-Fe3O4 NPs combined the surface-active role (surfactant) and the nano-size role (adsorption) together, which facilitates its role in oil sands separation.
1. Introduction
With proven reserves of more than 6 trillion of barrels, the unconventional oil accounts for a major part of fossil fuel resources. Many technologies, including steam extraction, pyrolysis, chemical flooding, solvent or vapor extraction, emulsion flooding, and microorganism application have been proposed to recover the heavy oil from unconventional oils.1–4 The chemical flooding is the most used method for tertiary oil recovery or enhanced oil recovery (EOR). The chemicals involved during the flooding process are mainly chemical surfactants, bio-surfactants, salts, nanoparticles, polymers, or even gases.5–9 These chemicals are used to reduce the oil–water interfacial tension, to decrease oil viscosity or expand oil volume, to increase the effectiveness of water flooding.10 The application of nano materials has shown potential to solve different problems in oil and gas industry.11,12 Nanoparticles (NPs) have been utilized in subsurface applications due to their ability to alter certain properties in the unconventional oil ores. NPs exhibit exceptional properties compared with other chemicals owing to the small size and large surface area.1,13During the past years, different kinds of NPs have been applied in enhanced oil recovery, such as SiO2, Al2O3, TiO2, ZrO2, Fe2O3, nanoclay, etc.7,14–16 These NPs are often dispersed in the water solution together with some surfactants to form nanofluids (NFs), which are further used to extract the oil from the oil matrix.14,15,17,18 It is reported that the efficiency of NPs in heavy oil recovery is highly dependent on the NPs types, NPs concentration, temperature, pH, surfactants, and salinity of water.10,13–16,18–20 For example, about an extra of 26 wt% of oil recovery is obtained when silica NPs are added into the solution at 3 wt%.17 Mohebbifar et al.6 applied 3000 ppm silica NFs with xanthan (a biopolymer) as thickening agent. They found that about 78 wt% of the coated Iranian heavy oil could be replaced by the NFs from the glass surface. The main roles of NPs for enhanced oil recovery are proposed to be the wettability alteration,10,14,15,17,20–22 interfacial tension (IFT) reduction,13,22–24 viscosity influence,7,23–25 high disjoining pressure by vessel structure and spontaneous imbibition.10,13,26–29 However, the exact mechanisms of the NPs in extracting oil, especially the unconventional oils, are still unclear.
Although much progress has been achieved, there are still many challenges before the commercialization of NPs in oil production. One of the main problems is the high cost of the NPs. There would be several ways to reduce the operational cost of NPs enhanced oil recovery: using cheaper NPs, reducing the dosage, recycling the NPs. Among these methods, the recycling of NPs is a promising method for the reduction of the operational cost. The Fe3O4 nanoparticle is a kind of ferrous nanoparticle. Except for general advantages in small size and high surface energy, Fe3O4 nanoparticle has a superparamagnetic feature, allowing it to be recyclable by magnetic separation. This recyclability of Fe3O4 NPs makes the possibility of reusing these NPs during the practical applications.
However, most of the reported NPs used in the oil recovery have a trend of self-aggregation due to their small size. To obtain a steady NFs system, different ways are proposed, such as surface modification,26,30–34 combining surfactants,35 bringing ultrasonication and pH adjustment. It is reported that the polymer-grafting is a promising choice for stabilizing NPs.36 Sharma et al.22 applied polyacrylamide (PAM) to graft onto SiO2 NPs surface. The obtained NPs showed good stability in high-temperature environments. Sang et al.37 used hydrophobically associative hygroscopic zwitterionic polymer to stabilize silica NPs. The fluidity of the complex oil could be improved with NFs flooding and 74.1% of oil could be recovered by modified NPs-based NFs in core flooding experiment.
Accordingly, in this work, we want to synthesize a multifunctional nanoparticle, possessing nano-size effect, chemical surface activity and recyclability. We plan to synthesize the Fe3O4 NPs which are grafted by a hydrophilic materials (i.e., polyethylene glycol 600 (PEG600)). This grafting will make the surface of Fe3O4 NPs more hydrophilic, leading to its high dissolution and stabilization in water. Therefore, the purposes of this work are to: (i) synthesize PK-grafted Fe3O4 NPs and prepare PK-Fe3O4 NPs-based NFs; (ii) test the feasibility of PK-Fe3O4 NFs in separating bitumen from oil sands and (iii) understand the primary roles of PK-Fe3O4 NFs in oil–mineral separation.
2. Materials and methods
2.1. Materials
Chemicals, such as FeCl2·4H2O and FeCl3·6H2O, were both purchased at analytical grade from Tianjin Jiangtian Chemical Technology Co., Ltd. 2,3-Epoxypropoxy propyltrimethoxysilicane (KH560) and polyethylene glycol 600 (PEG600), shown in Fig. 1a and b, were provided at analytical grade by Tianjin Heowns Biochemical Technology Co., Ltd. Ammonium hydroxide (NH3·H2O, 25%) was got from Tianjin Kemiou Chemical Reagent Co., Ltd. Canadian oil sands from Athabasca, Alberta was used in this study. The oil sands samples were analyzed using the Dean–Stark standard method. The composition is determined to be as: 10.72 wt% bitumen, 1.79 wt% water and 87.49 wt% solids.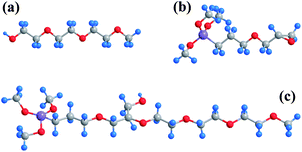 | ||
| Fig. 1 Stick model of (a) PEG600; (b) KH560; (c) PEG600–KH560 molecule (sketch map), blue, grey, red and purple balls stand for hydrogen, carbon, oxygen and silicon atoms, respectively. | ||
2.2. Synthesis of PK-Fe3O4 nanoparticles
The Fe3O4 NPs were synthesized by co-precipitation method on the basis of eqn (1).38–40 FeCl2·4H2O and FeCl3·6H2O were dissolved in deionized water at molar ratio of 1![[thin space (1/6-em)]](https://www.rsc.org/images/entities/char_2009.gif) :
:![[thin space (1/6-em)]](https://www.rsc.org/images/entities/char_2009.gif) 2. Ammonia (5 wt%) was added to adjust the pH of solution to 9.0. The whole reaction continued 30 min under nitrogen atmosphere at 60 °C. Then, a magnetic bar was used to separate the black Fe3O4 NPs from the solution, followed by washing with deionized water and alcohol twice. Finally, NPs were dried by vacuum freeze dryer for 24 h.
2. Ammonia (5 wt%) was added to adjust the pH of solution to 9.0. The whole reaction continued 30 min under nitrogen atmosphere at 60 °C. Then, a magnetic bar was used to separate the black Fe3O4 NPs from the solution, followed by washing with deionized water and alcohol twice. Finally, NPs were dried by vacuum freeze dryer for 24 h.
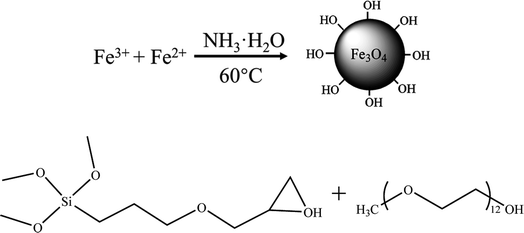 | (1) |
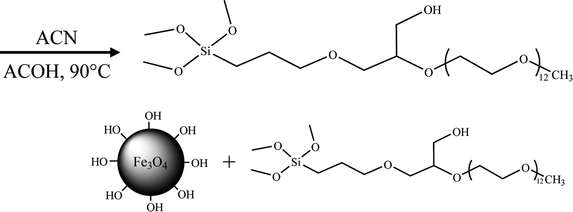 | (2) |
 | (3) |
Then, the PEG600–KH560 (PK) was prepared by chemically linking PEG600 to KH560 on the basis of eqn (2). Firstly, to prevent the silane hydrolysis, PEG600 was dried at 80 °C for 3 h to remove water completely. Subsequently, 14.00 g of PEG600 was diluted by 150 mL of acetonitrile with the addition of 0.20 mL of acetic acid as catalyst. Then, 5.90 g of KH560 was added into the solution dropwise in 30 min. After refluxing at 90 °C with continuous stirring for 6 h, the products were separated from solvent by vacuum evaporation.
The PK molecules were grafted on Fe3O4 NPs, shown as eqn (3). The reaction details were given as follows: firstly, 1.50 g of PK was hydrolyzed by 75.0 mL of water at pH 9.50 for 30 min to produce silanol groups, and Fe3O4 NPs were dispersed in water at pH 9.50 by ultrasonication for 6 min. Secondly, the hydrolyzed agents were injected dropwise into 1.00 wt% Fe3O4 NFs suspension in 30 min. The mixture was then refluxed at 90 °C under nitrogen atmosphere and continuously stirred for 12 h. Finally, the products were collected from suspending medium by magnetic bar followed by twice washing with deionized water and alcohol and dried by heating at 80 °C for 6 h.
2.3. Preparation of PK-Fe3O4 nanofluids
The PK-Fe3O4 NFs were prepared by dispersing PK-Fe3O4 NPs into deionized water. Then, the prepared NFs (0.20 wt%) were stabilized with NaOH solution to adjust pH at 8.00. The NFs were further dispersed by ultrasonication for 30 min followed by being preserved in glass bottles. Visualization tests showed that no obvious settlement of NPs was observed in 72 h. Nanoparticle size analyzer and UV-vis test were further used to evaluate the stability of NFs in long-term experiments. The results of nanosizer test (shown in Fig. 2a) showed that the average size of NFs has an increase (from 47.3 nm to 95.0 nm) after free placing for 200 h at ambient temperature. The UV-vis test (shown in Fig. 2b) showed that the UV absorption of the NFs only had a little decrease (from 0.800 to 0.782 for original NFs and from 1.434 to 1.410 for recycled NFs) at the wavelength of 300 nm, suggesting the stability of NFs for further experiments.41 Fig. 2a also indicated that the average size increased slightly after placing for 48 h. Thus, the obtained NFs were freely placed for 48 h before using for enhancement of oil recovery, IFT tests and contact angle measurements.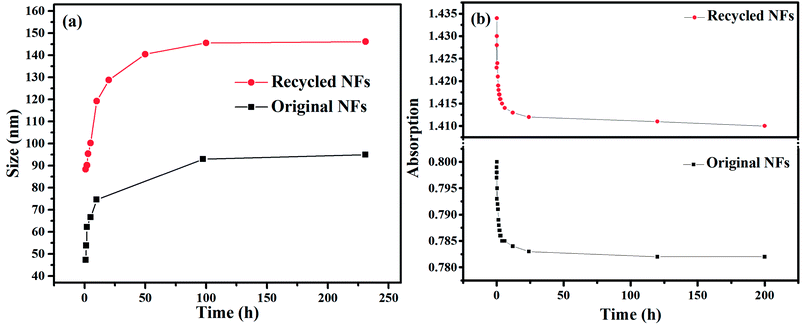 | ||
| Fig. 2 (a) Size peaks of original and recycled NFs at different time intervals; (b) UV-vis absorption of original NFs and recycled NFs at 300 nm as a function of time. | ||
2.4. Oil recovery by PK-Fe3O4 nanofluids
The PK-Fe3O4 NFs were used to separate the bitumen from oil sands by floatation in a Denver Floatation Cell. The procedures below were followed to collect bitumen froth samples:42 firstly, the toluene (0.86 mL) was distributed evenly on oil sands sample (50.00 g) followed by a soaking time of 10 min to reduce the viscosity of oil sands bitumen.43 PK-Fe3O4 NFs (1000 mL, 0.20 wt%) was prepared at pH 8.00. Secondly, the toluene-diluted oil sands ores were transferred into the floatation cell followed by the addition of NFs. The mixture was conditioned under 45 °C for 5 min at the stirring rate of 1500 rpm. After conditioning, air was injected at a flow rate of 150 mL min−1. The floatation test was conducted for 15 min. A beaker was used to collect the froth samples, with samples collected at the end of 1 minute, 3 min, 5 min, 10 min and 15 min. Finally, the collected froth sample was transferred into a thimble, which would be further analyzed using Dean–Stark apparatus. On the basis of the extraction results, bitumen recovery and froth quality (B/S, bitumen to solids mass ratio) are calculated using the following equations:
 | (4) |
 | (5) |
The NFs was recycled and reused by the following procedures: firstly, PK-Fe3O4 NPs were recycled from solution and tail sands by magnetic bar for 10 min. Secondly, the recycled NPs were washed by water and alcohol twice to separate the sands as much as possible. Finally, recycled NPs were dispersed into deionized water and the pH was adjusted to 8.00. The lost NPs were supplemented by parallel experiments to ensure the accuracy of the experiments.
2.5. Instrumental characterizations
The transmission electron microscopy (TEM, JEM 2010) and the scanning electron microscope (SEM, S4800) devices were used to investigate the morphology and homogeneity of Fe3O4 NPs and PK-Fe3O4 NPs. The open-loop reaction between KH560 and PEG600 and the grafting reaction between PK molecule and Fe3O4 NPs were monitored by the Fourier transform infrared spectroscopy (FT-IR, Tensor II) using the Attenuated Total Reflection (ATR) method. Powder X-ray diffraction (XRD) and X-ray photoelectron spectra (XPS) patterns of Fe3O4 NPs and PK-Fe3O4 NPs were collected on D8 advance diffractometer and 250xi photoelectron spectrometer, respectively. The magnetic properties of the two NPs were measured on a Lake Shore 7404 vibrating sample magnetometer (VSM) at ambient temperature. The thermogravimetric Analysis (TG, TGA/DSC1) was applied to record thermal stability and surface grafting characterization of the two NPs with a heating rate of 10 °C min−1 from 40 to 800 °C under nitrogen atmosphere. The size distribution and zeta potentials of PK-Fe3O4 NFs were evaluated by nanoparticle size analyzer (Nano ZS, Malvern). The ultraviolet and visible spectrophotometer (UV-vis, TU-1810) was used to evaluate the stability of NFs and to check samples obtained from floatation experiment. X-ray fluorescence spectroscopy (XRF, S4 Pioneer) was used to test element contents of sands after extraction process in Dean–Stark apparatus.2.6. Interfacial tension test and contact angle measurement
To investigate the influences of PK-Fe3O4 NFs on the oil–water interfacial properties, the IFT of water–oil and NFs–oil systems were tested by Optical Contact Angle & Interface Tension Meter (SL200KS) by pendant drop method at ambient temperature.3. Results and discussion
3.1. Characterizations of PK-Fe3O4 nanoparticles
The morphology and distribution of the nano products are examined by TEM and SEM. Fig. 3 shows TEM images of Fe3O4 NPs and PK-Fe3O4 NPs, which appear as spherical contour and even some aggregations. The average diameters of Fe3O4 NPs and PK-Fe3O4 NPs are about 10.41 and 15.89 nm, respectively. Due to the entanglement of long chains of PEG, there appears an adhesion phenomenon between PK-Fe3O4 NPs, shown in Fig. 3c and d.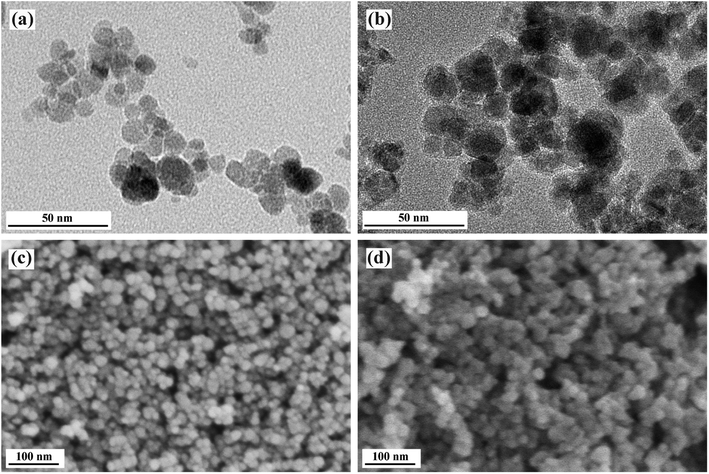 | ||
| Fig. 3 TEM images of: (a) Fe3O4 NPs and (b) PK-Fe3O4 NPs. SEM images of: (c) Fe3O4 NPs and (d) PK-Fe3O4 NPs. | ||
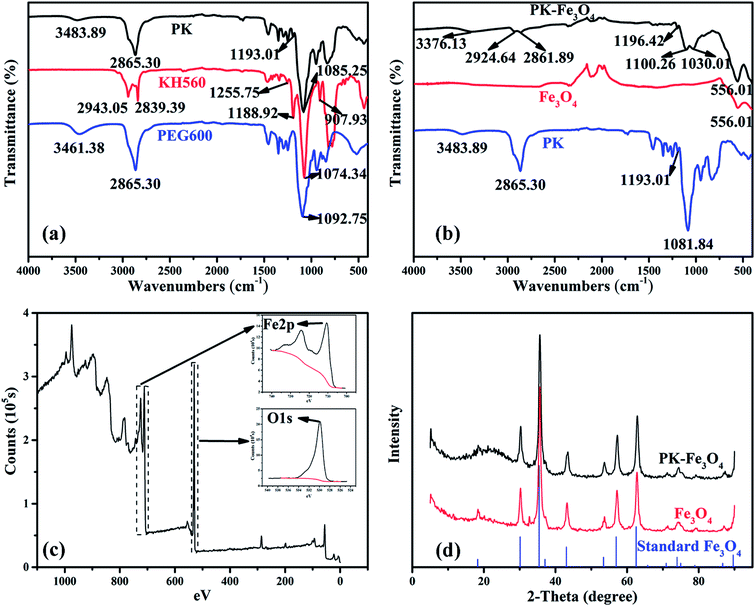
FT-IR spectra of PK molecules, KH560 and PEG600 are shown in Fig. 4a. FT-IR spectra of PEG600 consists of stretching vibration of –OH groups at ∼3500 cm−1 and symmetrical stretching vibration of –CH2 groups at ∼2900 cm−1 and 1250–1500 cm−1. They are also observed in PK spectra. The strong absorption peak at ∼1100 cm−1 assigned to C–O–C groups is also detected in PK spectra. FT-IR spectra of KH560 contains stretching vibration absorption peaks for C–H at 2800–3000 and 1250–1500 cm−1. The peaks at ∼1200 cm−1 and ∼1100 cm−1, assigned to Si–O–C and C–O–C groups, respectively, are also observed in PK FT-IR spectra. While absorption peaks referred to epoxy ring at 1250 and 890 cm−1 do not appear in PK spectra.45 The appearance of Si–O–C groups peak and disappearance of the epoxy ring peak in PK FT-IR spectra reveal that the addition reaction happens (shown by eqn (2)).
FT-IR spectra of PK-grafted Fe3O4 NPs, unmodified Fe3O4 nanoparticle and PK molecules are depicted in Fig. 4b. Absorption peaks at ∼3400 cm−1, ∼2900 cm−1, ∼1200 cm−1, ∼1100 cm−1 and ∼550 cm−1 are assigned to the stretching vibrations of –OH groups, symmetrical stretching vibration of –CH2 groups, Si–O–C groups, C–O–C groups and stretching vibration of Fe–O bonds, respectively. It is worth noting that the absorption peak of asymmetrical stretching vibration of –CH2 groups at ∼2900 cm−1, which is partially covered by the strong adsorption peak of symmetrical stretching vibration, relatively strengthens due to the grafting reaction. This phenomenon also acts on the primary alcohol absorption peak belonging to PEG600 molecules and open-looped KH560 at ∼1050 cm−1, which is covered by the strong adsorption peak of C–O–C groups in the spectra of PEG600 and PK.46 These results indicate that PK has been grafted on the surface of Fe3O4 NPs successfully.
Fig. 4c presents the broad and narrow scan XPS spectra of Fe3O4 NPs. The peaks at 711.0 eV, 724.0 eV and 529.9 eV are the characteristic doublets of Fe 2p3/2, Fe 2p1/2 and O 1s from iron oxide, respectively, which is consistent with the reported values of Fe3O4.40
Fig. 4d shows the XRD patterns of standard diffraction peaks of PK-Fe3O4 NPs, Fe3O4 NPs and face-centered cubic Fe3O4 phase (JCPDS card 19-629).47 The diffraction peaks in Fe3O4 NPs are basically the same as the standard ones. Generally, the addition of grafted groups will bring out new diffraction peaks. However, results of XRD tests show that the peak positions of diffractive peaks before and after grafting reaction are basically the same. The result suggests that there is no crystal transformation of Fe3O4 NPs during the grafting reaction. It also indicates that the grafted groups may be amorphous.
Magnetic characterizations of Fe3O4 NPs and PK-Fe3O4 NPs have been tested in the physical property measurements system of VSM at ambient temperature. It was conducted with a magnetic field in the range of −10![[thin space (1/6-em)]](https://www.rsc.org/images/entities/char_2009.gif) 000 to 10
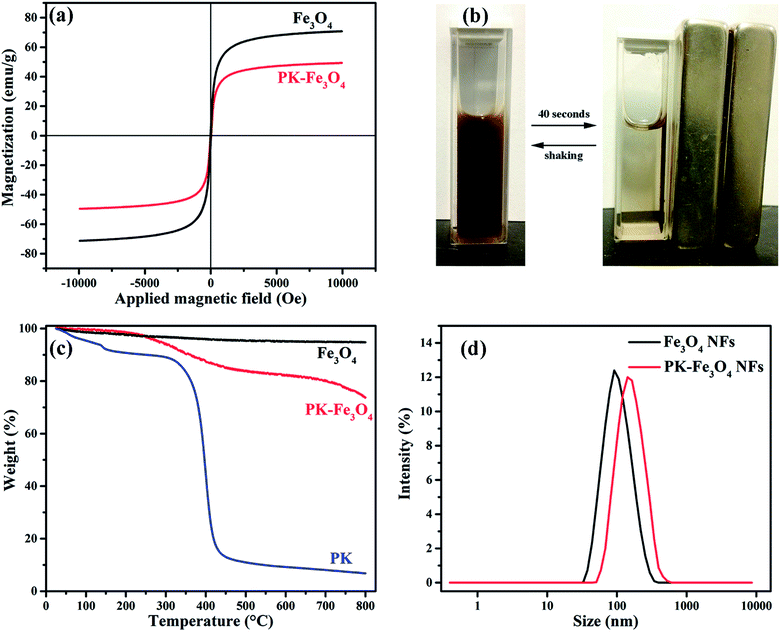
000 to 10![[thin space (1/6-em)]](https://www.rsc.org/images/entities/char_2009.gif) 000 Oe, where the influence of saturation magnetization (Ms), and coercive field (Hc) are evaluated. The Fe3O4 powders usually show a superparamagnetic behavior, because each of the particles can be treated as a thermally agitated permanent magnet. This type of materials often shows hysteresis loops (M–H curves). Fig. 5a shows that the Ms values of Fe3O4 NPs and PK-Fe3O4 NPs are 70.85 and 49.36 emu g−1, respectively. The appearance of magnified hysteresis loops further confirms the superparamagnetism of these particles. While, the reduction in saturation magnetization of PK-Fe3O4 NPs suggest that the grafting of PK on the particle surface would weaken the magnetism of the nanoparticles.
000 Oe, where the influence of saturation magnetization (Ms), and coercive field (Hc) are evaluated. The Fe3O4 powders usually show a superparamagnetic behavior, because each of the particles can be treated as a thermally agitated permanent magnet. This type of materials often shows hysteresis loops (M–H curves). Fig. 5a shows that the Ms values of Fe3O4 NPs and PK-Fe3O4 NPs are 70.85 and 49.36 emu g−1, respectively. The appearance of magnified hysteresis loops further confirms the superparamagnetism of these particles. While, the reduction in saturation magnetization of PK-Fe3O4 NPs suggest that the grafting of PK on the particle surface would weaken the magnetism of the nanoparticles.
The magnetic separation experiment (shown in Fig. 5b) exhibits that PK-Fe3O4 NPs could be dispersed in water by shaking or ultrasonication to form a stable suspension without settlement or aggregation in 72 h. When the magnetic field was applied, the particles could be quickly separated from the solution. If the magnetic field was removed, these collected particles could be dispersed in the solution again. These results show that the PK-Fe3O4 NPs possess excellent magnetic responsivity and redispersibility, which is important in terms of their practical application.
In the TGA analysis, shown in Fig. 5c, the weight of synthesized Fe3O4 NPs is found to be almost unchanged during heating to 800 °C. However, after grafting reaction, PK-Fe3O4 NPs appear a mass loss at about 200 °C, with weight loss of about 17%. The temperature interval of the weight loss is similar to that of PK molecules, whose weight loss is more than 75% from 300 °C to 500 °C. The weight loss is also in accordance with the saturation magnetization difference between bare Fe3O4 and PK-Fe3O4 (from 70.85 to 49.36 emu g−1). These results further verify that the PK has been grafted on Fe3O4 NPs surface successfully.
Fig. 5d demonstrates the hydraulic diameter and dispersibility of Fe3O4 NPs and PK-Fe3O4 NPs. Results show that the average hydraulic diameter of Fe3O4 NPs is at 105.7 nm with a polydispersibility index (PDI) of 0.107, while the diameter and PDI become 142.0 nm and 0.150, respectively, for PK-Fe3O4 NPs. It suggests that the grafting of PK results in the increase in the hydraulic diameter.32
3.2. Application in oil sands separation
Results of heavy oil recovery from oil sands by PK-Fe3O4 NFs are given in Fig. 6. At given conditions, the PK-Fe3O4 NFs could achieve 62.61% of the oil recovery by single extraction step, over 12% more than that of traditional hot water extraction process (HWEP) without NPs addition, shown in Fig. 6a. In addition, the bitumen to solid ratio (B/S) of oil product is also found to be improved by the PK-Fe3O4 NFs (0.33) compared with that of the HWEP (0.18), given in Fig. 6b. These results suggest that the addition of PK-Fe3O4 NPs would increase the quality of bitumen froth. One of the major advantages of the magnetic NPs is their magnetic response which allows them to be recyclable. Herein, after the extraction, the PK-Fe3O4 NPs are recycled for further use. It is found that up to 70% of the PK-Fe3O4 NPs could be directly recycled from the solution for further extraction. The rest of the NPs are found to be left in the oil phase and attached in the residual solids. Further recycling tests show that the oil recovery decreases from 62.62% to 51.70% when the cycling time increases from 2 to 5, shown in Fig. 6a. The B/S also reduces from 0.33 to 0.25 from the 1st floatation experiment (FE1) to the 5th floatation experiment (FE5), shown in Fig. 6b. However, the recycled NPs increases from 60.40% to 70.04% during the recycling accordingly.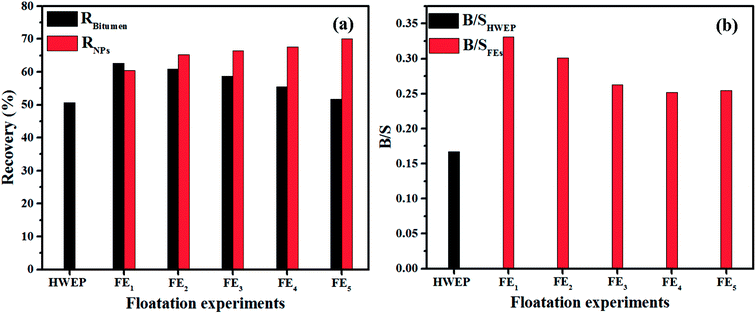 | ||
| Fig. 6 (a) Recovery of bitumen and NPs in floatation experiments and (b) the corresponding B/S of froth from different extractions. | ||
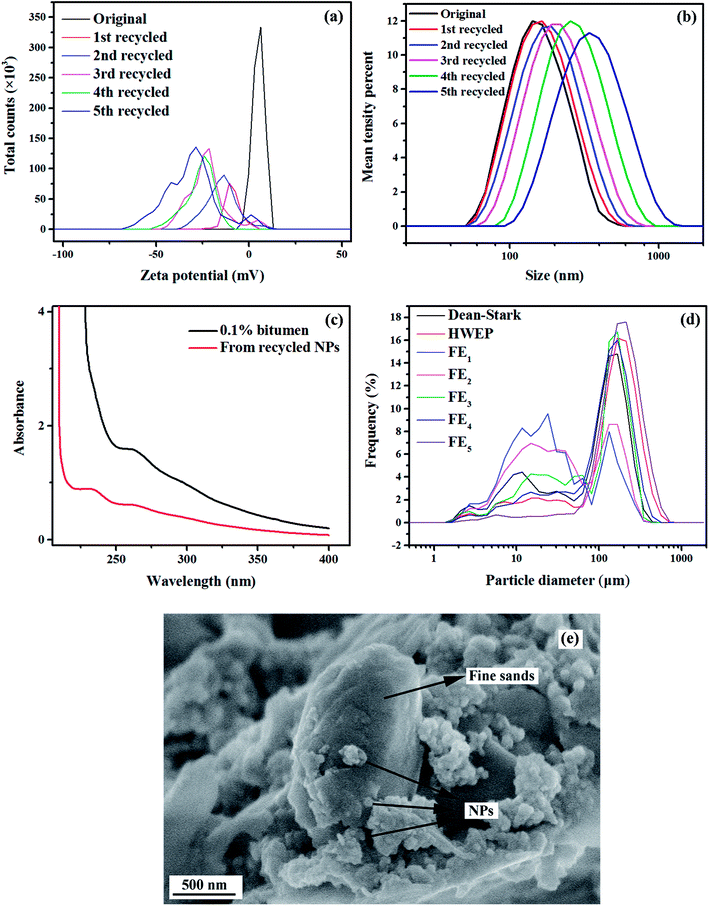
To understand why increasing the recycling times reduces the extraction efficiency of PK-Fe3O4 NFs, further tests were conducted. Fig. 7a presents the zeta potential of the original PK-Fe3O4 NPs and recycled NPs at different stages. Obviously, the zeta potentials of NPs change from positive (original NPs before extraction) to negative (as low as −50 mV) when increasing the recycling times. The more the cycling times, the more negatively charged the NPs. Fig. 7b shows that the hydrodynamic diameter of NPs grows a little bit after recycling. This growth of the nanoparticle size is ascribed to the adsorption of some oil components on the nanoparticle surfaces. The adsorbed oil components on the NPs surfaces were found to be dissolved in cyclohexane. As shown in Fig. 7c, the UV-vis test shows that the obtained cyclohexane solution exhibits similar absorption peaks with bitumen dissolved in cyclohexane (0.1%), suggesting the appearance of oil component on the nanoparticle surfaces. Future study will be conducted to detect the exact chemical composition of the adsorbed materials.
In Fig. 7e, it is found that some of the NPs are adsorbed on the fine solids (diameter < 44 μm). The adsorption of NPs on mineral surfaces may be ascribed to the strong interaction between surface hydroxyls of minerals and C–O–H bonds of NPs.48 This adsorption brings the minerals to the recycled PK-Fe3O4 NPs, leading to the reduction of the efficiency of the PK-Fe3O4 NPs. This entrainment of fine solids by the PK-Fe3O4 NPs is further confirmed by the reduced fines in the bitumen froth during the recycling of NPs through Laser Particle Size Analyzer (LPSA) test, shown in Fig. 7d. Similarly, the adsorption of PK-Fe3O4 NPs on the mineral surfaces would also bring some NPs into the bitumen froth. As shown in Table 1, the content of Fe3O4 in the froth entrained minerals increased from 1.55 wt% to 3.31 wt%. This is also the reason there is some loss of Fe3O4 during the extraction. Moreover, the distribution of NPs from the floatation experiment is shown in Table 2.
| Al2O3 | Fe3O4 | K2O | P2O5 | SiO2 | SO3 | TiO2 | Others | |
|---|---|---|---|---|---|---|---|---|
| HWEP | 11.30 | 1.55 | 1.89 | 1.29 | 80.29 | 1.65 | 1.10 | 2.03 |
| FEs | 11.12 | 3.31 | 2.51 | 1.30 | 76.73 | 1.48 | 1.64 | 3.55 |
3.3. Roles of PK-Fe3O4 NPs in EOR
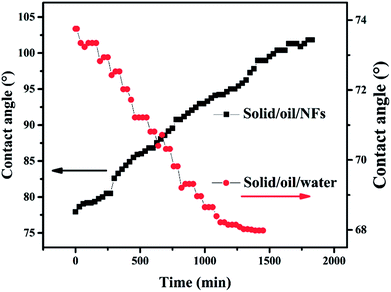
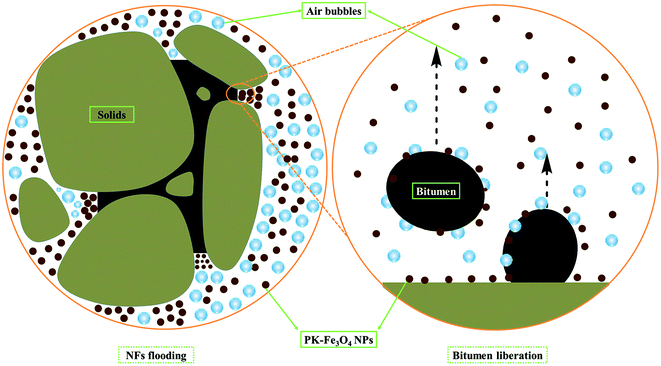
The newly synthesized PK-Fe3O4 NPs are proven to be beneficial for the heavy oil recovery from oil sands. Basically, the NPs play two important roles in modifying the oil surface and the mineral surface. For the mineral surfaces, during the extraction, the PK-Fe3O4 NPs are found to be adsorbed on the mineral surfaces, shown in Fig. 7e. To further find out how the nanoparticle adsorption influences the mineral, contact angle measurements are applied for water on NPs-coated glass in air and on bare glass as mentioned in Section 2.6. Fig. 8a and b show that the water contact angle on NPs-coated glass (128.48°) in air is larger than that on bare glass surface (111.18°). It indicates that the coating of PK-Fe3O4 NPs increases the hydrophilicity of the glass surface. The increase of the hydrophilicity of minerals surface will facilitate the liberation of oil from the mineral surface.10,13,14For the purpose of making a close observation on the adsorption effect of NPs on the surface of solids, the dynamic contact angles of solid/oil/NFs and solid/oil/water have been measured. The glass plate were selected as the model of mineral solid surface. The plate was firstly immersed in petroleum ether for 12 h to form an oil-wet surface. Toluene-diluted bitumen (1.0 wt%) was chosen as the oil phase. Results in Fig. 9 show that the contact angle of solid/oil in NFs increases from 77.92° to 101.87°, which is in accordance with the reported phenomenon.27 This increase in contact angle suggests the adsorption of nanoparticles on the solid surface. Because of the adsorption of NPs on the surface of solids, the force of the wedge structure pressure “squeezes” the contact line of NFs/oil. In addition, assisted by the mechanical disturbance from the agitator, the bitumen is easier to be removed from the surface of sands.49 The liberated bitumen is then entrained by air bubbles to form the bitumen froth. Fig. 9 also presents that the contact angle of solid/oil in water decreases from 73.75° to 67.98°. The reverse in tendency with contact angle of solid/oil/NFs is ascribed to that pure water can only provide interfacial tension at the vertex of the contact area. Under the action of buoyancy force, the oil droplet slowly spreads to the glass plate. The microscopic sketch of the liberating process is shown in Fig. 10.
For the oil surfaces, the addition of PK-Fe3O4 NPs is found to be able to significantly reduce the oil–water interfacial tension. Fig. 11a and b present the changes of NFs and water contact angles on bitumen-coated glass surface. It is obvious that the water contact angle on oil in air increases from 77.10° to 96.59°. While it changes from 86.86° to 114.32° for PK-Fe3O4 NFs on oil in air. This result suggests that the addition of PK-Fe3O4 NPs allows the bitumen surface more hydrophilic. On the other hand, the addition of PK-Fe3O4 NPs in the solution also reduces the heavy oil–water interfacial tension from 14.40 mN m−1 to 8.59 mN m−1. This finding indicates that the PK-Fe3O4 NPs act as a role of ‘surfactant’ in NFs. Owing to the cyclic hydrophilic groups C–O–C and hydrophobic groups CH2–CH2 in PEG molecules, they possess good intermiscibility in water with alkane groups in heavy oil. Declining IFT results in a reduction in capillary pressure that reveals to better efficiency and further aids the oil liberation process.19 The above roles of PK-Fe3O4 NPs contribute to the enhanced oil recovery from oil sands.
It should be mentioned that although the addition of PK-Fe3O4 NPs could enhance the oil sands separation, its efficiency would be reduced when directly recycling the PK-Fe3O4 NPs due to the adsorption of oil components. Therefore, the PK-Fe3O4 NPs should be treated by solvent washing to remove the oil components before its next application in extraction.
4. Conclusions
Here, PEG coated hydrophilic nanoparticle (PK-Fe3O4 NPs) has been synthesized by co-precipitation and surface group grafting reaction. This kind of nanoparticle is averaged at around 16 nm in size. It could be well dispersed in water, forming stable PK-Fe3O4 NFs. The superparamagnetic property of PK-Fe3O4 NPs enables them to be separated by external magnetic fields, facilitating their recycling and reusing. The results of floatation experiments by PK-Fe3O4 NFs reveal that an extra oil recovery of 12% can be achieved with the improvement in the quality of bitumen froth (B/S). It is found that up to 70% of the PK-Fe3O4 NPs could be directly recycled from the solution for further use. The rest NPs are leaving in the oil phase and attached on the residual solid surface. However, because there are some oil components being adsorbed on the NPs surfaces, it is observed that the efficiency of PK-Fe3O4 NPs will be reduced to some extent when recycling them without treatment for further extraction. This enhancement of PK-Fe3O4 NPs in oil recovery from unconventional oil ores would be contributed by two roles: the adsorption of PK-Fe3O4 NPs on mineral surface, resulting in the increased wettability of the mineral surfaces; and the alternation of the oil–water interface, allowing the reduction in oil–water IFT. However, it should be mentioned that the adsorption of NPs on surfaces of minerals would also lead to the loss of PK-Fe3O4 NPs in the oil phase, and the deterioration of the NPs due to the entrainment of minerals in the recycled NPs. In addition, the adsorption of oil components on the NPs surface implies that the PK-Fe3O4 NPs should not be directly recycled but solvent washed before next extraction.Conflicts of interest
There are no conflicts to declare.Acknowledgements
This work was financially supported by National Natural Science Foundation of China (NSFC, No. 21506155, No. 41471258).References
- K. Guo, H. Li and Z. Yu, Fuel, 2016, 185, 886–902 CrossRef CAS.
- H. Ma, G. Yu, Y. She and Y. Gu, J. Pet. Sci. Eng., 2017, 149, 465–475 CrossRef CAS.
- H. Pei, G. Zhang, J. Ge, P. Jiang, J. Zhang and Y. Zhong, Colloids Surf., A, 2017, 529, 409–416 CrossRef CAS.
- M. Safdel, M. A. Anbaz, A. Daryasafar and M. Jamialahmadi, Renewable Sustainable Energy Rev., 2017, 74, 159–172 CrossRef CAS.
- M. Nabipour, S. Ayatollahi and P. Keshavarz, J. Mol. Liq., 2017, 230, 579–588 CrossRef CAS.
- M. Mohebbifar, M. H. Ghazanfari and M. Vossoughi, J. Energy Resour. Technol., 2015, 137, 014501 CrossRef.
- N. A. Ogolo, O. A. Olafuyi and M. O. Onyekonwu, Soc. Pet. Eng. J., 2012, 875–885 Search PubMed.
- F. Bordeaux Rego, V. E. Botechia and D. J. Schiozer, J. Pet. Sci. Eng., 2017, 153, 187–196 CrossRef CAS.
- S. M. Seyyedsar and M. Sohrabi, Fuel Process. Technol., 2017, 164, 1–12 CrossRef CAS.
- X. Sun, Y. Zhang, G. Chen and Z. Gai, Energies, 2017, 10, 345 CrossRef.
- A. Zhong, Challenges for High-Pressure High-Temperature Applications of Rubber Materials in the Oil and Gas Industry, Springer International Publishing, Cham, 2016, pp. 65–79 Search PubMed.
- J. Yang, S. Ji, R. Li, W. Qin and Y. Lu, Energy Explor. Exploit., 2015, 33, 639–657 CrossRef.
- M. S. Kamal, A. A. Adewunmi, A. S. Sultan, M. F. Al-Hamad and U. Mehmood, J. Nanomater., 2017, 2017, 15 Search PubMed.
- J. Giraldo, P. Benjumea, S. Lopera, F. B. Cortés and M. A. Ruiz, Energy Fuels, 2013, 27, 3659–3665 CrossRef CAS.
- A. Karimi, Z. Fakhroueian, A. Bahramian, N. Pour Khiabani, J. B. Darabad, R. Azin and S. Arya, Energy Fuels, 2012, 26, 1028–1036 CrossRef CAS.
- R. Nazari Moghaddam, A. Bahramian, Z. Fakhroueian, A. Karimi and S. Arya, Energy Fuels, 2015, 29, 2111–2119 CrossRef CAS.
- A. Maghzi, S. Mohammadi, M. H. Ghazanfari, R. Kharrat and M. Masihi, Exp. Therm. Fluid Sci., 2012, 40, 168–176 CrossRef CAS.
- S. Kiani, M. Mansouri Zadeh, S. Khodabakhshi, A. Rashidi and J. Moghadasi, Energy Fuels, 2016, 30, 3791–3797 CrossRef CAS.
- A. Ahmed, I. Mohd Saaid, A. H. Tunio, R. Pilus, M. Mumtaz and I. Ahmad, J. Appl. Environ. Biol. Sci., 2017, 7, 56–62 Search PubMed.
- R. Songolzadeh and J. Moghadasi, Colloid Polym. Sci., 2016, 295, 145–155 Search PubMed.
- B. Ju, T. Fan and M. Ma, China Particuol., 2006, 4, 41–46 CrossRef CAS.
- T. Sharma, S. Iglauer and J. S. Sangwai, Ind. Eng. Chem. Res., 2016, 55, 12387–12397 CrossRef CAS.
- L. He, F. Lin, X. Li, Z. Xu and H. Sui, Energy Fuels, 2014, 28, 7403–7410 CrossRef CAS.
- B. A. Suleimanov, F. S. Ismailov and E. F. Veliyev, J. Pet. Sci. Eng., 2011, 78, 431–437 CrossRef CAS.
- Y. Wang, W. Jia, M. Ding, H. Yang, B. Hu and S. Ren, Energy Fuels, 2012, 26, 1019–1027 CrossRef CAS.
- C. Dai, X. Wang, Y. Li, W. Lv, C. Zou, M. Gao and M. Zhao, Energy Fuels, 2017, 31, 2663–2668 CrossRef CAS.
- D. T. Wasan and A. D. Nikolov, Nature, 2003, 423, 156–159 CrossRef CAS PubMed.
- H. Zhang, A. Nikolov and D. Wasan, Energy Fuels, 2014, 28, 3002–3009 CrossRef CAS.
- L. He, F. Lin, X. Li, H. Sui and Z. Xu, Chem. Soc. Rev., 2015, 44, 5446–5494 RSC.
- J. A. Darr, J. Zhang, N. M. Makwana and X. Weng, Chem. Rev., 2017, 117, 11125–11238 CrossRef CAS PubMed.
- S. Xuan, Y. X. Wang, J. C. Yu and K. C. Leung, Langmuir, 2009, 25, 11835–11843 CrossRef CAS PubMed.
- J. Xie, C. Xu, N. Kohler, Y. Hou and S. Sun, Adv. Mater., 2007, 19, 3163–3166 CrossRef CAS.
- A. Ito, M. Shinkai, H. Honda and T. Kobayashi, J. Biosci. Bioeng., 2005, 100, 1–11 CrossRef CAS PubMed.
- A. Behzadi and A. Mohammadi, J. Nanopart. Res., 2016, 18, 266 CrossRef.
- W. Yu and H. Xie, J. Nanomater., 2012, 2012, 1–17 Search PubMed.
- H. ShamsiJazeyi, C. A. Miller, M. S. Wong, J. M. Tour and R. Verduzco, J. Appl. Polym. Sci., 2014, 131, 4401–4404 CrossRef.
- S. K. Choi, H. A. Son, H. T. Kim and J. W. Kim, Energy Fuels, 2017, 31, 7777–7782 CrossRef CAS.
- X. Liang, X. Wang, J. Zhuang, Y. Chen, D. Wang and Y. Li, Adv. Funct. Mater., 2006, 16, 1805–1813 CrossRef CAS.
- Z. Lin, Z. Zhang, Y. Li and Y. Deng, Chem. Eng. J., 2016, 288, 305–311 CrossRef CAS.
- G. H. Du, Z. L. Liu, X. Xia, Q. Chu and S. M. Zhang, J. Sol-Gel Sci. Technol., 2006, 39, 285–291 CrossRef CAS.
- C. Anushree and J. Philip, J. Mol. Liq., 2016, 222, 350–358 CrossRef CAS.
- L. Qiu, MS thesis, University of Alberta, 2010.
- F. Lin, L. He, J. Hou, J. Masliyah and Z. Xu, Energy Fuels, 2016, 30, 121–129 CrossRef CAS.
- S. Velusamy, S. Sakthivel and J. S. Sangwai, Ind. Eng. Chem. Res., 2017, 56, 13521–13534 CrossRef CAS.
- J. Coates, Interpretation of infrared spectra, a practical approach, Encyclopedia of analytical chemistry, Wiley, Chichester, 2000 Search PubMed.
- S. Xuan, F. Wang, J. M. Lai, K. W. Sham, Y. X. Wang, S. F. Lee, J. C. Yu, C. H. Cheng and K. C. Leung, ACS Appl. Mater. Interfaces, 2011, 3, 237–244 CAS.
- M. Shao, F. Ning, J. Zhao, M. Wei, D. G. Evans and X. Duan, J. Am. Chem. Soc., 2012, 134, 1071–1077 CrossRef CAS PubMed.
- X. Li, Y. Bai, H. Sui and L. He, Energy Fuels, 2017, 31, 1174–1181 CrossRef CAS.
- A. J. Lynch, J. S. Watt and G. Harbort, History of Flotation Technology, Littleton, 2007 Search PubMed.
Footnotes |
| † Electronic supplementary information (ESI) available. See DOI: 10.1039/c8ra01966e |
| ‡ These authors contribute equally to this work. |
| This journal is © The Royal Society of Chemistry 2018 |

