 Open Access Article
Magnesium β-ketoiminates as CVD precursors for MgO formation†
Elaheh Pousaneha,
Tobias Rüffer a,
Khaybar Assima,
Volodymyr Dzhagan
 bc,
Julian Nolla,
Dietrich R. T. Zahn
 b,
Lutz Mertensd,
Michael Mehring
 d,
Stefan E. Schulzef and
Heinrich Lang
 *a
*a
aTechnische Universität Chemnitz, Faculty of Natural Sciences, Institute of Chemistry, Inorganic Chemistry, D-09107 Chemnitz, Germany. E-mail: heinrich.lang@chemie.tu-chemnitz.de; Fax: +49-(0)371-531-21219; Tel: +49(0)371-531-21210
bTechnische Universität Chemnitz, Faculty of Natural Sciences, Institute of Physics, Semiconductor Physics, D-09107 Chemnitz, Germany
cV. E. Lashkaryov Institute of Semiconductors Physics, National Academy of Sciences of Ukraine, 03028 Kyiv, Ukraine
dTechnische Universität Chemnitz, Faculty of Natural Sciences, Institute of Chemistry, Coordination Chemistry, D-09107 Chemnitz, Germany
eTechnische Universität Chemnitz, Center for Microtechnologies, D-09107 Chemnitz, Germany
fFraunhofer Institute for Electronic Nano Systems ENAS, Technologie-Campus 3, D-09126 Chemnitz, Germany
First published on 29th May 2018
Abstract
The synthesis and characterization of bis(ketoiminato)magnesium(II) complexes of composition [Mg(OCR2CH2CHR1NCH2CH2X)2] (X = NMe2: 3a, R1 = R2 = Me; 3b, R1 = Me, R2 = Ph. X = OMe: 3c, R1 = R2 = Me) are reported. Complexes 3a–c are accessible by the reaction of C(O)R2CH2CHR1N(H)CH2CH2X (X = NMe2: 1a, R1 = R2 = Me; 1b, R1 = Me, R2 = Ph. X = OMe: 1c, R1 = R2 = Me) with MgnBu2. The structure of 3b in the solid state was determined by a single crystal X-ray diffraction study, confirming that the Mg(II) ion is hexa-coordinated by two ketoiminato ligands, while each of the latter coordinates with its two N- and one O-donor atom in an octahedral MgN6O2 coordination environment in the OC-6-33 stereo-isomeric form. The thermal behavior of 3a–c was studied by TG and DSC under an atmosphere of Ar and O2 respectively. The respective Me-substituted complexes 3a,c decompose at lower temperatures (3a, 166 °C; 3c, 233 °C) than the phenyl derivative 3b (243 °C). PXRD studies indicate the formation of MgO. Additionally, TG-MS studies were exemplarily carried out for 3a, indicating the release of the ketoiminato ligands. Vapor pressure measurements were conducted at 80 °C, whereby 3a,c possess with 5.6 mbar (3a) and 2.0 mbar (3c) significantly higher volatilities than 3b (0.07 mbar). Complexes 3a–c were used as MOCVD precursors for the deposition of thin MgO films on silicon substrates. It was found that only with 3a,c thin, dense and rather granulated MgO layers of thicknesses between 28–147 nm were produced. The as-deposited MgO layers were characterized by SEM, EDX, and XPS measurements and the thicknesses of the as-deposited layers were measured by Ellipsometry and SEM cross-section images. Apart from magnesium and oxygen a carbon content between 3–4 mol% was determined.
1 Introduction
Magnesium oxide is of major interest in a variety of applications, e.g. as an insulating coating for multilayer electronic and photonic devices,1 as a barrier for Josephson tunnel junctions,2 for the production of protective coatings of dielectrics on the walls of plasma panels,3,4 and as catalyst, e.g. for the ring-opening polymerization of lactide.5–8 MgO possesses a high melting point (2800 °C),9 a wide band gap (7.8 eV),10 high chemical stability,11 a high dielectric constant (κ = 9.8) and excellent electrical insulating properties.10Magnesium oxide films can be produced by different methodologies, including the sol–gel process,12,13 molecular beam epitaxy,14 pulsed-laser deposition,15 ion beam sputtering,16 electron beam evaporation,17 and laser ablation.18 For the formation of high-quality MgO deposits, CVD (Chemical Vapor Deposition) and ALD (Atomic Layer Deposition) are best suited, since uniform, conformal, and variable film thicknesses are obtained.19
Over the last few years, various organometallic and metal–organic compounds have been used as MgO CVD precursors, including [Mg(η5-C5H4R)2] (R = H,20 R = Me (ref. 21)), [Mg(β-diketonate)2] (β-diketonate = acac,22 thd22,23), [Mg(β-diketonate)2(tmeda)] (β-diketonate = thd,3,24 = hfac1), [Mg(O2CR)2] (R = C7H15, CNEt2),25 [Mg4Me4(OtBu)4],26 [Mg6(O2CNEt2)12],27 [Mg(DMADB)2]6, and [bis[5-N-(N,N-dimethylaminopropyl)-2,2,7-trimethyl-3-octanonato] magnesium]28 (acac = acetylacetonate, thd = 2,2,6,6-tetramethyl-3,5-heptanedionate, hfac = 1,1,1,5,5,5-hexafluoro-2,4-pentanedionate, tmeda = N,N,N′,N′-tetramethylethylenediamine, DMADB = N,N-dimethylaminodiboranate). Among them, the magnesium β-diketonates are very promising CVD precursors, due to their ability to fulfill the requirements needed for gas-phase deposition experiments, which are, for example, high stability and cost-effective and straightforward high yield synthetic methodologies.3,22
In order to avoid oligomerization processes, which may take place, for example, with β-diketonate or β-ketoiminate magnesium complexes, it is advantageous to introduce a third coordination site such as OR or NR2 units (R = single bonded organic group) at the respective chelating ligands.3 These groups are able to occupy an additional coordination site on the alkaline earth metals leading to less oligomerization of the molecules and thus increase the volatility of the complexes. In this respect, Rees and co-workers reported on the synthesis of the first example of such a metal–organic species, bis[5-N-(N,N-dimethylaminopropyl)-2,2,7-trimethyl-3-octanonato]magnesium,28 which successfully could be applied as precursor in the CVD process for MgO thin layer formation.28
This prompted us to enrich the family of β-ketoiminato magnesium complexes by three additional species, [Mg(OCR2CH2CHR1NCH2CH2X)2] (X = NMe2, OMe; R1, R2 = Me, Ph), in order to gain a better insight into the deposition performance of such type of complexes.
2 Experimental
2.1 Instruments and materials
The synthesis of 3a–c was carried out under an atmosphere of argon, using standard Schlenk techniques. Solvents were degassed prior to use. n-Hexane was purified by using the solvent purification system MS SPS-800 from MBraun. Anhydrous tetrahydrofuran was obtained by refluxing it with sodium/benzophenone ketyl. All reagents were obtained from commercial suppliers and were used as received.The 1H NMR spectra were performed with a Bruker Avance III 500 spectrometer operating at 500.3 MHz for 1H and at 125.8 MHz for 13C{1H} in the Fourier transform mode. The chemical shifts are reported in δ units (parts per million) relative to tetramethylsilane. Infrared spectra were recorded with a Thermo Nicolet IR 200 spectrometer. The melting points were determined with a Gallenkamp MFB 595 010 M melting point apparatus. High-resolution mass spectra were conducted with a micrOTOF-QII Bruker Daltonite workstation.
TGA/DSC experiments were performed with a Mettler Toledo TGA/DSC1 1100 system with a UMX1 balance. The TG-MS experiment was performed with a Mettler Toledo TGA/DSC1 1600 system with a MX1 balance coupled with a Pfeifer Vacuum MS Thermostar GSD 301 T2 mass spectrometer. For PXRD measurements the STOE powder diffractometer STOE Stadi P with Ge(111) monochromator Cu-Kα radiation (λ = 0.15406 nm, 40 kV, 40 mA) was applied. Chemical vapor deposition experiments were carried out in a home-built vertical cold-wall reactor equipped with a heater surface dimension of 20 × 20 mm from BACH Resistor Ceramics GmbH.29 A heat capacity measurement of up to 520 °C could be realized, controlled by a Gefran 600 module, which is connected with a Pt 100 thermo sensor. The carrier gas flow (N2, 50 mL min−1) and the reactive gas flow (O2, 40 mL min−1) were controlled by MKS type 247 mass flow controllers connected to the reactor by heated copper lines. The pressure within the reactor was controlled with an Edwards Active Gauge Controller (PKR 251). The continuous evaporation of the MOCVD precursors was carried out by an oil pump (EXC 120) from Edwards. The thickness of the layers was measured using Spectroscopic Ellipsometry M–2000UI from J. A. Woolam Co. (wavelength range 245–1690 nm (5.06–0.73 eV), angle of incidence 45, 50, 55, 60, 70, and 75°). The surface morphology of the as-prepared layers was investigated by field-emission scanning electron microscopy (SEM) using a ZEISS Supra 60 SEM microscope. Energy-dispersive X-ray analyses were carried out with a Bruker Quantax 400 system, attached to the SEM to determine the chemical composition of the films (operating voltage 3 keV). XPS measurements were performed with an ESCALAB 250Xi XPS Microprobe (Thermo Scientific) equipped with a monochromatized Al Kα X-ray source (hν = 1486.6 eV). The survey and high-resolution spectra were acquired at a bandpass energy of 200 and 20 eV, respectively. The binding energy was calibrated with respect to the C1s peak at 284.5 eV. Avantage (Thermo Scientific) software was used for XPS spectra analysis and the calculation of the atomic composition of the samples (Scofield relative sensitivity factors were applied30).
β-Ketoimines 1a,5 1b31 and 1c32 were prepared according to literature procedures by the condensation reaction of the appropriate β-diketones with one equivalent of the corresponding amine. The isolated β-ketoimines were dried with MgSO4 and purified via distillation under reduced pressure.
2.2 General synthesis procedure for the preparation of 3a–c
β-Ketoimines 1a–c (2 equiv.) were dissolved in 20 mL of tetrahydrofuran under an atmosphere of argon. To this solution 1 equiv. of MgnBu2 was added in a single portion at −30 °C. After warming the reaction mixture to ambient temperature it was stirred for 12 h. Afterward, the reaction solution was filtered off, all volatiles were evaporated in vacuum and the as-obtained precipitate was dried in vacuum. The pale yellow solid was purified by washing it thrice with 40 mL of n-hexane each. Afterward, complexes 3a–c were purified by sublimation under reduced pressure (see below).Mp. 130 °C. Anal. calcd. (%) for C18H34MgN4O2: C 59.59, H 9.45, N 15.44; found C 59.35, H 9.56, N 15.40. IR (KBr, v/cm−1): 2980 vw, 2920 vw, 1612 m, 1579 s, 1505 s, 1482 s, 1411 s, 1339 s, 1289 w, 1243 w, 1019 m, 930 m, 786 m, 786 m, 733 s, 668 m. 1H NMR (C6D6, δ): 1.63 (s, 6H, NCMe), 1.96 (s, 12H, NMe2), 1.98 (s, 6H, OCMe), 2.6–3.0 (m, 8H, N(CH2)2), 4.92 (s, 2H, CH). 13C{1H} NMR (C6D6, δ): 21.84 (NCMe), 27.91 (OCMe), 46.33 (NMe2), 46.61 (NCH2), 59.17 (NCH2), 95.89 (CH), 171.04 (CNMe), 180.90 (OCMe). HR-MS: calcd for C18H34MgN4O2: 362.2532; found m/z = 363.2617 [M + H]+.
Mp. 180 °C. Anal. calcd. (%) for C28H38MgN4O2: C 69.07, H 7.87, N 11.51; found C 68.54, H 7.90, N 11.29. IR (KBr, v/cm−1): 2990 vw, 2910 vw, 1588 s, 1500 s, 1420 s, 1477 s,1344 s, 1289 m, 1259 m, 1113 w, 1025 m, 1068 w, 942 w, 859 m, 796 m,782 m, 752 s, 712 s, 682 s. 1H NMR (C6D6, δ): 1.75 (s, 6H, NCMe), 1.95 (s, 12H, NMe2), 2.7–3.1 (m, 8H, N(CH2)2), 5.74 (s, 2H, CH), 7.08–8.14 (m, 10H, Ph), 13C {1H} NMR (C6D6, δ): 22.49 (NCMe), 45.43 (NCH2), 59.05 (NCH2), 46.82 (NMe2), 94.14 (CH), 127.39 CHCCO, 128.35 (CHCHC), 128.40 (CHCHCH), 143.30 (CHCCO), 171.69 (CNMe), 175.10 (OCPh). HR-MS: calcd. for C28H38MgN4O2: 486.2845; found m/z = 487.2953 [M + H]+.
Mp. 110 °C. Anal. calcd. (%) for C16H28MgN2O4: C 57.07, H 8.38, N 8.32; found C 56.77, H 8.65, N 8.27. IR (KBr, v/cm−1): 2990 vw, 2910 vw, 1582 s, 1504 s, 1478 s,1410 s, 1340 s, 1108 m, 1071 m, 1033 m, 1007 w, 936 m, 864 w, 736 m, 661 w. 1H NMR (C6D6, δ): 1.58 (s, 6H, NCMe), 2.02 (s, 6H, OCMe), 3.02 (s, 6H, OMe), 3.1–3.7 (m, 8H, N(CH2)2), 4.94 (s, 2H, (CH). 13C{1H} NMR (C6D6, δ): 21.53 (NCMe), 27.99 [OCMe), 48.21 (NCH2), 58.65 (OMe), 71.59 (NCH2), 96.46 (CH), 169.98 (CNMe), 181.63 (OCMe). HRMS: calcd. for C16H28MgN2O4: 336.1899; found m/z = 337.1985 [M + H]+.
![[thin space (1/6-em)]](https://www.rsc.org/images/entities/char_2009.gif) :
:![[thin space (1/6-em)]](https://www.rsc.org/images/entities/char_2009.gif) 1 (v/v) containing 3b at −30 °C. Data were collected with an Oxford Gemini S diffractometer with Cu Kα radiation. The structure was solved by direct methods and refined by full-matrix least-squares methods on F2 with SHELXS/SHELXL-2013.33 All non-hydrogen atoms were refined anisotropically. All carbon-bonded hydrogen atoms were geometrically placed and refined isotropically in riding modes using default SHELX parameters. Selected crystal and structural refinement data of 3b are summarized in Table 1. Selected bond distances and bond angles are listed in the caption of Fig. 1. The atoms C12–C14, N2 and O1 of the dimethylaminoethyl group of the β-ketoiminato ligand are disordered and were refined to split occupancies of 0.5/0.5. Data have been deposited with the Cambridge Structural Database under CCDC 1569233.
1 (v/v) containing 3b at −30 °C. Data were collected with an Oxford Gemini S diffractometer with Cu Kα radiation. The structure was solved by direct methods and refined by full-matrix least-squares methods on F2 with SHELXS/SHELXL-2013.33 All non-hydrogen atoms were refined anisotropically. All carbon-bonded hydrogen atoms were geometrically placed and refined isotropically in riding modes using default SHELX parameters. Selected crystal and structural refinement data of 3b are summarized in Table 1. Selected bond distances and bond angles are listed in the caption of Fig. 1. The atoms C12–C14, N2 and O1 of the dimethylaminoethyl group of the β-ketoiminato ligand are disordered and were refined to split occupancies of 0.5/0.5. Data have been deposited with the Cambridge Structural Database under CCDC 1569233.
| a Rint = ∑|F02 − F02 (mean)|/∑F02, where F02 (mean) is the average intensity of symmetry equivalent diffractions.b S = [∑w (F02 − F20)2]/(n − p)1/2, where n = number of reflections, p = number of parameters.c R = [∑(‖F0| − |F0|)/∑|F0|); R[∑(w(F02 − F02))2/∑(wF04)]1/2. | |
|---|---|
| Compound | 3b |
| Empirical formula | C28H38MgN4O2 |
| Formula mass (g mol−1) | 486.93 |
| Crystal system | Orthorhombic |
| Space group | Pccn |
| a (Å) | 10.3635(2) |
| b (Å) | 16.8790(4) |
| c (Å) | 15.2483(3) |
| V (Å3) | 2667.32(10) |
| Z | 4 |
| Dcalc(Mg m−3) | 1.213 |
| Wavelength (Å) | 1.54184 |
| Temperature (K) | 120 |
| Absorption coefficient (mm−1) | 0.818 |
| F(000) | 1048 |
| Reflections collected | 5165 |
| Reflections unique/Rinta | 2303/0.0245 |
| Goodness-of-fit on F2b | 1.025 |
| Data/restrains/parameters | 2304/27/200 |
| θ Range for data collection (°) | 5.008 to 65.981 |
| Limiting indices | −12 ≤ h ≤ 11, −18 ≤ k ≤ 19, −10 ≤ l ≤ 17 |
| Final R indices [I > 2σ(I)]c | R1 = 0.0448, wR2 = 0.1100 |
| R Indices (all data)c | R1 = 0.0483, wR2 = 0.1124 |
| Largest diff. peak/hole (e Å−3) | 0.241 and −0.263 |
3 Results and discussion
3.1 Synthesis and characterization
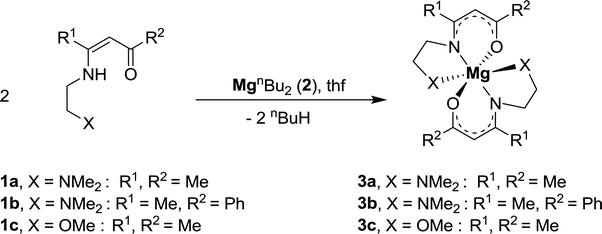
Complexes 3a–c were prepared by the reaction of MgnBu2 (2) with 1a–c in the molar ratio of 1![[thin space (1/6-em)]](https://www.rsc.org/images/entities/char_2009.gif) :
:![[thin space (1/6-em)]](https://www.rsc.org/images/entities/char_2009.gif) 2 in tetrahydrofuran as solvent at −30 °C (eqn (1)). After appropriate work-up, pale yellow solids were isolated in yields ≥ 85%. All complexes are soluble in common organic polar solvents such as tetrahydrofuran and diethyl ether.
2 in tetrahydrofuran as solvent at −30 °C (eqn (1)). After appropriate work-up, pale yellow solids were isolated in yields ≥ 85%. All complexes are soluble in common organic polar solvents such as tetrahydrofuran and diethyl ether.
 | (1) |
The identity of 3a–c has been confirmed by 1H, 13C{1H} NMR and IR spectroscopy, elemental analysis and high-resolution ESI-TOF (Electro Spray-Ionization Time-of-Flight) mass spectrometry. The structure of 3b in the solid state was determined by single crystal X-ray structure analysis. The thermal decomposition behavior of 3a–c was studied by TG and DSC measurements. In addition, the vapor pressures of these species were determined.
The 1H NMR spectra of 3a–c show the characteristic singlets for the respective ketoiminato CH protons at 4.92 (3a), 5.74 (3b) or 4.94 ppm (3c). As expected, these resonances are somewhat downfield shifted, when compared to the respective ketoimines 1a–c (1a, 4.87; 1b, 5.69; 1c, 4.86 ppm) and hence this shifting can be used to monitor the reaction to give 3. During the course of this reaction, the signal of the enolic oxygen-bonded hydrogen atom in 1a–c disappears. All other resonance signals are found as expected.
In the 13C{1H} NMR spectra, the CH carbon signals of the respective ketoiminato units are observed at 95.89 (3a), 94.14 (3b) or 96.46 ppm (3c), which is in accordance with spectra of other Mg-ketoiminato complexes.28 The NCMe carbons resonate at 21.84 (3a), 22.49 (3b) and 21.53 (3c) ppm. The respective signals are shifted to lower field as compared to the reactants 1a–c (18.47 (1a), 19.05 (1b) and 18.56 (1c)).
The IR spectra of 3a–c are characterized by strong ν(C![[double bond, length as m-dash]](https://www.rsc.org/images/entities/char_e001.gif) N) vibrations at 1580–1590 cm−1. Compared to 1a–c these bands are shifted towards lower frequencies confirming the coordination of 1a–c to Mg(II).32
N) vibrations at 1580–1590 cm−1. Compared to 1a–c these bands are shifted towards lower frequencies confirming the coordination of 1a–c to Mg(II).32
High-resolution ESI-TOF studies show the molecular ion peak [M + H]+ at m/z = 363.2617 for 3a, 487.2953 for 3b and 337.1985 for 3c.
The phenyl derivative 3c shows with 180 °C a significant higher melting point than the methyl-functionalized species 3a,b (130, 110 °C).
3.2 Crystal structure
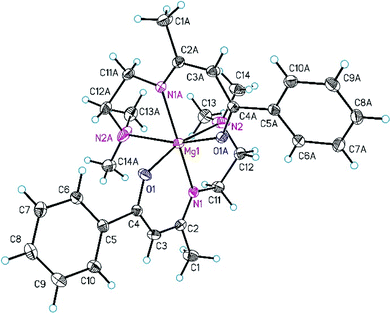
The molecular structure of 3b in the solid state is depicted in Fig. 1. This complex crystallizes in the orthorhombic space group Pccn and exhibits crystallographically imposed inversion symmetry with the inversion center located at Mg1.As shown in Fig. 1, the Mg(II) ion is hexa-coordinated by two tridentate β-ketoiminato ligands occupying meridional sides and a distorted octahedral MgN2O6 coordination geometry in the OC-6-33 form. Deviations from the idealized octahedral geometry are observed, for example, the bond angles of trans- and cis-bonded donor atoms range from 164.87(8) to 165.4(3)° and 76.8(3) to 104.2(8)°, respectively (Fig. 1). The Mg–N2 distance of 2.46(2) Å is larger than the Mg–N1 one (2.1266(13) Å), confirming an unsymmetrical distribution of the charge within the delocalized ketoiminato ligand, which is comparable with bis[5-N-(N,N-dimethylaminopropyl)-2,2,7-trimethyl-3-octanonato]magnesium.28
3.3 Thermal analysis
The thermal decomposition behavior of 3a–c was investigated by TG (Thermogravimetry) and DSC (Differential Scanning Calorimetry) to achieve first information on the decomposition behavior of these complexes. All experiments were performed under a flow of argon (gas flow 20 mL min−1) and oxygen (gas flow 20 mL min−1) in the temperature range of 40–800 °C with a heating rate of 10 °C min−1. Additionally, a continuous argon carrier gas flow of 40 mL min− 1 was used for all measurements. The respective TG traces of 3a–c are depicted in Fig. 2, whereas the onset temperatures are summarized in Table 2.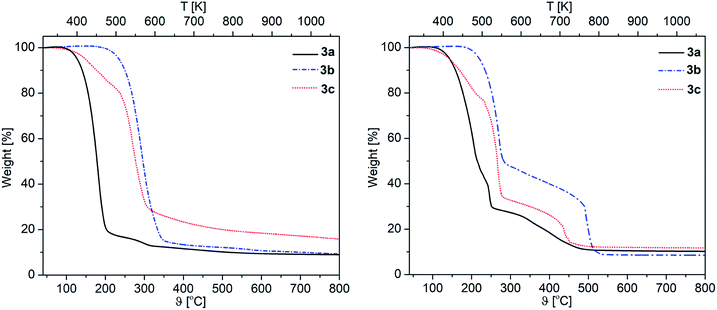 | ||
| Fig. 2 TG traces of 3a–c under an atmosphere of argon (left) and O2 (right) (gas flow 20 mL min−1, heating rate 10 °C min−1). | ||
| Compd. | Onset temp. Ar [°C] | Onset temp. O2 [°C] |
|---|---|---|
| a Ar, O2 (gas flow 20 mL min−1) (Ar carrier gas flow 40 mL min−1, heating rate 10 °C min−1). | ||
| 3a | 152 | 166 |
| 3b | 253 | 243 |
| 3c | 120 | 233 |
The appropriate TG traces obtained under an atmosphere of argon show that the thermal decomposition of 3a,c occurs in two steps, while 3b shows only a single step decomposition (Fig. 2). The nature of the β-ketoiminato ligands has a significant effect on the decomposition temperature of 3a–c. This was observed, for example, for the phenyl containing β-ketoiminate as the respective complex 3b exhibits the highest thermal stability (Table 2). In contrast, complex 3c shows the lowest onset temperature of 120 °C in the argon atmosphere. A similar behavior was observed by Podkościelna et al.34 in the course of thermal behaviors study of copolymers naphthalene-2,7-diol dimethacrylate derivatives, which highest thermal stability was obtained in presence of aromatic rings.34
A different thermal behavior was observed for 3a–c, when the experiments were carried out under oxygen (Fig. 2). In contrast to the studies under argon, the complexes 3a–c follow a multi-step decomposition under oxygen. This is probably due to the reactivity of oxygen, which could produce during the heating process MgCO3 and additional C,O fragments,35,36 and lead to multiple thermal decomposition processes.
In terms of the residues obtained from the TG experiments, 3a showed with 8.9% (O2) and 10.5% (Ar) lower values than calculated for MgO (11.0%), demonstrating that this complex partially evaporates during the heating process. For 3b,c the weight of the residues are somewhat higher than the theoretical values (3b, O2: 9.2%, Ar: 8.6% (theory 8.2%). 3c, O2: 15.9%, Ar: 12.1% (theory 11.8%)). This indicates that most probably the respective residues contain some impurities.
The DSC traces of 3a–c under O2 are shown in Fig. 3, while those under Ar are depicted in the ESI (Fig. S1–S3†). The appropriate DSC traces are characterized by endothermic and exothermic processes. The endothermic peak at 180 °C (3b), which appears only under argon, confirms the melting of this complex (Fig. S2, ESI†). Under an atmosphere of oxygen, however, characteristic exothermic peaks are observed at 243 °C (E = 178.02 J g−1) (3a), 491 °C (E = 3649.47 J g−1) (3b) and 445 °C (E = 1447.26 J g−1) (3c), belonging to the decomposition of the respective complexes (Fig. 3).
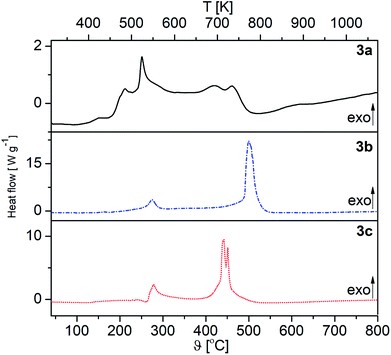 | ||
| Fig. 3 DSC traces of 3a–c under oxygen (oxygen carrier gas flow 20 mL min−1, heating rate 10 °C min−1). | ||
PXRD measurements of the residues of the TG experiments confirmed the formation of crystalline MgO (ICDD 01-071-1176). Representative, the diffractogram of 3a is depicted in Fig. 4, whereas those of 3b and 3c can be found in the ESI (Fig. S4–S5†). The related crystallite sizes were calculated by using the Scherrer equation based on reflection (200). The evaluation displays crystallite sizes of 15 ± 1 (Ar) and 17 ± 1 nm (O2) for 3a, while values between 8–17 nm were calculated for 3b and 3c (see captions of Fig. S4 and S5†).
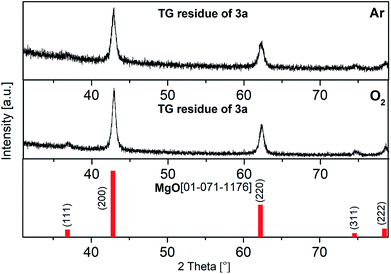 | ||
| Fig. 4 PXRD pattern of the TG residues of 3a under argon (top) vs. under oxygen (middle); red: crystalline MgO (ICDD 01-071-1176). (Crystal size: top: 15 ± 1 nm, middle: 17 ± 1 nm). | ||
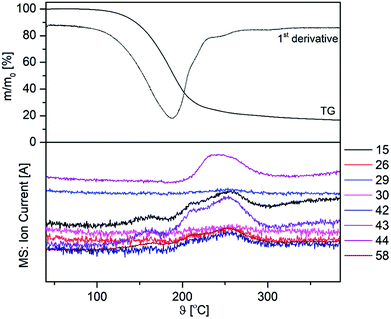
On the example of 3a, TG-MS-coupled experiments were performed in order to obtain a deeper insight into the decomposition behaviour of 3a–c. The appropriate TG-MS traces, including the TG and the ion current curves of the respective mass-to-charge ratios (m/z) are depicted in Fig. 5. The mass-loss can be described as a partial evaporation and decomposition of 3a. Within this study we were not able to detect either the molecular ion peak, nor the β-ketoiminato ligand Me2N(CH2)2NCMeCHCMeO+, rather fragments such as m/z = 15 (CH3+), 29 (C2H5+, CHO+), 44 (C3H8N+, C3H6O+) and 58 (CH3CHO+), corresponding to the chelating β-ketoiminato unit.
3.4 Vapor pressure measurement
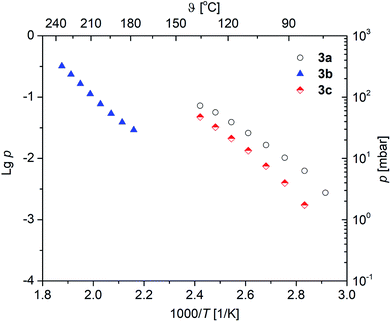
Vapor pressure measurements were performed for 3a–c to decide if these complexes are suitable as MOCVD (Metal–Organic Chemical Vapor Deposition) precursors for MgO deposition. For more details of the applied methodology see ref. 29 and 37. All vapor pressure studies were carried out thrice to obtain a reliable experimental data set. The respective vapor pressures, as a function of the temperature, are depicted in Fig. 6. The studies were carried out at a temperature regime below the onset temperature as established by TG studies in order to avoid thermal decomposition of 3a–c during the investigations. The corresponding Antoine parameters are summarized in Table 3. From the respective vapor pressure traces in Fig. 6 it can be seen that, as expected, the vapor pressure is affected by the β-ketoiminato ligands and hence the molecular weight of the complexes. The highest volatility is found for 3a with 5.6 mbar, while 3c possesses a vapor pressure of 2.0 mbar at 80 °C. Both methyl-functionalized complexes revealed significantly higher volatilities, as compared with the phenyl-substituted species 3b (0.07 mbar at 80 °C). This is explained by the lower molecular weight of 3a,c in comparison to 3b.The vapor pressures of the selected magnesium oxide precursors are summarized in Table 4. As it can be seen from this table, 3a (5.6 mbar at 80 °C) and 3c (2.0 mbar at 80 °C) possess higher values than reported magnesium precursors, i.e. [Mg(tfac)2(tmeda)] (0.46 mbar at 93 °C), [Mg2(thd)4] (0.2 mbar at 120–130 °C), [Mg(thd)2(tmeda)] (0.2 mbar at 100–110 °C), Mg(thd)2(dien)] (1.20 mbar at 110–130 °C) and [Mg(thd)2(trien)] (0.30 mbar at 145–170 °C). In comparison, the vapor pressure of 3b (0.07 mbar at 80 °C) is in the same order of magnitude.38,39 However, since the methodologies used to determine vapor pressures are quite different, the comparison of the vapor pressure values might be misleading in some cases.
| Complex | Vapor pressure [mbar] | At temperature [°C] | Literature |
|---|---|---|---|
| a tfac = 1,1,1-trifluoropentan-2,4-dionate, tmeda = N,N,N′,N′-tetramethylethylenediamine, deeda = N,N′-diethylethylenediamine, dien = diethylenetriamine, trien = triethylenetetraamine. | |||
| 3a | 5.6 | 80 | — |
| 3b | 0.07 | 80 | — |
| 3c | 2.0 | 80 | — |
| [Mg(thd)2(trien)] | 0.30 | 145–170 | 38 |
| [Mg2(thd)4] | 0.2 | 120–130 | 38 |
| [Mg(thd)2(tmeda)] | 0.2 | 100–110 | 38 |
| [Mg(thd)2(deeda)] | 0.21 | 90–100 | 38 |
| [Mg(thd)2(dien)] | 1.20 | 110–130 | 38 |
| [Mg(tfac)2(tmeda)] | 0.46 | 93 | 39 |
3.5 Chemical vapor deposition
Complexes 3a–c were successfully used as MOCVD precursors for MgO formation on silicon substrates featuring native silicon oxide coatings. The appropriate experiments were conducted in a home-built vertical cold-wall CVD reactor equipped with a continuous evaporation system.29 The MOCVD experiments carried out with 3a,c resulted in the formation of thin, homogeneous MgO films, when nitrogen (gas flow 50 mL min−1) as carrier gas and oxygen as reactive gas (gas flow 40 mL min−1) at a 1 mbar pressure were used. For comparison, deposition studies were also carried out solely under N2.The respective precursors were heated to temperatures between 80–120 °C in the vaporizer unit of the CVD reactor under reduced pressure. The reactor glass cover was additionally heated to approximately 100 °C. These measures were necessary to achieve a convenient precursor flow rate. The deposition time was set to 60 min for all precursors in order to have uniform conditions. According to the TG studies the substrate temperature was set to 450 °C for complexes 3a–c and additionally to 510 °C for 3b. The applied deposition conditions are summarized in Table 5. As result thereof, it can be rated that 3a,c gave MgO layers, while 3b did not result in magnesium oxide film formation up to 510 °C. This is most probably attributed to the higher decomposition temperature and hence higher thermal stability of this complex as investigated by TG and DSC studies. The as-deposited films are of thicknesses between 28 and 147 nm, evidenced from the cross-sectional images shown below. The thinner films are beige coloured, whereas thicker films possess a dark blue appearance.
| Compd. | θ(dep.) [°C] | θ(Precursor) [°C] | Thicknessc [nm] | Pressure [mbar] | N2 flow rate [mL min−1] | O2 flow rate [mL min−1] | Growth rate [nm min−1] |
|---|---|---|---|---|---|---|---|
| a In presence of oxygen.b Without addition of oxygen.c Determined from Ellipsometry. | |||||||
| 3aa | 450 | 80 | 28.3 | 1 | 50 | 40 | 0.47 |
| 3ab | 450 | 80 | 69.6 | 1 | 50 | — | 1.16 |
| 3ba | 450, 510 | 120 | — | 1 | 50 | 40 | — |
| 3bb | 450, 510 | 120 | — | 1 | 50 | — | — |
| 3ca | 450 | 90 | 44.6 | 1 | 50 | 40 | 0.74 |
| 3cb | 450 | 90 | 147.0 | 1 | 50 | — | 2.45 |
3.6 Film characterization
The morphology of the as-deposited layers obtained from 3a,c were determined by Scanning Electron Microscopy (SEM). The elemental composition was determined by Energy Dispersive X-ray spectroscopy (EDX) and X-ray Photoelectron Spectroscopy (XPS). The SEM images show that uniform, crack-free and homogeneous layers were obtained with a granulated topography (Fig. 7). The quality of the films in terms of surface morphology is comparable with the one derived from bis[5-N-(N,N-dimethylaminopropyl)-2,2,7-trimethyl-3-octanonato]magnesium.28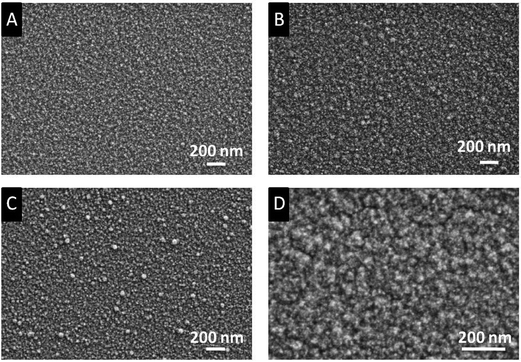 | ||
| Fig. 7 SEM images of the as-deposited films (applied parameters are given in Table 5). Films A and C were obtained, when the depositions were carried out under oxygen (N2/O2 ratio 10/8). Films B and D without oxygen. Images A, B: deposits from 3a; C, D: from 3c. | ||
The film thicknesses were determined by cross-section SEM images (Fig. 8) and Ellipsometry (Table 5). Utilizing the layer thicknesses obtained by Ellipsometry, the growth rate per minute was calculated for each precursor (Table 5). Thereby, metal–organic complex 3c possesses with 2.45 nm min−1 the highest growth rate. As it can be seen from Fig. 8 and from Fig. S6–S8 (ESI†), the films formed without addition of any reactive gas are thicker (3a, 69.6 nm; 3c, 147.0 nm), if compared to those obtained from the experiments with oxygen (3a, 28.3 nm; 3c, 44.6 nm). This is most probably based on reactions of the precursors with oxygen in gas phase yielding less precursor molecules on the substrate surface. The thicknesses of the MgO layers determined by cross-section SEM images show slightly different values with Ellipsometry (3a, 63 nm; 3c, 135 nm (Ar) and (3a, 29 nm; 3c, 43 nm (O2)).
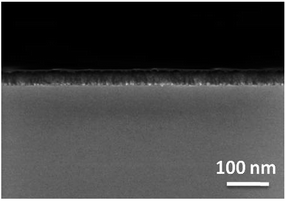 | ||
| Fig. 8 Cross-section image of the MgO layer obtained from 3a, substrate temperature 450 °C, deposition time 1 h, working pressure 1 mbar, N2 (50 mL min−1). | ||
The as-deposited layers were analyzed by EDX (3a, (O2) Fig. 9 and layers 3a (N2) and 3c, Fig. S9–S11 (ESI†)). From the EDX spectra of 3a,c peaks for Mg, O, N, C, and Si can be seen of which O (partly) and Si can be assigned to the substrate material (Fig. 9). Hence, the energy of the electron beam was reduced from 15 to 3 keV in order to reduce the penetration depth. As a result, thereof, the signals for the latter two elements decreased, while the respective signals for Mg increased (ESI, Fig. S9–S11†).
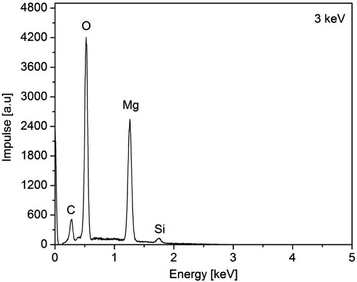 | ||
| Fig. 9 EDX spectra of the as-obtained MgO film of 3a, N2 (50 mL min−1), O2 (40 mL min−1), substrate temperature 450 °C. | ||
Additionally, XPS measurements were performed on the obtained MgO films. For removing surface contaminations, the layers were preliminary sputtered with argon ions with energies of 4.0 keV for 2 min. A typical XPS spectrum of a MgO layer deposited at 450 °C using 3c as precursor is shown in Fig. 10. The XPS spectra of all other samples are presented in the ESI (Fig. S12–S14†) and the related XPS results are summarized in Table 6. The peaks arising from Mg 2p, O 1s, C 1s, and Si 2s appear at 50.6, 531.0, 284.2 eV, and 153.6 eV, respectively, and were used to calculate the chemical composition of the layers. The position of the Mg 2p (BE = 50 eV), as well as of Mg 1s (BE = 1303 eV), Mg 2s (89 eV) and O1s (530.5 eV) peaks are in good agreement with the earlier reports on MgO,40,41 confirming the MgO as the main phase. This could be also verified by the oxygen content of the samples. For the two thinner films, 28 and 44 nm, oxygen from the substrate distorts the Mg![[thin space (1/6-em)]](https://www.rsc.org/images/entities/char_2009.gif) :
:![[thin space (1/6-em)]](https://www.rsc.org/images/entities/char_2009.gif) O ratio in the latter two samples, but the two thicker films without substrate contribution show Mg
O ratio in the latter two samples, but the two thicker films without substrate contribution show Mg![[thin space (1/6-em)]](https://www.rsc.org/images/entities/char_2009.gif) :
:![[thin space (1/6-em)]](https://www.rsc.org/images/entities/char_2009.gif) O ratio close to 1
O ratio close to 1![[thin space (1/6-em)]](https://www.rsc.org/images/entities/char_2009.gif) :
:![[thin space (1/6-em)]](https://www.rsc.org/images/entities/char_2009.gif) 1 (Table 6). The high-resolution XPS spectra reveal relatively sharp and symmetrical Mg 2p and O 1s in the sputtered sample (ESI, Fig. S15†), while in the as-deposited one additional contributions of hydroxide species at higher BEs contribute to both spectra, as commonly observed for MgO surface.41 Si peaks appear after sputtering, most probably partially originating from the Si/SiO2 substrate surface.
1 (Table 6). The high-resolution XPS spectra reveal relatively sharp and symmetrical Mg 2p and O 1s in the sputtered sample (ESI, Fig. S15†), while in the as-deposited one additional contributions of hydroxide species at higher BEs contribute to both spectra, as commonly observed for MgO surface.41 Si peaks appear after sputtering, most probably partially originating from the Si/SiO2 substrate surface.
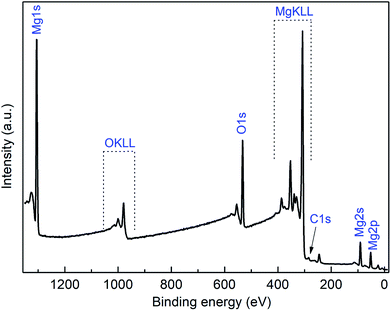 | ||
| Fig. 10 XPS spectra of the MgO film obtained from 3a at 450 °C (N2, 50 mL min−1; after 2 min sputtering, Ar+, 4.0 keV). | ||
Complexes 3a,c produced MgO layers, which show less carbon contamination (3–4%) in comparison to similar molecules such as ketoiminate [bis[5-N-(N,N-dimethylaminopropyl)-2,2,7-trimethyl-3-octanonato]magnesium] (7% carbon content after 120 min sputtering).28 The studies confirm the suitability of the 3a,c precursors for the formation of MgO layers by the MOCVD process.
To evaluate the crystallinity of the as-deposited films, PXRD measurements were performed for all samples obtained from the CVD studies. Thereby, the layer formed by using 3c without oxygen was the only sample that led to an assignable diffractogram (Fig. S16†). All other deposits did not reveal any reflexes indicating the amorphous nature of them. However, this could be also attributed to the film thickness as only the layer with 147 nm (3c) provided valuable data. From Fig. S16† it can be seen that the crystalline part of the film consists of cubic MgO (ICDD 01-071-1176).
4 Conclusion
The synthesis, characterization and CVD application of three magnesium(II) β-ketoiminato complexes of type [Mg(OCR2CH2CHR1NCH2CH2X)2] (X = NMe2: 3a, R1 = R2 = Me; 3b, R1 = Me, R2 = Ph. X = OMe: 3c, R1 = R2 = Me) are described. They were prepared by the reaction of HOCR2CH2CHR1NCH2CH2X (1a–c) with MgnBu2 in the ratio of 2![[thin space (1/6-em)]](https://www.rsc.org/images/entities/char_2009.gif) :
:![[thin space (1/6-em)]](https://www.rsc.org/images/entities/char_2009.gif) 1. The molecular structure of 3b in the solid state was determined by a single crystal X-ray diffraction study. The Mg(II) ion is hexa-coordinated by two β-ketoiminato ligands to form a distorted octahedral MN2O6 coordination setup in the OC-6-33 form. Thermogravimetric analyses were carried out for 3a–c showing that 3a undergoes partial evaporation upon heating, while 3b,c were decomposed without evaporation during the heating process. PXRD measurements of the TG residues confirmed the formation of crystalline MgO. Vapor pressure studies on 3a–c indicated that they are suitable MOCVD precursors as volatilities of 5.6 mbar, 0.07 mbar and 2.0 mbar at 80 °C were determined. These values confirmed that 3a,c are more volatile that β-diketonato complexes of type [Mg(tfac)2(tmeda)] (0.4 mbar at 93 °C) and [Mg2(thd)4] (0.2 mbar at 120–130 °C), respectively.38,39 CVD studies carried out with 3a,c resulted in the formation of magnesium oxide thin films under an atmosphere of solely nitrogen, and in presence of oxygen as reactive gas. During the deposition experiments the substrate temperature was kept at 450 °C for 3a,c and up to 510 °C for 3b. However, complex 3b did not result in magnesium oxide film formation, which is most probably attributed to the high decomposition temperature and hence high thermal stability of this complex. All received layers were dense and coherent as proven by SEM studies. The thicknesses of the layers were measured by Ellipsometry as well as SEM cross-section images. The elemental composition of the as-deposited films was analyzed by EDX and XPS. While by the EDX spectroscopy elements such as magnesium, oxygen and carbon were found, the XPS studies confirmed the formation of MgO thin films. Moreover, in comparison with literature known magnesium ketoiminates complexes, such as bis[5-N-(N,N-dimethylaminopropyl)-2,2,7-trimethyl-3-octanonato]magnesium,28 the appropriate MgO films obtained starting from 3a,c show less carbon contamination. Amorphous magnesium oxide layers are of major interest in a variety of applications, i.e. as barrier for Josephson tunnel junctions.42 In addition, amorphous MgO layers, containing C as contamination are promising materials for multifunctional memory and ultralow-power consumption spintronics, due to their ferromagnetism properties.43–46 However, the crystallinity of MgO layers depends not only on the substrate temperature but also on the oxygen flow,47 which can change by using diverse precursors.48–50
1. The molecular structure of 3b in the solid state was determined by a single crystal X-ray diffraction study. The Mg(II) ion is hexa-coordinated by two β-ketoiminato ligands to form a distorted octahedral MN2O6 coordination setup in the OC-6-33 form. Thermogravimetric analyses were carried out for 3a–c showing that 3a undergoes partial evaporation upon heating, while 3b,c were decomposed without evaporation during the heating process. PXRD measurements of the TG residues confirmed the formation of crystalline MgO. Vapor pressure studies on 3a–c indicated that they are suitable MOCVD precursors as volatilities of 5.6 mbar, 0.07 mbar and 2.0 mbar at 80 °C were determined. These values confirmed that 3a,c are more volatile that β-diketonato complexes of type [Mg(tfac)2(tmeda)] (0.4 mbar at 93 °C) and [Mg2(thd)4] (0.2 mbar at 120–130 °C), respectively.38,39 CVD studies carried out with 3a,c resulted in the formation of magnesium oxide thin films under an atmosphere of solely nitrogen, and in presence of oxygen as reactive gas. During the deposition experiments the substrate temperature was kept at 450 °C for 3a,c and up to 510 °C for 3b. However, complex 3b did not result in magnesium oxide film formation, which is most probably attributed to the high decomposition temperature and hence high thermal stability of this complex. All received layers were dense and coherent as proven by SEM studies. The thicknesses of the layers were measured by Ellipsometry as well as SEM cross-section images. The elemental composition of the as-deposited films was analyzed by EDX and XPS. While by the EDX spectroscopy elements such as magnesium, oxygen and carbon were found, the XPS studies confirmed the formation of MgO thin films. Moreover, in comparison with literature known magnesium ketoiminates complexes, such as bis[5-N-(N,N-dimethylaminopropyl)-2,2,7-trimethyl-3-octanonato]magnesium,28 the appropriate MgO films obtained starting from 3a,c show less carbon contamination. Amorphous magnesium oxide layers are of major interest in a variety of applications, i.e. as barrier for Josephson tunnel junctions.42 In addition, amorphous MgO layers, containing C as contamination are promising materials for multifunctional memory and ultralow-power consumption spintronics, due to their ferromagnetism properties.43–46 However, the crystallinity of MgO layers depends not only on the substrate temperature but also on the oxygen flow,47 which can change by using diverse precursors.48–50
Conflicts of interest
There are no conflicts to declare.Acknowledgements
This work was supported by the German Research Foundation (Cluster of Excellence Center for Advancing Electronics Dresden (cfaed) and partially performed within the Federal Cluster of Excellence EXC 1075 MERGE Technologies for Multifunctional Lightweight Structures. In addition, Dirk Rittrich from the Fraunhofer Institute for Electronic Nano Systems (ENAS) is acknowledged for measuring the SEM and EDX spectra and Natalia Rüffer for TG and DSC measurements. Shun Okano is gratefully mentioned for carrying out the respective Ellipsometry measurements. The publication costs of this article was funded by the German Research Foundation/DFG and the Technische Universität Chemnitz in the funding programme Open Access publishing.References
- L. Wang, Y. Yang, J. Ni, C. L. Stern and T. J. Marks, Chem. Mater., 2005, 17, 5697–5704 CrossRef.
- A. Kawakami, Y. Uzawa and Z. Wang, Appl. Phys. Lett., 2003, 83, 3954–3956 CrossRef.
- A. Sartori, N. El Habra, M. Bolzan, G. Rossetto, S. Sitran, D. Barreca, A. Gasparotto and M. Casarin, Chem. Mater., 2011, 23, 1113–1119 CrossRef.
- J. Meunier, P. Belenguer and J. P. Boeuf, J. Appl. Phys., 2011, 731, 731–745 Search PubMed.
- H. Tang, H. Chen, J. Huang and C. Lin, Macromolecules, 2007, 2, 8855–8860 CrossRef.
- B. Roy, A. S. Roy, A. B. Panda, S. M. Islam and A. P. Chattopadhay, ChemistySelect., 2016, 1, 4778–4784 CrossRef.
- S. Yang, P. Huang, L. Peng, C. Cao, Y. Zhu, F. Wei, Y. Sun and W. Song, J. Mater. Chem. A, 2016, 4, 400–406 Search PubMed.
- F. Li, H. Li, L. Wang, P. He and Y. Cao, Catal. Sci. Technol., 2015, 5, 1021–1034 Search PubMed.
- W. B. Wang, Y. Yang, A. Yanguas-Gil, N. N. Chang, G. S. Girolami and J. R. Abelson, Appl. Phys. Lett., 2013, 102, 101605 CrossRef.
- S. D. Ponja, I. P. Parkin and C. J. Carmalt, Chem. Vap. Depos., 2015, 21, 145–149 CrossRef.
- S. Vangelista, R. Mantovan, A. Lamperti, G. Tallarida, B. Kutrzeba-Kotowska, S. Spiga and M. F. Anciulli, J. Phys. D: Appl. Phys., 2013, 46, 485304 CrossRef.
- X. Fu and Z. Song, J. Sol-Gel Sci. Technol., 1999, 16, 277–281 CrossRef.
- L. Pei, W. Yin, J. Wang, J. Chen, C. Fan and Q. Zhang, Mater. Res., 2010, 13, 339–343 CrossRef.
- M. D. Losego, E. A. Paisley, H. S. Craft, P. G. Lam, E. Sachset, S. Mita, R. Collazo, Z. Sitar and J. P. Maria, J. Mater. Res., 2015, 31, 36–45 CrossRef.
- M. S. Mahmoud, S. H. Liao, T. Yabe, C. Raasandash, Y. Sato, C. Fukushima, M. Ichikawa, M. Nakatsuka, S. Uchida and T. Ohkubo, J. Appl. Phys., 2011, 109, 013103 CrossRef.
- Y. Li, G. Xiong, G. Lian, J. Li and Z. Gan, Thin Solid Films, 1993, 223, 11–13 CrossRef.
- A. Masuda and K. Nashimoto, J. Appl. Phys., 1994, 33, 793–796 Search PubMed.
- L. Dirnberger, P. E. Dyer, S. Farrar and K. P. Monk, Appl. Surf. Sci., 1993, 69, 216–220 CrossRef.
- B. B. Burton, D. N. Goldstein and S. M. George, J. Phys. Chem. C, 2009, 113, 1939–1946 Search PubMed.
- S. Yamada, Y. Nishibe and M. Saizaki, Jpn. J. Appl. Phys., 2002, 41, 6119–6921 CrossRef.
- G. Carta, N. El Habra, L. Crociani, G. Rossetto, P. Zanella, A. Zanella, G. Paolucci, D. Barreca and E. Tondello, Chem. Vap. Depos., 2007, 13, 185–189 CrossRef.
- J. H. Boo, S. B. Lee, K. S. Yu, W. Koh, Y. Kim and Y. Kim, Thin Solid Films, 1999, 341, 63–67 CrossRef.
- T. Hatanpää, J. Ihanus, J. Kansikas, I. Mutikainen, M. Ritala and M. Leskelä, Chem. Mater., 1999, 11, 1846–1852 CrossRef.
- B. J. R. Babcock, D. D. Benson, A. Wang, N. L. Edleman, J. A. Belot, M. V. Metz and T. J. Marks, Chem. Vap. Depos., 2000, 6, 180–183 CrossRef.
- T. Maruyama and J. Shionoya, Jpn. J. Appl. Phys., 1990, 29, 810–811 CrossRef.
- M. M. Sung, C. G. Kim, J. Kim and Y. Kim, Chem. Mater., 2002, 14, 826–831 CrossRef.
- M. R. Hill, A. W. Jones, J. J. Russell, N. K. Roberts and R. N. Lamb, J. Mater. Chem., 2004, 14, 3198–3202 RSC.
- B. J. S. Matthews, O. Just, B. Obi-Johnson and W. S. Rees, Chem. Vap. Depos., 2000, 6, 129–132 CrossRef.
- A. Tuchscherer, C. Georgi, N. Roth, D. Schaarschmidt, T. Rüffer, T. Waechtler, S. E. Schulz, S. Oswald, T. Gessner and H. Lang, Eur. J. Inorg. Chem., 2012, 4867–4876 CrossRef.
- J. H. Scofield, J. Electron Spectrosc. Relat. Phenom., 1976, 8, 129–137 CrossRef.
- D. H. Lee, S. E. Park, K. Cho, Y. Kim, T. Athara and I. M. Lee, Tetrahedron Lett., 2007, 48, 8281–8284 CrossRef.
- S. Basak, S. Sen, S. Mitra, C. Marschner and W. S. Sheldrick, Struct. Chem., 2008, 19, 115–121 CrossRef.
- G. M. Sheldrick, A short history of SHELX. International Union of Crystallography, 2008, pp. 112–122 Search PubMed.
- B. Podkościelna and M. Sobiensiak, J. Therm. Anal. Calorim., 2017, 127, 625–631 CrossRef.
- A. M. Ezhil Raj, L. C. Nehru, M. Jayachandran and C. Sanjeeviraja, Cryst. Res. Technol., 2007, 42, 867–875 CrossRef.
- M. Puszyńska-Tuszkanow, W. Zierkiewic, T. Grabowski, M. Daszkiewicz, G. Maciejewska, A. Adach, K. Kucharska-Ziembicka, J. Wietrzyk, B. Filip-Psurska and M. Cieślak-Golonka, J. Mol. Struct., 2017, 1134, 199–207 CrossRef.
- C. Georgi, A. Hildebrandt, A. Tuchscherer, S. Oswald and H. Lang, Z. Anorg. Allg. Chem., 2013, 639, 2532–2535 CrossRef.
- T. Hatanpää, J. Kansikas, I. Mutikainen and M. Leskelä, Inorg. Chem., 2001, 40, 788–794 CrossRef.
- E. S. Vikulova, K. V. Zherikova, I. V. Korolkov, L. N. Zelenina, T. P. Chusova, S. V. Sysoev, N. I. Alferova, N. B. Morozova and I. K. Igumenov, J. Therm. Anal. Calorim., 2014, 118, 849–856 CrossRef.
- S. Ardizzone, C. L. Bianchi, M. Fadoni and B. Vercelli, Appl. Surf. Sci., 1997, 119, 253–259 CrossRef.
- S. C. Jason, J.-W. He and D. W. Goodman, Surf. Sci., 1994, 306, 269–278 CrossRef.
- A. Shoji, M. Aoyagi, S. Kosaka, F. Shinoki and H. Hayakawa, Appl. Phys. Lett., 1985, 46, 1098 CrossRef.
- J. Guo, S. Ren, X. Kang, W. Chen and X. Zhao, Appl. Phys. Lett., 2017, 111, 192402 CrossRef.
- J. P. Singh and K. H. Chae, Condens. Matter, 2017, 2, 36 CrossRef.
- H. Wu, A. Stroppa, S. Sakong, S. Picozzi, M. Scheffler and P. Kratyer, Phys. Rev. Lett., 2010, 105, 267203 CrossRef PubMed.
- S. K. Mahdadeva, J. Fan, A. Biswas, K. S. Sreelatha, L. Belova and K. V. Rao, Nanomaterial, 2013, 3, 486–497 CrossRef PubMed.
- A. M. E. Raj, M. Jayachandran and C. Sanjeeviraja, CIRP J. Manuf. Sci. Technol., 2010, 2, 92–113 CrossRef.
- M. R. Hill, A. W. Jones, J. J. Russell, N. K. Robert and R. N. Lamb, J. Mater. Chem., 2004, 14, 3198–3202 RSC.
- J.-H. Boo, S.-B. Lee, K.-S. Yu, W. Koh and Y. Kim, Thin Solid Films, 1999, 341, 63–67 CrossRef.
- W. B. Wang, Y. Yang, A. Yanguas-Gil, N. N. Chang, G. S. Girolami and J. R. Abelson, Appl. Phys. Lett., 2013, 102, 101605 CrossRef.
Footnote |
| † Electronic supplementary information (ESI) available: CCDC 1569233. For ESI and crystallographic data in CIF or other electronic format see DOI: 10.1039/c8ra01851k |
| This journal is © The Royal Society of Chemistry 2018 |

