 Open Access Article
Aryl fluoride functionalized graphene oxides for excellent room temperature ammonia sensitivity/selectivity†
Farheen Khurshida,
M. Jeyavelanb,
Keisuke Takahashi c,
M. Sterlin Leo Hudson
 *b and
S. Nagarajan
 *a
*a
aDepartment of Chemistry, Central University of Tamil Nadu, Thiruvarur – 610005, India. E-mail: snagarajan@cutn.ac.in; Tel: +91-9489051816
bDepartment of Physics, Central University of Tamil Nadu, Thiruvarur – 610005, India. E-mail: msterlinleo@cutn.ac.in; Tel: +91-9486860214
cCenter for Materials Research By Information Integration (CMI2), National Institute for Materials Science (NIMS), 1-2-1 Sengen, Tsukuba, Ibaraki 305-0047, Japan
First published on 5th June 2018
Abstract
Herein, we report the covalent functionalization of graphene oxide (GO) through ‘‘click’’ reaction and its applications towards ammonia sensing. This inimitable method of covalent functionalization involves linking GO with azide moiety and click coupling of different derivatives of aryl propargyl ether, which enhances the sensitivity towards ammonia. The functionalized GO were characterized using NMR, XRD, SEM, FT-IR, Raman, UV-Vis, TGA and DSC. Compared to pristine GO, the GO functionalized with Ar samples (GO-Ar) exhibit excellent room temperature ammonia sensing properties with good response/recovery characteristics. It has been observed that 2,3-difluoro and 2,3,4-trifluoro substituted aryl propargyl ether functionalized GO (GO-Ar2 and GO-Ar3) shows superior ammonia sensing with response/recovery of 63%/∼90% and 60%/100%, respectively at 20 ppm. The GO-Ar3 exhibits high sensitivity towards ammonia at 20–100 ppm. Computational studies supports the high sensitivity of GO-Ar towards ammonia due to its high adsorption energy.
1. Introduction
Materials suitable for gas detection have recently gained popularity due to their potential application towards detection of toxic and flammable gases such as H2, CH4, CO, NOx, and NH3. Gas sensors are widely used in many commercial and industrial applications such as exhaust gas detection as well as flammable and explosive gas detection.1 Among all toxic gases, ammonia (NH3), a colourless and highly toxic gas, draws particular interest. While blood ammonium concentration is normally < 50 μmol L−1, an increase to nearly 200 μmol L−1 can lead towards convulsions or a comatose state. Exposure of > 55 ppm concentration of ammonia in air for 48 hours can also cause respiratory and cardiovascular diseases.2–4 Hence, the development and optimization of low concentration NH3 sensing material is very important. Graphene is found to be a promising material for gas sensing applications because of its large surface area (2630 m2 g−1 theoretical).5 The 2D crystalline honeycomb framework of carbon atoms on a graphene surface can provide a large sensing area per unit volume to adsorbed gas molecules.6 The electrostatic interaction between graphene and adsorbates could vary from weak van der Waals interaction to strong covalent interaction. These interactions may lead towards a change in the electronic system of graphene.7 Gas sensing properties of graphene and sensitivity of graphene has been investigated by several researchers.8 However, the chemical inertness of a pure graphene surface reduces its ammonia sensing performance. Graphene-based sensors for detecting low concentration ammonia gas become a prime area of sensor research.9–11 It has been observed that graphene functionalized with high electronegative elements such as fluorine or boron enhances its sensitivity towards ammonia gas.12 Katkov et al. reported that experimental observations of about 10.2% increase in ammonia sensitivity (at 10![[thin space (1/6-em)]](https://www.rsc.org/images/entities/char_2009.gif) 000 ppm) of graphene after functionalization with fluorine.13 Additionally, Ruitao Lv et al.14 found that upon boron doping, the sensitivity of graphene towards ammonia has increased nearly 100 times.13 Nowadays, due to limitations of large-scale synthesis of single layer graphene, significant research is focused on oxides of graphite for detection of gases such as ammonia, NO2, humidity, and air flow.12,15–20 In graphite oxide (GO), the sp2 hybridized carbon surface of graphite get modified by oxygen functional groups like carboxylic, epoxy, and ether groups. Hence, the GO surface becomes a sp3 hybridized surface, resulting in more active sites for gaseous species (adsorbates).21 Furthermore, the high concentration of oxygen-containing functional groups in GO22 offers a high degree of selectivity for the detection of toxic gases at room temperature.23 Bannov et al. observed that GO based sensors have an ammonia sensitivity of 7.4% (at 500 ppm) at room temperature.23 Wu et al. observed graphene oxide/polyaniline nanocomposite has an ammonia sensitivity of 11.33% (at 100 ppm) ammonia sensitivity.24 Reports suggested that an enhancement in selectivity and sensitivity response of graphene towards ammonia gas detection when it is functionalized/decorated with conducting polymer,25 metal oxides,26 and fluorine substitution27 via covalent and non-covalent functionalization. Many commercial ammonia gas sensors have high sensitivity at high temperature and poor sensitivity at low temperature. More recently, research is being focused on developing gas sensors with high sensitivity at low temperature and near room temperature. Therefore, the functionalization of GO with terminal azide moiety and different derivatives of aryl propargyl ether through Cu-catalyzed Huisgen 1,3-dipolar cycloaddition (click reaction) is investigated. The electron withdrawing group functionalized aryl propargyl ethers are chosen to understand its gas role on the GO surface.
000 ppm) of graphene after functionalization with fluorine.13 Additionally, Ruitao Lv et al.14 found that upon boron doping, the sensitivity of graphene towards ammonia has increased nearly 100 times.13 Nowadays, due to limitations of large-scale synthesis of single layer graphene, significant research is focused on oxides of graphite for detection of gases such as ammonia, NO2, humidity, and air flow.12,15–20 In graphite oxide (GO), the sp2 hybridized carbon surface of graphite get modified by oxygen functional groups like carboxylic, epoxy, and ether groups. Hence, the GO surface becomes a sp3 hybridized surface, resulting in more active sites for gaseous species (adsorbates).21 Furthermore, the high concentration of oxygen-containing functional groups in GO22 offers a high degree of selectivity for the detection of toxic gases at room temperature.23 Bannov et al. observed that GO based sensors have an ammonia sensitivity of 7.4% (at 500 ppm) at room temperature.23 Wu et al. observed graphene oxide/polyaniline nanocomposite has an ammonia sensitivity of 11.33% (at 100 ppm) ammonia sensitivity.24 Reports suggested that an enhancement in selectivity and sensitivity response of graphene towards ammonia gas detection when it is functionalized/decorated with conducting polymer,25 metal oxides,26 and fluorine substitution27 via covalent and non-covalent functionalization. Many commercial ammonia gas sensors have high sensitivity at high temperature and poor sensitivity at low temperature. More recently, research is being focused on developing gas sensors with high sensitivity at low temperature and near room temperature. Therefore, the functionalization of GO with terminal azide moiety and different derivatives of aryl propargyl ether through Cu-catalyzed Huisgen 1,3-dipolar cycloaddition (click reaction) is investigated. The electron withdrawing group functionalized aryl propargyl ethers are chosen to understand its gas role on the GO surface.
2. Experimental section
2.1 Materials
Graphite powder (300 mesh) N-(3-dimethylaminopropyl)-N′-ethylcarbodiimide hydrochloride (EDC HCl, 99%), propargyl bromide, chloropropylamine, sodium azide, CuBr and N-hydroxysuccinimide were purchased from Sigma Aldrich. N,N,N′,N′′,N′′-pentamethyldiethylenetriamine (PMDETA) was purchased from Alfa Aesar.2.2 Synthesis of graphene oxide (GO)
Graphene Oxide (GO) was synthesized by using modified Hummers method.28 About 5 g of graphite powder and 2.5 g of NaNO3 were mixed together with concentrated H2SO4 (108 ml) under constant stirring. Then 12 ml of H3PO4 was added to the 2![[thin space (1/6-em)]](https://www.rsc.org/images/entities/char_2009.gif) :
:![[thin space (1/6-em)]](https://www.rsc.org/images/entities/char_2009.gif) 1 graphite-NaNO3 mixture kept under ice cooled bath and continued stirring for 10 min. Afterwards, 15 g of KMnO4 was gradually added to the mixture with constant stirring. The suspension was continuously stirred for 2 hours under ice cold conditions and continued stirring at 40 °C for 1 hour. The reaction mixture was diluted with deionized water at 98 °C. The resultant final product was dried overnight at 60 °C and then subjected for characterization.
1 graphite-NaNO3 mixture kept under ice cooled bath and continued stirring for 10 min. Afterwards, 15 g of KMnO4 was gradually added to the mixture with constant stirring. The suspension was continuously stirred for 2 hours under ice cold conditions and continued stirring at 40 °C for 1 hour. The reaction mixture was diluted with deionized water at 98 °C. The resultant final product was dried overnight at 60 °C and then subjected for characterization.
2.3 Synthesis of azide functionalized GO
3-Azidoropan-1-amine (7.5 mmol) was condensed with GO (1 g) under catalytic action of EDC (2.5 mmol) and NHS (2.2 mmol). The reaction mixture was stirred at room temperature for 24 hours, and upon completion the reaction mixture was centrifuged at 1000 rpm for 5 min. The suspension was collected and washed several times with deionized water to get GO-N3.2.4 Click reaction of GO-N3 to aryl propargyl ether
The functionalization of GO with different derivatives of aryl propargyl ether was done by click reaction.29 Aryl propargyl ether (0.1 ml) was added to a round bottom flask containing GO-N3 (0.016 ml, 50 mg ml−1 of water). Then DMF (1 ml), CuBr (0.973 mmol), and PMDETA (0.293 μl) were added to the flask under nitrogen atmosphere and stirred for 3 hours at 60 °C. The reaction product was centrifuged at 500 rpm for 10 min. The residue was washed five times with DMF, and dried overnight under vacuum at 60 °C. The samples were collected and stored in vacuum desiccator. The evidence for the functionalization of Ar moiety on terminal azide GO (GO-N3) discussed in the ESI (Fig. S5†).2.5 Scheme for the synthesis of sensing molecules
As from Fig. 1 (scheme), the derivatives aryl propargyl ether were synthesized by a reaction between propargyl bromide and respective phenols (2,4,6-trimethyl (Ar1), 2,3-difluro (Ar2) and 2,3,4-trifluro (Ar3)) in the presence of K2CO3 as reported earlier.33 The functionalized GO (GO-Ar) samples were prepared by a Husigen's 1,3-dipolar cycloaddition reaction between aryl propargyl ether and azido-terminated GO (GO-N3) utilizing CuBr as catalyst. After 5 minutes, 15 ml of H2O2 was added into the suspension. The reaction product was filtered with G4 sintered crucible and repeatedly washed with deionized water and 5% HCl solution.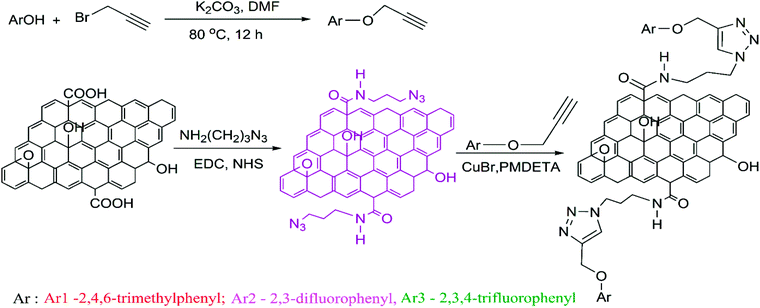 | ||
| Fig. 1 Scheme: synthesis of aryl propargyl ethers and functionalization of GO-N3 with derivatives of aryl propargyl ethers through click reaction. | ||
2.6 Structural, microstructural, thermal and spectral analysis
13C and 1H NMR spectra were recorded using a Bruker 400 MHz spectrophotometer. Chemical shift values (δ) are reported in ppm and calibrated with the residual solvent peak CDCl3 δ = 7.2600 ppm for 1H, δ = 77.16 for 13C and tetramethylsilane (δ = 0.00). The structural analysis of samples was carried out using a powder X-ray diffractometer (PANalytical X'Pert PRO) equipped with X'Celerator position sensitive detector using Cu Kα radiation of wavelength λ = 1.5401 Å. Microstructure analysis of the samples were characterized by using JEOL scanning electron microscope (SEM). Fourier transform infrared (FT-IR) spectra and Raman spectra were obtained using Agilent-Cary 630 and EZRaman-N-785 spectrometer, respectively. Differential scanning calorimetry (DSC) and thermogravimetric analysis (TGA) of the samples were recorded between 40 °C and 400 °C at the dynamical heating rate of 10 °C min−1 under constant nitrogen flow (20 ml min−1) using a PerkinElmer STA 8000. The BET surface area of the samples were calculated by using Autosorb iQ under nitrogen atmosphere at 77 K.2.7 Sensing device fabrication and measurements
The sensor electrode was fabricated by a gold film coating using thermal evaporation technique on a patterned glass substrate. The gold coated electrode was with a dimension of 12 mm (L) × 8 mm (W) × 200 nm (t) with 1 mm strips spacing. The GO based sensing film was prepared from 50 mg sample dispersed in 2 ml of ethanol and deposited on the gold coated electrode by using drop-casting method. Afterwards, the sensor was dried at 45 °C for 1 hour. The sensing measurements were carried out using BioLogic VSP-300 Impedance analyzer at an input supply of 1 V (f = 1 kHz). The ammonia solutions of varying volumes (corresponding to the vapour concentrations ranging from 20 ppm to 100 ppm) were dropped using a micropipette into a sealed glass chamber of volume 1.77 litre. Fig. 2(a, b and c) represents the schematic NH3 sensing setup, used for monitoring the sensor response by switching between NH3 atmosphere and ambient air. The sensing measurements were continuously recorded by varying the NH3 concentrations from 20 ppm to 100 ppm at an interval of 5 min ON/OFF duration. The concentration of injected analyte (NH3) in the chamber was calculated in ppm according to the following equation:30,31
 | (1) |
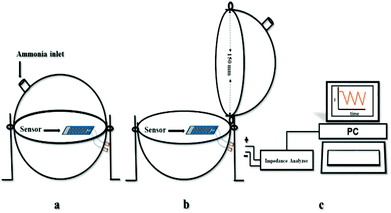 | ||
| Fig. 2 Schematic gas sensing setup: (a) sensor inside a sealed chamber under ammonia atmosphere, (b) sensor in ambient air, and (c) impedance measurement system. | ||
3. Results and discussion
3.1 Structural, microstructural, thermal and surface area analysis
Spectral studies confirmed the formation of the functionalized GO described in the Scheme shown in Fig. 1. The detailed NMR structural analysis of aryl propargyl ethers (Ar1, Ar2 and Ar3) are given in ESI (Fig. S1(a) to S3(b)†). The Fig. 3(a) displays the XRD pattern of GO and functionalized GO. The strong diffraction peak of GO observed at 2θ = 11.5° corresponding to (001) plane having d-spacing of 0.75 nm confirms the oxidation of graphite.28 After the functionalization of GO with azide moiety (N3), the diffraction peak of GO has shifted to low diffraction angle at 2θ = 9.5° corresponding to d-spacing of 0.92 nm. The attachment of azide moiety (N3) on GO surface leads to an increased d-spacing of GO-N3.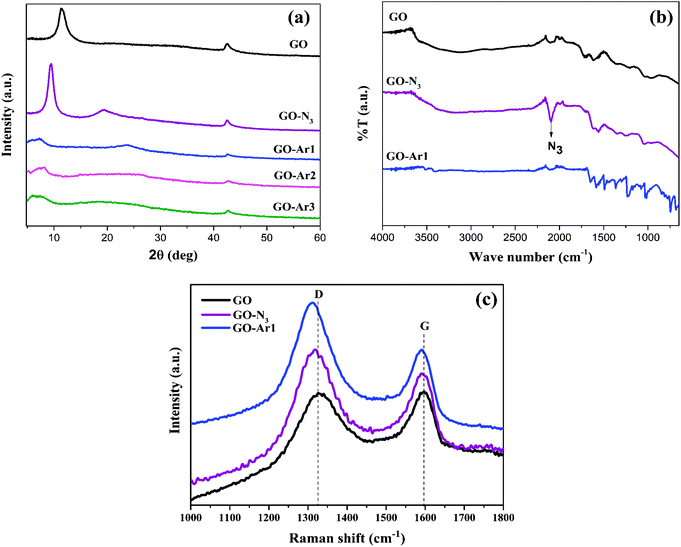 | ||
| Fig. 3 (a) XRD Spectra of GO and Functionalized GO, (b) and (c) FT-IR and Raman spectra of GO, GO-N3 and GO-Ar1. | ||
Whereas, an additional diffraction peak observed at 2θ = 19.4° for GO-N3 might be due to the partial reduction of GO during the reaction process.29 In addition, after functionalization of GO-N3 with Ar1, Ar2 and Ar3, it was observed that (001) peak becomes broader and further shifted towards lower angle than GO-N3 corresponding to the d-spacing's of 2.43 nm, 2.20 nm and 2.55 nm, respectively. Whereas the partial reduction peaks are observed in GO-Ar1, GO-Ar2 and GO-Ar3 at 23.4°, 24.5° and 20.2°. This suggest that the functionalization causes vacancies in GO.34 These vacancies also act as an active site for the ammonia adsorption.
Fig. 3(b) portrays FT-IR spectra of GO, GO-N3 and GO-Ar1 and the peaks found in GO at 1104, 1720, and 3282 cm−1 corresponding to epoxy, carboxylic (COOH), and hydroxyl (OH) groups, respectively confirms the oxygen functionalities on GO surfaces.29 whereas, in GO-N3 a sharp absorption peak has been observed at 2106 cm−1, assigned to azide moiety (N3). This result suggests the successful condensation reaction between GO and azide moiety.35 Unlike GO and GO-N3, the GO-Ar shows several additional spectral peaks at 1044 cm−1 (C–N), 1142 cm−1 (ester linkage), 1578 cm−1 (C![[double bond, length as m-dash]](https://www.rsc.org/images/entities/char_e001.gif) N), 1640 cm−1 (N–H), and 1680 cm−1 (C
N), 1640 cm−1 (N–H), and 1680 cm−1 (C![[double bond, length as m-dash]](https://www.rsc.org/images/entities/char_e001.gif) O), corresponding to coupling of aryl propargyl ether with terminal azide moiety on GO were observed. The Raman spectral analysis was carried out to understand the interaction between GO and N3/Ar moieties. The representative Raman spectra of GO, GO-N3 and GO-Ar1 are shown in Fig. 3(c). It has been observed two prominent peaks; the G band spectrum observed at 1594 cm−1, corresponding to the doubly degenerate zone-center E2g mode and a broad D band spectrum at 1330 cm−1 due to the formation of sp3 hybridized carbon bonds during the oxidation of GO.34 The intensity ratio of D and G bands (ID/IG) of Raman spectra is generally used to characterize the level of defect density in graphene.36 From Fig. 3(c), it has been observed that the ratio of ID/IG increases from GO (0.995) > GO-N3 (1.102)>GO-Ar2 (1.376), which reveals the increased defect density in graphene due to the functionalization of N3 and Ar moieties at the edges of GO.
O), corresponding to coupling of aryl propargyl ether with terminal azide moiety on GO were observed. The Raman spectral analysis was carried out to understand the interaction between GO and N3/Ar moieties. The representative Raman spectra of GO, GO-N3 and GO-Ar1 are shown in Fig. 3(c). It has been observed two prominent peaks; the G band spectrum observed at 1594 cm−1, corresponding to the doubly degenerate zone-center E2g mode and a broad D band spectrum at 1330 cm−1 due to the formation of sp3 hybridized carbon bonds during the oxidation of GO.34 The intensity ratio of D and G bands (ID/IG) of Raman spectra is generally used to characterize the level of defect density in graphene.36 From Fig. 3(c), it has been observed that the ratio of ID/IG increases from GO (0.995) > GO-N3 (1.102)>GO-Ar2 (1.376), which reveals the increased defect density in graphene due to the functionalization of N3 and Ar moieties at the edges of GO.
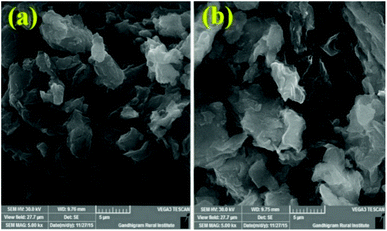
The Fig. 4 displays, the morphologies of pristine GO-Ar1 and GO-Ar3. The SEM images shows the surface texture of the samples. A similar morphologies were observed for Ar1 functionalized GO and Ar3 functionalized GO.
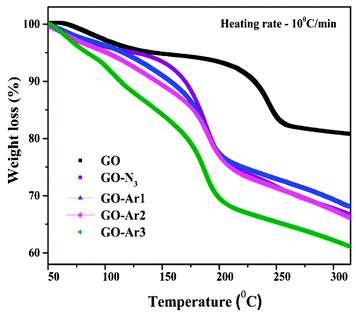
Fig. 5 displays the TGA curves of GO, GO-N3 and GO-Ar samples. The thermal decomposition measurements were done between 40 °C to 400 °C under dynamic heating rate of 10 °C min−1 it has been observed from the TGA curve of GO, a major weight loss (∼12%) occurred between 100 °C to 250 °C indicates the removal of volatiles and pyrolysis of oxygen-related functional groups on GO surfaces.37,38 In GO the overall weight loss of∼20% has been observed from 50 to 250 °C due to the decomposition of oxygen and other functional groups. Whereas the major decomposition temperature of GO (220 °C) has shifted towards low temperature for all functionalized GO samples due to the substitution of N3, Ar1, Ar2 and Ar3. In addition to that, the Azide and the aryl propargyl ether functionalized GO samples exhibit higher weight losses (28, 27, 29 and 35%)from 50 to 250 °C than GO, due to the decomposition of higher molecular weight aryl propargyl ether derivatives. It has been observed that, the functionalized GO samples have lower decomposition temperatures (∼179, 171, 167 and 160 °C) than pristine GO (235 °C).
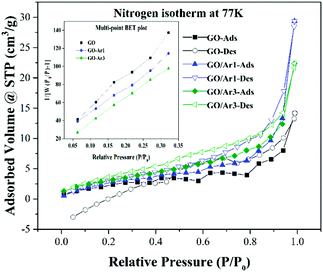
The BET surface area of the samples was analysed from N2 adsorption/desorption isotherm at 77 K as shown in Fig. 6 and the corresponding isotherms and multipoint BET plot (insert graph in Fig. 6) reveals that the GO, GO-Ar2 and GO-Ar3 samples have surface area of 9.34, 11.445 and 12.245 m2 g−1 respectively. As inferred from BET measurement the GO samples has very low surface area. However, it slightly increases when increasing the order of functionalization at edges of GO. It has been observed from that, the isotherm of all the samples resemble with the type IV (IUPAC) isotherm and it signifies that the materials are mesoporous in nature.
3.2 Ammonia sensing analysis
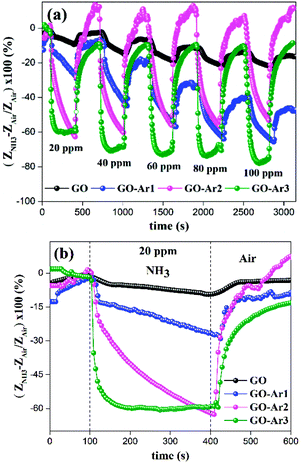
The ammonia (NH3) gas sensing characteristics of pristine GO and functionalized GO, corresponding to the NH3 concentration of 20 to 100 ppm are shown in Fig. 7(a). The percentage response (% S) and percentage recovery (% Rec) was calculated using the following equations,32,39
 | (2) |
 | (3) |
As from Fig. 7(a) and (b), the sensitivity or response arises due to the interaction between NH3 and GO based sensor surface (GO and GO-Ar) via physisorption as well as chemisorption. Due to the electrostatic exchange of negative charge carriers from NH3 to the GO sensor surface, the charge carrier density of the sensor has greatly increased, leading to its decrement in electrical impedance (Z).39,42,43 During electrostatic exchange of charge carriers, NH3 acts as electron donor (due to its p-type nature)41 and functional groups (Ar moieties and oxygen containing groups) on sensor surface acts as electron acceptor. Therefore, we have observed the sensitivity of all sensors in the negative axis. Generally, the surface of GO contains epoxy, hydroxyl and other oxygen containing groups in the intermediate region between O-rich and H-rich surface.40 So that, the molecular interaction of NH3 with GO could be occurred through covalent or non-covalent bonding. For example, the hydrogen bonding between ammonia and hydroxyl groups in GO occurred by the coordination of N in NH3 and H in hydroxyl group (OH⋯N). Whereas, the hydrogen bonding between ammonia and epoxide groups in GO occurred by the coordination between H in NH3 and O in epoxide group (NH⋯O). Since, due to its various interactions between ammonia and oxygen containing functional groups on GO, we have observed 9.5% response under 20 ppm ammonia gas concentration for pristine GO. The sensitivity of pristine GO has increased when the ammonia concentration was increased from 20 to 100 ppm.
In order to improve the ammonia sensing properties of GO, it has been functionalized with different derivatives of aryl propargyl ethers (Ar1, Ar2 and Ar3) as shown in Fig. 1. When compared to pristine GO, all functionalized GO sensors exhibited superior ammonia responses and the representative ammonia response curves are shown in Fig. 7(a) and (b). The observed sensitivity are of 28.2% for GO-Ar1, 63% for GO-Ar2 and 60% for GO-Ar3 under 20 ppm. The enhanced sensitivity of GO-Ar1 is 3 times higher than the pristine GO, whereas the sensitivity of GO-Ar2 and GO-Ar3 are approximately 6.5 times higher than that of pristine GO. The possible reasons for the enhancement in the sensitivity of functionalized GO are primarily due to the presence of more active sites for adsorption of NH3 molecules on the surface (methyl in Ar1, fluorine in Ar2, Ar3 and oxygen containing groups on GO) and electrostatic interaction with surface functionalities through the functionalization of aryl propargyl ether moieties on GO. Additionally, the vacancies which are produced in hexagonal carbon structure due to the oxidation and further functionalization can also enhances the ammonia adsorption.44 In order to verify and support the experimental results, the computational studies were performed on GO and functionalized GO to analyse the interaction between ammonia and GO based sensing material. From the computation results, the calculated adsorption energies of GO, GO-Ar1, GO-Ar2 and GO-Ar3 are −1.74, −2.14, −2.89, −2.63 eV respectively, it reveals that the functionalization of aryl propargyl ether on GO leads to the high adsorption of ammonia gas molecules. When compared to the recovery of pristine GO (72%), all functionalized GO sensors exhibit high percentage recoveries (74% for GO-Ar1, 100% for GO-Ar2 and 91% for GO-Ar3) at room temperature. The summarized results are given in Table 1, it was observed that the functionalized GO sensor displays swift response and recovery than that of pristine GO.
| Sensing material | Response time at 20 ppm (s) | Recovery time at 20 ppm (s) | Max. % response at 20 ppm | Max. % recovery at 20 ppm |
|---|---|---|---|---|
| GO | 314 | 287 | 9.5 | 72 |
| GO-Ar1 | 312 | 90 | 28.2 | 74 |
| GO-Ar2 | 305 | 220 | 63 | 100 |
| GO-Ar3 | 78 | 260 | 60 | 91 |
The high electronegative aryl propargyl ether functionalized GO sensors (GO-Ar2 and GO-Ar3) exhibits superior gas response and recovery than other GO functionalized sensing material due to the substitutions of fluorine atom, which has greatly enhanced the ammonia binding towards the surface GO-Ar2 and GO-Ar3. As observed from Fig. 7(a) and (b), the GO-Ar3 sensor exhibits sensitivity (60%) with swift response time of 78 seconds due to tri-fluorine substitution, where as a gradual increase in the sensitivity with longer response time (305 seconds) has been observed for GO-Ar2 due to di-fluorine substitution. It has been observed that the percentage recovery was reduced when increasing the fluorine substitution on GO-Ar, might be due to the strong chemisorption. The calculated response and recovery time of GO and functionalized GO are summarized in the Table 1.
Reports suggest that for metal oxide based gas sensors, due to strong chemisorption of gas species, external heating is required to overcome the activation barrier to achieve complete recovery.45,46 However, heating requires additional electrical circuits, which will increase the complexity of sensor device fabrication. However, in this work, we have observed a nearly complete recovery (more than 90%) in GO-Ar2 and GO-Ar3 sensor device, without any external heating. When compared to previous reported results (given in Table 2), the di-fluoro and tri-fluoro substituted aryl propargyl ether functionalized GO exhibits higher NH3 gas response and recovery at room temperature.
| Sensing material | NH3 conc. In ppm | % Response | Year | Reference |
|---|---|---|---|---|
| GO-Ar2 | 20 | 63 | 2017 | This work |
| GO-Ar3 | 20 | 60 | 2017 | This work |
| Pristine GO | 500 | 30 | 2017 | 22 |
| PANI/GO/PANI/ZnO | 100 | 38.3 | 2017 | 25 |
| SnO2/rGO | 300 | 4.73 | 2017 | 47 |
| BPB/R-GO | 25 | 5.5 | 2016 | 8 |
| F-doped graphene | 1000 | 10.2 | 2015 | 12 |
| rGOTA functionalized | 1310–6550 | 9.3–20.1 | 2014 | 38 |
| PANI/GO | 100 | 11.33 | 2013 | 23 |
| GO/PPy1 aerogel | 800 | 40 | 2011 | 24 |
3.3 Humidity analysis
To explore the effect of relative humidity (RH) on ammonia gas response of the pristine GO and functionalized GO (GO-Ar2 and GO-Ar3), the sensors were exposed to different relative humidity environments (different humidity levels were maintained inside the chamber by using saturated saline solutions). After achieving constant humidity inside the chamber, ammonia (20 ppm) was allowed to enter into the chamber and the response was determined under different humid conditions. Fig. 8(a–d) shows the representative ammonia response curve of pristine GO, GO-Ar1, GO-Ar2 and GO-Ar3 under different humidity levels such as 11%, 51% and 97%, respectively. It has been observed from Fig. 8(e) that, there is a significant enhancement in the ammonia response from 15 to 34% for pristine GO, 20 to 45% for GO-Ar1, 51 to 81% for GO-Ar2 and 58.2 to 77.6% for GO-Ar3 by increasing the humidity level from 11% to 97%. This can be attributed to the presence of Ar moieties and oxygen containing functional groups on the sensing surface, which forms a molecularly thin water layer on the surface. The thickness of surface water layer increases with increase in RH.48 The presence of water layer on the sensor surface can enhance the adsorption of ammonia gas molecule, as reported by Lechner et al.49 The following acid–base reaction of NH3 with H2O forms aqueous ammonia with protonated NH4+:| NH3 + H2O = NH4+ + OH− |
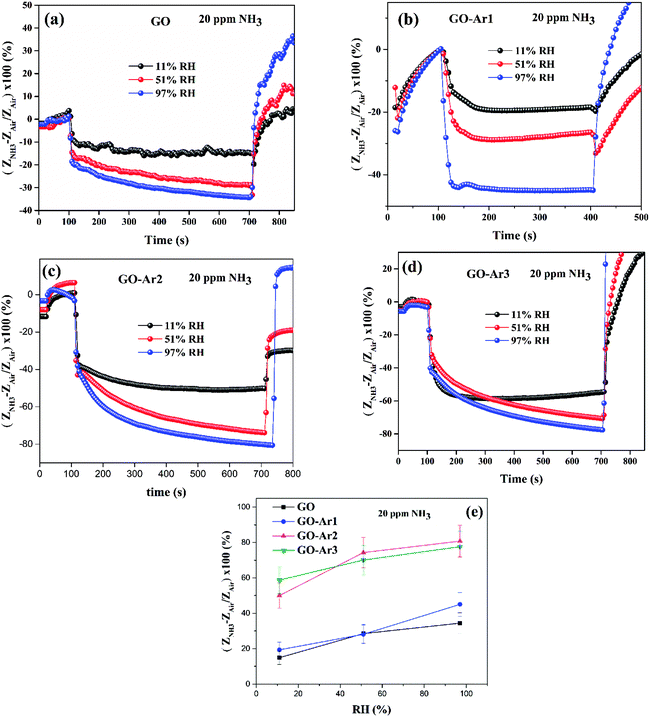 | ||
| Fig. 8 (a), (b) and (c) Ammonia gas sensing curves of GO, GO-Ar2 and GO-Ar3 under different humidity environments, (d) % sensitivity vs. % RH plot. | ||
Which leads to the electron transfer from hydrated ammonia to sensing material, thereby decreasing the impedance and hence increasing ammonia sensitivity.
The GO-Ar1 displays 1.28, 0.9,1.32 and GO-Ar2 shows 3.4, 2.64, 2.38 times higher NH3 response than pristine GO under the RH conditions of 11%, 51% and 97%, respectively. Whereas, GO-Ar3 exhibits 3.88, 2.5 and 2.28 times higher NH3 response than pristine GO under the RH conditions of 11%, 51% and 97%, respectively. This enhanced ammonia response of GO-Ar2 and GO-Ar3 attributed to the high interaction potential towards ammonia (due to the functionalization of fluorine substituted aryl propargyl ether) and more hydrophilic nature (due to surface fluorine atoms) than GO.
3.4 Gas selectivity analysis
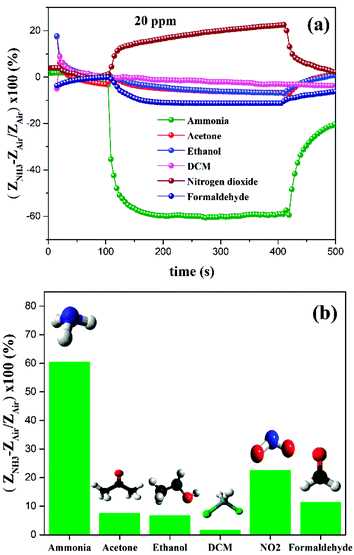
We have carried out the gas sensitivity measurement of GO-Ar3 under different gas environments (20 ppm) such as ammonia, acetone, ethanol and dichloromethane (DCM), nitrogen dioxide, formaldehyde respectively. The corresponding sensitivity curves of GO-Ar3 under different gas environments are shown in Fig. 9(a) and (b). It has been observed that among all the investigated gasses, GO-Ar3 shows significantly higher response towards ammonia. The sensitivity of GO-Ar3 determined under 20 ppm of ammonia, acetone, ethanol, DCM, nitrogen dioxide and formaldehyde are 60%, 7.4%, 6.7%, 1.54%, 22.5%, 11.2% respectively. Hence, the functionalization of GO with Ar3 makes superior selectivity towards ammonia sensing application.4. Computation
4.1 Computational methods
Density functional theory calculation via grid-based projector augmented wave (GPAW) method is implemented.50 Exchange correlation of the Perdew–Burke–Ernzerhof (PBE) exchange correlation with spin polarization are applied for all calculations.51 All calculations are carried out in Γ point where 15 Å of vacuum is applied in all direction.NH3 adsorption energy over functionalized graphene is calculated by the eqn (4):
| Eb = E[GO(Arx) + NH3] − E[GO(Arx)] − E[NH3]) | (4) |
Negative energy indicates exothermic reaction.
4.2 Computational results
NH3 adsorption over functionalized graphene oxides is performed within density functional theory. NH3 is adsorbed over GO, GO-Ar1, GO-Ar2, and GO-Ar3. The atomic model and adsorption energy of NH3 over Go, GO-Ar1, GO-Ar2, and GO-Ar3 are shown and collected in Fig. 10 and Table 3. Please note that H atom in GO-Ar2 is diffused from GO to C6F2 as shown in Fig. 10(c) upon the relaxation. NH3 is adsorbed at the edge of O atoms in GO while NH3 is adsorbed at C atom of functionalized C6 as shown in Fig. 10. Table 3 shows that the adsorption energy of NH3 over GO, GO-Ar1, GO-Ar2, and GO-Ar3 is calculated to be −1.71 eV, −2.14 eV, −2.89 eV, and −2.63 eV, respectively. One can see that NH3 adsorption energy is enhanced with functionalized graphene oxide (Ar1, Ar2, and Ar3) compared to NH3 over GO. In particular, high NH3 adsorption energy is observed with the addition of F atoms as seen in GO-Ar2 and GO-Ar3. This implies that F atoms are considered to be a key element for enhancing the sensitivity of GO against NH3.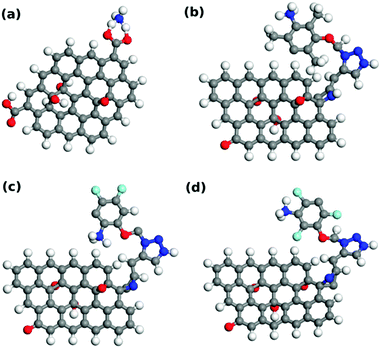 | ||
| Fig. 10 Atomic model of (a) GO, (b) GO-Ar1, (c) GO-Ar2, and (d) GO-Ar3. Atomic color code: C; gray, H; white, O; red, N; blue, F; light blue. | ||
| Samples | E (eV) |
|---|---|
| GO | −1.74 |
| GO-Ar1 | −2.14 |
| GO-Ar2 | −2.89 |
| GO-Ar3 | −2.63 |
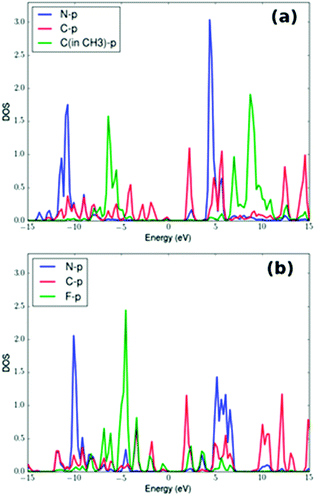
The electronic structure of NH3 over GO, GO-Ar1, GO-Ar2, and GO-Ar3 are investigated in order to reveal the enhancement of NH3 adsorption upon the introduction of F atoms. In particular, projected density of states (PDOS) of NH3 adsorbed over GO-Ar1 and GO-Ar3 are calculated and shown in Fig. 11. Fig. 11(a) shows that overlapping of p-electrons of C in CH3 and p-electrons of N is weak while strong overlapping is seen of p-electrons of F and p-electrons of N in Fig. 11(b). Thus, Fig. 11 demonstrates that the p-electrons of F atoms are contributing to the adsorption of NH3, therefore enhancement of NH3 adsorption energy is induced.
5. Conclusions
This work reports the successful functionalization of GO with terminal azide (N3) of GO and aryl propargyl ether derivatives (Ar1, Ar2 and Ar3) by using Cu-catalyzed Huisgen 1,3-dipolar cycloaddition reaction. The structural, microstructural, spectroscopic, thermal, and surface properties of the samples were investigated. Furthermore, we have analysed the ammonia sensitivity of aryl propargyl ether derivatives functionalized GO. Compared to pristine GO, aryl propargyl ether functionalized GO shows excellent NH3 sensitivity. The enhanced ammonia sensitivity of functionalized GO samples were supported through computational studies. Due to high adsorption energy (−2.89 eV and −2.63 eV), GO-Ar2 and GO-Ar3 exhibit a superior ammonia response of 63% and 60%, respectively, at 20 ppm which is approximately 6.4 times higher than that of pristine GO (−9.5%). Also nearly full sensor recovery (more than 90%) was achieved without any heat treatment. Additionally, the NH3 sensing response of GO-Ar2 and GO-Ar3 (at 20 ppm) was found to increase with the increase of relative humidity values ranging from 11% to 97%. Among the investigated different gases, GO-Ar3 shows high gas selectivity towards ammonia. Compared to pristine GO, these aryl propargyl ether functionalized graphene oxide materials can be useful for ammonia gas sensing applications.Conflicts of interest
Author has no conflicts of interest.Acknowledgements
The author Farheen Khurshid thankfully acknowledge UGC, New Delhi for MNAF research fellowship. MSLH is thankful to Department of Science and Technology, New Delhi for INSPIRE Faculty grant (IFA12-PH-18). The necessary experimental facilities provided by the Central University of Tamil Nadu (CUTN), Thiruvarur, and Karunya University, Coimbatore are gratefully acknowledged. This work is also funded by JSPS KAKENHI, Grant-in-Aid for Young Scientists (B), Grant Number JP17K14803 and “Materials research by Information Integration” Initiative (MI2I) project of the Support Program for Starting Up Innovation Hub from Japan Science and Technology Agency (JST) and Computational work is supported in part by Hokkaido university academic cloud information initiative centre, Hokkaido University, Sapporo, Japan.References
- D. Zhang, C. Jiang, P. Li and Y. e. Sun, ACS Appl. Mater. Interfaces, 2017, 9, 6462–6471 Search PubMed
.
- D. Ponnusamy and S. Madanagurusamy, J. Electron. Mater., 2015, 44, 4726 CrossRef
.
- Y. Jia, C. Yan, H. Yu, L. Chen and F. Dong, Sens. Actuators, B, 2014, 203, 459–464 CrossRef
.
- S. Abdulla, T. L. Mathew and B. Pullithadathil, Sens. Actuators, B, 2015, 221, 1523–1534 CrossRef
.
- C.-C. Cheng, C.-L. Wu, Y.-M. Liao and Y.-F. Chen, ACS Appl. Mater. Interfaces, 2016, 8, 17382–17388 Search PubMed
.
- M. Pumera, A. Ambrosi, A. Bonanni, E. L. K. Chng and H. L. Poh, TrAC, Trends Anal. Chem., 2010, 29, 954–965 CrossRef
.
- S. Tang and Z. Cao, J. Phys. Chem. C, 2012, 116, 8778–8791 Search PubMed
.
- H. Song, X. Li, P. Cui, S. Guo, W. Liu and X. Wang, Diamond Relat. Mater., 2017, 73, 56–61 CrossRef
.
- F. Schedin, A. Geim, S. Morozov, E. Hill, P. Blake, M. Katsnelson and K. Novoselov, Nat. Mat., 2007, 6, 652–655 CrossRef PubMed
.
- L. T. Duy, T. Q. Trung, V. Q. Dang, B. U. Hwang, S. Siddiqui, I. Y. Son, S. K. Yoon, D. J. Chung and N. E. Lee, Adv. Funct. Mater., 2016, 26, 4329–4338 CrossRef
.
- X. Huang, N. Hu, R. Gao, Y. Yu, Y. Wang, Z. Yang, E. S.-W. Kong, H. Wei and Y. Zhang, J. Mater. Chem., 2012, 22, 22488–22495 RSC
.
- S. Prezioso, F. Perrozzi, L. Giancaterini, C. Cantalini, E. Treossi, V. Palermo, M. Nardone, S. Santucci and L. Ottaviano, J. Phys. Chem. C, 2013, 117, 10683–10690 Search PubMed
.
- M. Katkov, V. Sysoev, A. Gusel'Nikov, I. Asanov, L. Bulusheva and A. Okotrub, Phys. Chem. Chem. Phys., 2015, 17, 444–450 RSC
.
- R. Lv, G. Chen, Q. Li, A. McCreary, A. Botello-Méndez, S. Morozov, L. Liang, X. Declerck, N. Perea-López and D. A. Cullen, Proc. Natl. Acad. Sci.,, 2015, 112, 14527–14532 CrossRef PubMed
.
- A. G. Bannov, J. Prášek, O. Jašek, A. A. Shibaev and L. Zajíčková, Procedia Eng., 2016, 168, 231–234 CrossRef
.
- S. K. Hazra and S. Basu, C, 2016, 2, 12 Search PubMed
.
- K. Toda, R. Furue and S. Hayami, Anal. Chim. Acta, 2015, 878, 43–53 CrossRef PubMed
.
- K. I. Han, S. Kim, I. G. Lee, J. P. Kim, J.-H. Kim, S. W. Hong, B. J. Cho and W. S. Hwang, Sensors, 2017, 17, 407 CrossRef PubMed
.
- N. L. Teradal, S. Marx, A. Morag and R. Jelinek, J. Mater. Chem. C, 2017, 5, 1128–1135 RSC
.
- Z. Xu, K. Wu, S. Zhang, Y. Meng, H. Li and L. Li, Mater. Horiz., 2017, 4, 383–388 RSC
.
- A. Pazat, E. Beyou, C. Barrès, F. Bruno and C. Janin, Appl. Surf. Sci., 2017, 396, 902–911 CrossRef
.
- W. S. Hummers Jr and R. E. Offeman, J. Am. Chem. Soc., 1958, 80, 1339 CrossRef
.
- A. G. Bannov, J. Prášek, O. Jašek and L. Zajíčková, Sensors, 2017, 17, 320 CrossRef PubMed
.
- Z. Wu, X. Chen, S. Zhu, Z. Zhou, Y. Yao, W. Quan and B. Liu, Sens. Actuators, B, 2013, 178, 485–493 CrossRef
.
- H. Bai, K. Sheng, P. Zhang, C. Li and G. Shi, J. Mater. Chem., 2011, 21, 18653–18658 RSC
.
- D. Zhang, Z. Wu, P. Li, X. Zong, G. Dong and Y. Zhang, Sens. Actuators, B, 2018, 258, 895–905 CrossRef
.
- D. Zhang, C. Jiang and Y. e. Sun, J. Alloys Compd., 2017, 698, 476–483 CrossRef
.
- M. Jeyavelan, A. Ramesh, R. R. Kannan, T. Sonia, K. Rugunandhiri and M. S. L. Hudson, RSC Adv., 2017, 7, 31272–31280 RSC
.
- L. Kou, H. He and C. Gao, Nano-Micro Lett., 2010, 2, 177–183 CrossRef
.
- D. Zhang, A. Liu, H. Chang and B. Xia, RSC Adv., 2015, 5, 3016–3022 RSC
.
- X. Wang, F. Cui, J. Lin, B. Ding, J. Yu and S. S. Al-Deyab, Sens. Actuators, B, 2012, 171, 658–665 CrossRef
.
- B. K. Mutuma, R. Rodrigues, K. Ranganathan, B. Matsoso, D. Wamwangi, I. A. Hümmelgen and N. J. Coville, J. Mater. Chem. A, 2017, 5, 2539–2549 Search PubMed
.
- D. Evrard, F. Lambert, C. Policar, V. Balland and B. Limoges, Chem. –Eur. J., 2008, 14, 9286–9291 CrossRef PubMed
.
- K. N. Kudin, B. Ozbas, H. C. Schniepp, R. K. Prud'Homme, I. A. Aksay and R. Car, Nano Lett., 2008, 8, 36–41 CrossRef PubMed
.
- D. Egloff, I. A. Oleinich, M. Zhao, S. L. König, R. K. Sigel and E. Freisinger, ACS Chem. Biol., 2016, 11, 2558–2567 CrossRef PubMed
.
- M. S. L. Hudson, K. Takahashi, A. Ramesh, S. Awasthi, A. K. Ghosh, P. Ravindran and O. N. Srivastava, Catal. Sci. Technol., 2016, 6, 261–268 Search PubMed
.
- T. Zhou, F. Chen, K. Liu, H. Deng, Q. Zhang, J. Feng and Q. Fu, Nanotechnology, 2010, 22, 045704 CrossRef PubMed
.
- Y. Chen, S. A. Freunberger, Z. Peng, F. Bardé and P. G. Bruce, J. Am. Chem. Soc., 2012, 134, 7952–7957 CrossRef PubMed
.
- Q. Lin, Y. Li and M. Yang, Sens. Actuators, B, 2012, 173, 139–147 CrossRef
.
- W. Cai, R. D. Piner, F. J. Stadermann, S. Park, M. A. Shaibat, Y. Ishii, D. Yang, A. Velamakanni, S. J. An and M. Stoller, Science, 2008, 321, 1815–1817 CrossRef PubMed
.
- H. Chang, J. D. Lee, S. M. Lee and Y. H. Lee, Appl. Phys. Lett., 2001, 79, 3863–3865 CrossRef
.
- B. Kumar, K. Min, M. Bashirzadeh, A. B. Farimani, M.-H. Bae, D. Estrada, Y. Kim, P. Yasaei, Y. Park and E. Pop, Nano Lett., 2013, 13, 1962–1968 CrossRef PubMed
.
- G. Lu, L. E. Ocola and J. Chen, Appl. Phys. Lett., 2009, 94, 083111 CrossRef
.
- R. Ghosh, A. Midya, S. Santra, S. K. Ray and P. K. Guha, ACS Appl. Mater. Interfaces, 2013, 5, 7599–7603 Search PubMed
.
- C. S. Rout, M. Hegde, A. Govindaraj and C. Rao, Nanotechnology, 2007, 18, 205504 CrossRef
.
- E. Llobet, G. Molas, P. Molinas, J. Calderer, X. Vilanova, J. Brezmes, J. Sueiras and X. Correig, J. Electrochem. Soc., 2000, 147, 776–779 CrossRef
.
- D. Zhang, J. Liu, C. Jiang, A. Liu and B. Xia, Sens. Actuators, B, 2017, 240, 55–65 CrossRef
.
- D. B. Asay and S. H. Kim, J. Phys. Chem. B, 2005, 109, 16760–16763 CrossRef PubMed
.
- B. A. Lechner, Y. Kim, P. J. Feibelman, G. Henkelman, H. Kang and M. Salmeron, J. Phys. Chem. C, 2015, 119, 23052–23058 Search PubMed
.
- J. J. Mortensen, L. B. Hansen and K. W. Jacobsen, Phys. Rev. B: Condens. Matter Mater. Phys., 2005, 71, 035109 CrossRef
.
- J. P. Perdew, K. Burke and M. Ernzerhof, Phys. Rev. Lett., 1996, 77, 3865 CrossRef PubMed
.
Footnote |
| † Electronic supplementary information (ESI) available. See DOI: 10.1039/c8ra01818a |
| This journal is © The Royal Society of Chemistry 2018 |

