 Open Access Article
A sensitive fluorescent probe for alkaline phosphatase and an activity assay based on the aggregation-induced emission effect†
Wenjuan Zhang,
Hanxiao Yang,
Nan Li and
Na Zhao
 *
*
Key Laboratory of Macromolecular Science of Shaanxi Province, Key Laboratory of Applied Surface and Colloid Chemistry of Ministry of Education, School of Chemistry & Chemical Engineering, Shaanxi Normal University, Xi’an, 710119, China. E-mail: nzhao@snnu.edu.cn
First published on 20th April 2018
Abstract
In this work, we report a fluorescent probe (TPEQN-P) for detecting alkaline phosphatase (ALP) with high sensitivity and monitoring its activity based on the specific aggregation-induced emission (AIE) effect. TPEQN-P can be constructed by conjugating the phosphate moiety into an AIE molecule (TPE-QI) through a reactive p-hydroxybenzyl group, which exhibits very weak emission in aqueous media due to its good water solubility. In the presence of ALP, TPEQN-P undergoes dephosphorylation and releases the hydrolysis product TPE-QI, which is intensely fluorescent because of its poor water solubility. The detection limit for ALP using TPEQN-P can be as low as 0.0077 U L−1 with a linear range of 0–30 mU mL−1 in solution. TPEQN-P also shows excellent applicability in serum samples, demonstrating potential applications in clinical diagnosis and biomedical research. TPEQN-P also can be applied for the determination of ALP activity and in ALP inhibitor screening.
Introduction
Alkaline phosphatase (ALP), a crucial enzyme that exists in a variety of tissues (liver, bone, and so on), has been serving as a critical biomarker for molecular biology and as a diagnostic indicator for many human diseases, due to its great ability to remove the phosphate group from corresponding substrates (nucleic acids, proteins, alkaloids).1 For example, bone diseases (Paget’s disease, osteoblastic bone cancer, and osteomalacia) and liver diseases or damage (hepatitis, cancer, and obstructive jaundice) are all correlated with an abnormal level of ALP in blood serum.2,3 Therefore, the establishment of a highly sensitive, highly selective, and rapid detection method for ALP is overwhelmingly meaningful.Among the diverse detection strategies, fluorescence approaches have attracted considerable attention due to their high sensitivity, low cost, easy operation, and real-time detection.4 Numerous fluorescent probes for detecting ALP have been reported based on nanomaterials and small organic fluorophores with various mechanisms.5,6 Nevertheless, most of the traditional probes require either complex steps to give a sufficiently detectable signal, or the introduction of a quencher to reduce background fluorescence. Recently, a kind of fluorogen with aggregation-induced emission (AIE) characteristics has emerged as a promising fluorescent probe. Unlike conventional fluorophores, which suffer from emission quenching in high concentrations or in the solid state due to strong π–π stacking, AIE fluorogens displayed no or weak emission in solution state, but had strong emission in their condensed state due to the restriction of intramolecular rotations (RIR).7 Taking advantage of this unique property, many fluorescent probes based on the AIE effect have been reported for the detection of ions, gases, small molecules, and biomolecules.8–11 In particular, this AIE feature has also been applied to detect ALP.12 Despite this great work, methods for the detection of ALP are still not sensitive enough. Thus, the development of a simple and sensitive AIE probe for ALP is still significantly important from both fundamental and practical viewpoints.
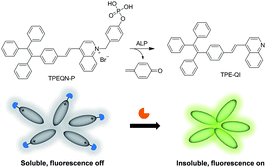
Herein, we designed and synthesized a cationic AIE fluorescent probe (TPEQN-P) bearing a phosphate moiety for detecting ALP. TPEQN-P has excellent water solubility and displayed negligible fluorescence in aqueous media. In the presence of ALP however, the fluorescence increased significantly due to TPEQN-P having undergone a dephosphorylation reaction that released the hydrolysis product (TPE-QI), which was insoluble and formed aggregates in the detecting media (Scheme 1). This specific fluorescence turn-on phenomenon enabled TPEQN-P to detect ALP with high sensitivity in solution as well as in a serum sample. The kinetic behaviour of ALP was determined and an ALP inhibitor screening was performed, with TPEQN-P.
Results and discussion
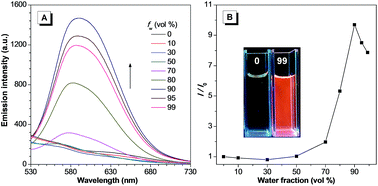
The synthetic route for TPEQN-P is shown in Scheme S1.† Briefly, intermediate compounds 1–4 and (E)-4-(4-(1,2,2-triphenylvinyl)styryl)quinoline (TPE-QI) were synthesized according to previous literature.13,14 TPE-QI and 4-(bromomethyl)phenyl diethyl phosphate (4) were refluxed in acetonitrile, followed by a hydrolysis reaction to give the desired product TPEQN-P in 79% yield. The chemical structures of these compounds were characterized by 1H and 13C NMR spectroscopy, high resolution mass spectrometry (HRMS), and satisfactory analysis data corresponding to their expected molecular structures were obtained.TPEQN-P showed a long absorption band around 420 nm in DMSO solution (Fig. S1†), which was attributed to the typical intramolecular charge transfer (ICT) based on a previous report.14 Upon photoexcitation, TPEQN-P exhibited almost zero emission in solution (Fig. 1A). When the water fraction (fw) was increased up to 50%, TPEQN-P remained virtually non-fluorescent. However, when fw was greater than 50%, the fluorescence gradually increased. At a fw of 90% the emission reached its maximum, which represented about a 10-fold enhancement in intensity than that obtained in pure DMSO (Fig. 1B). This enhanced emission could be associated with the formation of aggregates, which suppressed the non-radiative relaxation channels. For the purpose of practical application, the emission behaviour of TPEQN-P was also investigated in a DMSO and Tris–HCl buffer (10 mM, pH = 9.0) mixture. It is noted that the fluorescence intensity of TPEQN-P became weaker compared with that from the DMSO–water solution (Fig. S2†). Even when increasing the buffer fraction to 99%, the emission was still not strong, indicative of its better solubility in the buffer solution.
After proving the optical properties of TPEQN-P, its fluorescence response to ALP (100 mU mL−1) was tested under different pH conditions (Fig. S3†). The results revealed that emission was enhanced for the pH values 8–10, indicating that alkaline conditions were favourable for the detection process. Meanwhile, the effect of temperature for ALP detection (100 mU mL−1) was also investigated (Fig. S4†). It is obvious that the emission of TPEQN-P could be enhanced by ALP when the temperature was higher than 30 °C. Combining the optical features and reactivity of TPEQN-P, we set up the optimized detection conditions as follows: the probe in 80% Tris–HCl buffer solution (10 mM, pH = 9.0) with 20% DMSO was incubated with ALP at 37 °C for 1 hour.
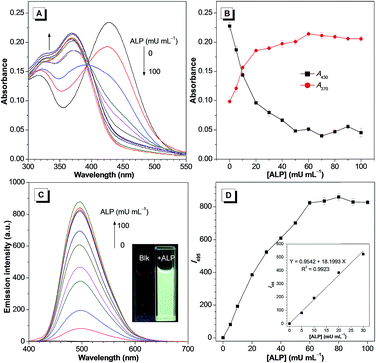
The detailed response of TPEQN-P (10 μM) towards ALP was then measured. As shown in Fig. 2A, after the addition of ALP (0–100 mU mL−1) the absorption band at 430 nm decreased gradually, along with the increase of a new absorption peak at around 370 nm. Meanwhile, a clear isosbestic point is present at 400 nm, which suggests that a new species was generated by the reaction of TPEQN-P and ALP. Correspondingly, introducing ALP yielded an emission intensity enhancement at 495 nm (Fig. 2C). When 60 mU mL−1 ALP was used the emission intensity reached saturation, with the emission color varying from originally colourless to green under 365 nm UV irradiation. It is noteworthy that the emission intensity at 495 nm exhibited a good linear relationship (R2 = 0.9923) against the concentration of ALP ranging from 0 to 30 mU mL−1 (Fig. 2D inset), which enabled TPEQN-P to serve as a probe for ALP with the capability of quantitative analysis. The detection limit for ALP was calculated to be 0.0077 U L−1 based on the 3σ/k method, which is much lower than those of most reported fluorescent probes (Table S1†), and is indicative of the high sensitivity of TPEQN-P.
To further explore the detecting capability of TPEQN-P in biological samples, an experiment was conducted in 80% Tris–HCl buffer solution (10 mM, pH = 9.0) containing 2% fetal bovine serum (FBS). The fluorescence was also enhanced with increasing ALP concentration, although the rate of increase was slower than that under the media without FBS (Fig. S5†). Importantly, a good linear relationship (R2 = 0.9983) was also obtained when plotting the intensity at 495 nm against the concentration of ALP from 0 to 30 mU mL−1 (Fig. S5† inset). Accordingly, the standard addition method was used to analyse the concentration of ALP in diluted serum (Table 1). By increasing the concentration of the standard solutions of ALP from 5 to 25 mU mL−1, the recovery of the spiked serum samples was more than 96% while the relative standard deviation (RSD) was less than 1.95%, suggesting that TPEQN-P has a satisfying and practical applicability for the quantitative analysis of ALP in real samples.
| Samples | Added [mU mL−1] | Found [mU mL−1] | Recovery [%] | RSD (n = 3, %) |
|---|---|---|---|---|
| Diluted serum | 5 | 4.799 | 96.03 | 1.95 |
| 15 | 14.858 | 99.07 | 1.76 | |
| 25 | 25.273 | 101.01 | 0.87 |
In order to confirm that the fluorescence enhancement originated from the dephosphorylating reaction of TPEQN-P triggered by ALP, a high performance liquid chromatography (HPLC) analysis was performed. As described in Fig. S6,† TPEQN-P displayed one peak at a retention time of 9.5 min. After incubating TPEQN-P with ALP (100 mU mL−1) the signal at 9.5 min disappeared, while a new peak at 19.5 min appeared remarkably. Since pure TPE-QI was found to have a retention time of 19.5 min, the observation proved that TPEQN-P was dephosphorylated efficiently by ALP and led to the generation of a new product TPE-QI. The effect of ALP on the micromorphology of TPEQN-P was further investigated by a scanning electron microscope (SEM) and the results revealed that TPEQN-P formed an amorphous film, probably due to its good solubility in aqueous solution (Fig. 3A). However, uniform nanoparticles were formed after the incubation of TPEQN-P with ALP (Fig. 3B), which implied that the hydrolysis product of TPE-QI possess poorer solubility under the same conditions. In addition, the average diameter of nanoaggregates in the presence of ALP was determined to be 280.8 nm by using dynamic light scattering (DLS), whereas no signal was detected for TPEQN-P alone (Fig. S7†), which further confirmed the formation of TPE-QI nanoaggregates in aqueous solution. Based on the RIR mechanism the aggregation blocks the intramolecular rotation, which results in an enhancement of fluorescence.
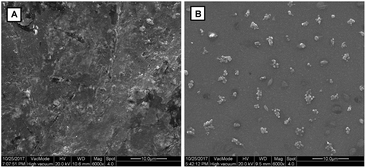 | ||
| Fig. 3 SEM images of TPEQN-P (10 μM) in the absence (A) and in the presence (B) of ALP (100 mU mL−1). | ||
Furthermore, dynamic studies were conducted to study the ALP-catalysed hydrolysis of TPEQN-P. The time-dependent fluorescence intensity increment was measured by using TPEQN-P (10 μM) with different amounts of ALP ranging from 0 to 100 mU mL−1 within 80 minutes (Fig. S8†). Clearly, a sharper emission enhancement at 495 nm was acquired when high concentrations of ALP were loaded into the solution of TPEQN-P. This phenomenon demonstrated that a higher ALP concentration led to a faster cleavage reaction rate of TPEQN-P and promoted the generation of more TPE-QI.
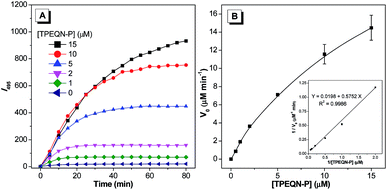
Encouraged by the above results, kinetic parameters including the Michaelis constant (KM), the turnover number (kcat) and the catalytic efficiency constant (kcat/KM) were determined. Various concentrations of TPEQN-P (0–15 μM) were incubated with ALP (50 mU mL−1) and the change of intensity at 495 nm was monitored over 80 minutes. The emission intensity was found to be enhanced along with increase of TPEQN-P concentration, and this increase was rapid in the early stage (Fig. 4A). The data was then directly fitted to the Lineweaver–Burk plot, 1/V0 = KM/kcat[E0][S] + 1/kcat[E0], where V0 is the initial rate or velocity, [S] is the concentration of substrate and [E0] is concentration of ALP. The slope and intercept were obtained from a straight line (Fig. 4B inset), and the KM and kcat were determined to be 29 μM and 4.95 s−1, respectively. The value of kcat/KM was calculated to be 5 × 10⁵ M−1 S−1, which was higher than that of the commercial substrate 4-MUP (kcat/KM = 7.7 × 10³ M−1 S−1), suggesting the high catalytic efficiency of ALP towards TPEQN-P.
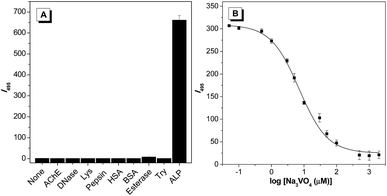
In order to evaluate the selectivity of TPEQN-P experiments with other nonspecific enzymes including bovine serum albumin (BSA), deoxyribonuclease (DNase), acetylcholinesterase (AChE), esterase, human serum albumin (HSA), trypsin, pepsin, and lysozyme were performed under the same conditions. After incubation with 0.001 mg mL−1 of either BSA or HSA, or 100 mU mL−1 of one of the other enzymes, only ALP induced about a 650-fold enhancement of emission whereas the other proteins gave a negligible emission change (Fig. 5A and S9†). Experimental results indicated the existence of a specific reaction between TPEQN-P and ALP, which endows TPEQN-P with excellent selectivity towards ALP.
Considering that the activity of ALP can be extremely inhibited in the presence of an inhibitor, we also evaluated the possibility of using TPEQN-P for inhibitor screening assays. A common phosphatases inhibitor, sodium orthovanadate (Na3VO4), was selected for this study. ALP was pre-incubated with different concentrations of Na3VO4 (0.01, 0.05, 0.1, 0.5, 1, 3, 5, 10, 30, 50, 100, 500, 1000, and 2000 μM) for 30 minutes, then the above Na3VO4 pre-treated solution was added to a solution of TPEQN-P, and the enzymatic reaction was monitored by measuring the intensity at 495 nm. As revealed in Fig. 5B, the emission intensity was reduced remarkably when the concentration of Na3VO4 was increased. The value of IC50 was calculated to be 8.124 μM for Na3VO4, which was in good agreement with the values of previous reports.6a,13 These results confirmed that TPEQN-P could be used for both the detection of ALP activity and in a screening assay for an ALP inhibitor.
Conclusions
In conclusion, a sensitive fluorescent probe (TPEQN-P) was developed for detecting ALP as well as monitoring its activity based on the AIE effect. TPEQN-P was weakly emissive due to its great solubility in aqueous media. In the presence of ALP, TPEQN-P remarkably exhibited a fluorescence “turn-on” response because of the synergetic effect of ALP catalysis and the specific AIE feature of the catalysis product. The detection limit for ALP was as low as 0.0077 U L−1 with a linear range of 0–30 mU mL−1 in solution. Meanwhile, TPEQN-P also presented excellent applicability in a diluted serum sample. Furthermore, ALP activity determination and ALP inhibitor screening could be successfully investigated using TPEQN-P.Experimental section
Chemical
CH2Cl2 and N,N-dimethylformamide (DMF) were distilled over CaH2. All other reagents and solvents were used directly from the corresponding supplier without further purification. All starting materials were purchased from TCI, Aladdin, Energy, Accela and used directly. Bovine serum albumin (BSA) and esterase were purchased from Aladdin, deoxyribonuclease (DNase), acetylcholinesterase (AChE), human serum albumin (HSA), trypsin, pepsin and lysozyme were purchased from Sigma.Instrumentation
Nuclear magnetic resonance spectra (1H, 13C NMR) were recorded on a Bruker Ascend 400 (1H at 400 MHz, 13C at 101 MHz) or a Bruker Ascend 600 (1H at 600 MHz, 13C at 151 MHz). The chemical shifts are reported as ppm and solvent residual peaks were shown as follows: CDCl3 δ H (7.26 ppm) and δ C (77.16 ppm); CD3OH δ H (3.31 ppm) and δ C (49.00 ppm). UV-visible absorption spectra were measured on a Purkinje TU-1950 spectrometer. Fluorescence spectra were recorded on a Hitachi F-7000 spectrometer. Dynamic Light Scattering (DLS) was carried out on a Malvern Zetasizer Nano ZS90. High performance liquid chromatography (HPLC) spectra were obtained on a Hitachi Chromaster. SEM pictures were be obtained on an environmental scanning electron microscope Quanta 200. High-resolution mass spectra were obtained on a Bruker Maxis and Microflex and are reported as m/z (relative intensity).Preparation of aggregates
Stock DMSO solutions of the fluorogens with a concentration of 1 mM were prepared. Aliquots of the stock solutions were transferred to 3 mL volumetric flasks. After appropriate amounts of DMSO were added, water was added dropwise under vigorous stirring to give 10 μM solutions with different water contents (0–99 vol%). The fluorescence measurements of the resulting solutions were then performed immediately.ALP activity assay
TPEQN-P stock solution (1 mM in DMSO) was diluted with 80% Tris–HCl buffer (10 mM, pH = 9.0) and 20% DMSO to make a 10 μM working solution. Different amounts of ALP stock solutions (75 U mL−1 in Tris–HCl buffer, 10 mM, pH 9.0, 1 mM MgCl2, 0.1 mM ZnCl2) were added into the solution of TPEQN-P to yield final concentrations of ALP ranging from 0 to 100 mU mL−1. The UV-vis and fluorescence measurements were carried out after the prepared solutions were incubated at 37 °C for 1 hour. For the selectivity test, all other enzymes were tested under the same conditions with ALP.ALP activity assay in serum samples
The fetal bovine serum (FBS) was diluted with Tris–HCl buffer (10 mM, pH = 9.0) to prepare 80% Tris–HCl buffer (10 mM, pH = 9.0) and 20% DMSO (containing 2% FBS) solution. The ALP activity assay of the serum sample was then carried out according to above method “ALP Activity Assay”. Different concentrations of ALP (5, 15 and 25 mU mL−1) were spiked with the serum solution and used for recovery tests.Kinetic studies
To determine the kinetic parameters of the hydrolysis reaction by ALP, TPEQN-P was dissolved in 80% Tris–HCl buffer (10 mM, pH = 9.0) and 20% DMSO to prepare TPEQN-P solutions of different concentrations (0, 1.0, 2.0, 5.0 and 10 μM), followed by the addition of ALP (100 mU mL−1) for the dephosphorylation reaction. The enzymatic reaction was monitored through the change of fluorescence intensity at 495 nm at different time intervals after incubation at 37 °C for 1 hour. The kinetic parameters (e.g., KM and kcat) of the hydrolysis reaction of TPEQN-P were determined from a Lineweaver–Burke plot.ALP inhibitor investigation
In order to investigate the application of TPEQN-P for ALP inhibitor evaluation, Na3VO4 solution with different concentrations (from 0.01 to 2000 μM) was added into the ALP reaction system (100 mU mL−1) at 37 °C for 30 min. The inhibitor treated ALP reaction solution was mixed with TPEQN-P (10 μM) in 80% Tris–HCl buffer (10 mM, pH = 9.0) and 20% DMSO at 37 °C for 1 hour, and then the fluorescence spectrum was recorded.Conflicts of interest
The authors declare that there are no conflicts of interest.Acknowledgements
We are grateful for financial support from the National Natural Science Foundation of China (51403122, 21672135 and 21402115), the Fundamental Research Funds for the Central Universities (GK201703024 and GK201702002), the Young Talent Fund of University Association for Science and Technology in Shaanxi (2017030021) and the Natural Science Foundation of Shaanxi Province (2016JQ2020).Notes and references
- (a) J. E. Coleman, Annu. Rev. Biophys. Biomol. Struct., 1992, 21, 441–483 CrossRef CAS PubMed; (b) N. J. Fermandez and B. A. Kidney, Vet. Clin. Pathol., 2007, 36, 223–227 CrossRef.
- (a) O. Maldonado, R. Demasi, Y. Maldonado, M. Taylor, F. Troncale and R. Vender, J. Clin. Gastroenterol., 1998, 27, 342–345 CrossRef CAS PubMed; (b) A. R. Khan, F. R. Awan, S. Najam, M. Islam, T. Siddique and M. Zain, JPMA, J. Pak. Med. Assoc., 2015, 65, 1182–1185 Search PubMed.
- (a) J. P. Smus, C. C. Moura, E. McMorrow, R. S. Tare, R. O. C. Oreffo and S. Mahajan, Chem. Sci., 2015, 6, 7089–7096 RSC; (b) K. Ooi, K. Shiraki, Y. Morishita and T. Nobori, J. Clin. Lab. Anal., 2007, 21, 133–139 CrossRef CAS PubMed.
- (a) Y. Yang, Q. Zhao, W. Feng and F. Li, Chem. Rev., 2013, 113, 192–270 CrossRef CAS PubMed; (b) W. Sun, S. Guo, C. Hu, J. Fan and X. Peng, Chem. Rev., 2016, 116, 7768–7817 CrossRef CAS PubMed; (c) T. D. Ashton, K. A. Jolliffe and F. M. Feffer, Chem. Soc. Rev., 2015, 44, 4547–4595 RSC; (d) L. You, D. Zha and E. V. Anslyn, Chem. Rev., 2015, 115, 7840–7892 CrossRef CAS PubMed; (e) M. Vendrell, D. Zhai, J. C. Er and Y. T. Chang, Chem. Rev., 2012, 112, 4391–4420 CrossRef CAS PubMed; (f) J. L. Kolanowski, F. Liu and E. J. New, Chem. Soc. Rev., 2018, 47, 195–208 RSC; (g) A. S. Klymchenko, Acc. Chem. Res., 2017, 50, 366–375 CrossRef CAS PubMed; (h) S. Leng, Q. L. Qiao, Y. Gao, L. Miao, W. G. Deng and Z. C. Xu, Chin. Chem. Lett., 2017, 28, 1911–1915 CrossRef CAS.
- (a) J. J. Liu, D. S. Tang, Z. T. Chen, X. M. Yan, Z. Zhong, L. T. Kang and Z. N. Yao, Biosens. Bioelectron., 2017, 94, 271–277 CrossRef CAS PubMed; (b) Z. S. Qian, L. J. Chai, C. Tang, Y. Y. Huang, J. R. Chen and H. Feng, Anal. Chem., 2015, 87, 2966–2973 CrossRef CAS PubMed; (c) H. Liu, M. Li, Y. Xia and X. Ren, ACS Appl. Mater. Interfaces, 2017, 9, 120–126 CrossRef CAS PubMed; (d) R. Freeman, T. Finder, R. Gill and I. Willner, Nano Lett., 2010, 10, 2192–2196 CrossRef CAS PubMed; (e) P. Song, Q. Liu, Y. Zhang, W. Liu, M. Meng, Y. Yin and R. Xi, RSC Adv., 2018, 8, 162–169 RSC.
- (a) Y. Tan, L. Zhang, K. H. Man, R. Peltier, G. Chen, H. Zhang, L. Zhou, F. Wang, D. Ho, S. Q. Yao, Y. Hu and H. Sun, ACS Appl. Mater. Interfaces, 2017, 9, 6796–6803 CrossRef CAS PubMed; (b) M. C. L. Yeung and V. W. W. Yam, Chem. Sci., 2013, 4, 2928–2935 RSC; (c) L. Jia, J. P. Xu, D. Li, S. P. Pang, Y. Fang, Z. G. Song and J. Ji, Chem. Commun., 2010, 46, 7166–7168 RSC; (d) Q. Chen, N. Bian, C. Cao, X. L. Qiu, A. D. Qi and B. H. Han, Chem. Commun., 2010, 46, 4067–4069 RSC; (e) T. I. Kim, H. Kim, Y. Choi and Y. Kim, Chem. Commun., 2011, 47, 9825–9827 RSC; (f) L. Zhang, J. Zhao, M. Duan, H. Zhang, J. Jiang and R. Yu, Anal. Chem., 2013, 85, 3797–3801 CrossRef CAS PubMed.
- (a) J. Luo, Z. Xie, J. W. Y. Lam, L. Cheng, H. Chen, C. Qiu, H. S. Kwok, X. Zhan, Y. Liu, D. Zhu and B. Z. Tang, Chem. Commun., 2001, 1740–1741 RSC; (b) J. Mei, N. L. C. Leung, R. T. K. Kwok, J. W. Y. Lam and B. Z. Tang, Chem. Rev., 2015, 115, 11718–11940 CrossRef CAS PubMed; (c) D. Ding, K. Li, B. Liu and B. Z. Tang, Acc. Chem. Res., 2013, 46, 2441–2453 CrossRef CAS PubMed; (d) Y. Hong, J. W. Y. Lam and B. Z. Tang, Chem. Soc. Rev., 2011, 40, 5361–5388 RSC; (e) Z. Zhao, B. He and B. Z. Tang, Chem. Sci., 2015, 6, 5347–5365 RSC; (f) G. Zhang, F. Hu and D. Zhang, Langmuir, 2015, 31, 4593–4604 CrossRef CAS PubMed.
- (a) P. Alam, G. Kaur, C. Climent, S. Pasha, D. Casanova, P. Alemany, A. Roy Choudhury and I. R. Laskar, Dalton Trans., 2014, 43, 16431–16440 RSC; (b) L. N. Neupane, E. T. Oh, H. J. Park and K. H. Lee, Anal. Chem., 2016, 88, 3333–3340 CrossRef CAS PubMed; (c) C. Niu, Q. Liu, Z. Shang, L. Zhao and J. Ouyang, Nanoscale, 2015, 7, 8457–8465 RSC; (d) N. Zhao, J. W. Y. Lam, H. H. Y. Sung, H. M. Su, I. D. Williams, K. S. Wong and B. Z. Tang, Chem.–Eur. J., 2014, 20, 133–138 CrossRef CAS PubMed; (e) Y. Zhang, Y. Li, X. Yang, Y. Ding, Z. Zhao, X. Liu, Z. Yang and Y. Cui, Talanta, 2018, 179, 177–185 CrossRef CAS PubMed; (f) A. Chatterjee, M. Banerjee, D. G. Khandare, R. U. Gawas, S. C. Mascarenhas, A. Ganguly, R. Gupta and H. Joshi, Anal. Chem., 2017, 89, 12698–12704 CrossRef CAS PubMed; (g) J. Wang, Y. Li, K. Li, X. Meng and H. Hou, Chem.–Eur. J., 2017, 23, 5081–5089 CrossRef CAS PubMed.
- (a) Y. Hang, J. Wang, T. Jiang, N. Lu and J. Hua, Anal. Chem., 2016, 88, 1696–1703 CrossRef CAS PubMed; (b) S. Samanta, U. Manna, T. Ray and G. Das, Dalton Trans., 2015, 44, 18902–18910 RSC; (c) C. Gao, G. Gao, J. Lan and J. You, Chem. Commun., 2014, 50, 5623–5625 RSC; (d) J. Zhao, D. Yang, Y. X. Zhao, X. J. Yang, Y. Y. Wang and B. Wu, Angew. Chem., Int. Ed., 2014, 53, 6632–6636 CrossRef CAS PubMed; (e) H. R. Xu, K. Li, S. Y. Jiao, L. L. Li, S. L. Pan and X. Q. Yu, Chin. J. Chem., 2015, 26, 877–880 CAS; (f) S. Y. Chen and X. L. Ni, RSC Adv., 2016, 6, 6997–7001 RSC; (g) Y. Hang, J. Wang, T. Jiang, N. Lu and J. Hua, Anal. Chem., 2016, 88, 1696–1703 CrossRef CAS PubMed.
- (a) X. Wang, J. Hu, G. Zhang and S. Liu, J. Am. Chem. Soc., 2014, 136, 9890–9893 CrossRef CAS PubMed; (b) Y. Zhuang, F. Huang, Q. Xu, M. Zhang, X. Lou and F. Xia, Anal. Chem., 2016, 88, 3289–3294 CrossRef CAS PubMed; (c) Y. Wang, X. Wu, Y. Cheng and X. Zhao, Chem. Commun., 2016, 52, 3478–3481 RSC; (d) W. Shen, J. Yu, J. Ge, R. Zhang, F. Cheng, X. Li, Y. Fan, S. Yu, B. Liu and Q. Zhu, ACS Appl. Mater. Interfaces, 2016, 8, 927–935 CrossRef CAS PubMed; (e) X. T. Chen, Y. Xiang, N. Li, P. S. Song and A. J. Tong, Analyst, 2010, 135, 1098–1105 RSC; (f) X. Xu, J. Huang, J. Li, J. Yan, J. Qin and Z. Li, Chem. Commun., 2011, 47, 12385–12387 RSC.
- (a) M. Gao, S. Li, Y. Lin, Y. Geng, X. Ling, L. Wang, A. Qin and B. Z. Tang, ACS Sens., 2016, 1, 179–184 CrossRef CAS; (b) Y. Liu, Y. H. Tang, N. N. Barashkov, I. S. Irgibaeva, J. W. Y. Lam, R. R. Hu, D. Birimzhanova, Y. Yu and B. Z. Tang, J. Am. Chem. Soc., 2010, 132, 13951–13953 CrossRef CAS PubMed; (c) S. Gong, Q. Liu, X. Wang, B. Xia, Z. Liu and W. He, Dalton Trans., 2015, 44, 14063–14070 RSC; (d) H. Xie, Y. Wu, F. Zeng, J. Chen and S. Wu, Chem. Commun., 2017, 53, 9813–9816 RSC; (e) Z. Wang, H. Nie, Z. Yu, A. Qin, Z. Zhao and B. Z. Tang, J. Mater. Chem. C, 2015, 3, 9103–9111 RSC.
- (a) Z. G. Song, T. K. Kwok Ryan, E. Zhao, Z. K. He, Y. N. Hong, W. Y. Lam Jacky, B. Liu and B. Z. Tang, ACS Appl. Mater. Interfaces, 2014, 6, 17245–17254 CrossRef CAS PubMed; (b) J. Liang, T. K. K. Ryan, H. Shi, B. Z. Tang and B. Liu, ACS Appl. Mater. Interfaces, 2013, 5, 8784–8789 CrossRef CAS PubMed; (c) F. Y. Cao, Y. Long, S. B. Wang, B. Li, J. X. Fan, X. Zeng and X. Z. Zhang, J. Mater. Chem. B, 2016, 4, 4534–4541 RSC; (d) X. Gu, G. Zhang, Z. Wang, W. Liu, L. Xiao and D. Zhang, Analyst, 2013, 138, 2427–2431 RSC; (e) J. Shi, Y. Li, Q. Li and Z. Li, ACS Appl. Mater. Interfaces, 2018, 10, 12278–12294 CrossRef CAS PubMed.
- H. Zhang, C. Xu, J. Liu, X. Li, L. Guo and X. Li, Chem. Commun., 2015, 51, 7031–7034 RSC.
- R. X. Zhang, P. F. Li, W. J. Zhang, N. Li and N. Zhao, J. Mater. Chem. C, 2016, 4, 10479–10485 RSC.
Footnote |
| † Electronic supplementary information (ESI) available: Synthesis, characterization and optical spectra. See DOI: 10.1039/c8ra01786g |
| This journal is © The Royal Society of Chemistry 2018 |

