
 Open Access Article
 This Open Access Article is licensed under a
 Creative Commons Attribution 3.0 Unported Licence
Monitoring bromide effect on radiolytic yields using in situ observations of uranyl oxide precipitation in the electron microscope†
Edgar C. Buck *,
Richard S. Wittman,
Chuck. Z. Soderquist and
Bruce K. McNamara
*,
Richard S. Wittman,
Chuck. Z. Soderquist and
Bruce K. McNamara
Pacific Northwest National Laboratory, 902 Battelle Blvd., Richland, WA 99352, USA. E-mail: edgar.buck@pnnl.gov
First published on 22nd May 2018
Abstract
During electron microscopy observations of uranium-bearing phases and solutions in a liquid cell, the electron beam induced radiolysis causes changes in the chemistry of the system. This could be useful for investigating accelerated alteration of UO2 and can be also used to monitor radiolytic effects. Low concentrations of bromide in aqueous solutions are known to reduce the generation rate of H2O2 during radiolysis and increase H2 production. We deduced the presence of radiolytic H2O2 by monitoring the formation of a uranyl peroxide solid from both solid UO2 and a solution of ammonium uranyl carbonate at neutral pH. Additionally, the effect of bromine on water radiolysis was investigated through chemical modelling and in situ electron microscopy. By measuring the contrast in the electron microscopy images it was possible to monitor H2O2 formation and diffusion from the irradiated zone in agreement with the models.
Introduction
Electron-beam-induced processes that occur during liquid cell in situ electron microscopy can drive pH changes, reduce metal ions, through the generation of reactive radiolytic species.1–4 Along with ionization, the interaction of an energetic electron beam with water molecules will generate very short-lived (10−15 s) electronic excitations that favourably de-excite through intermediate atomic and molecular radicals. The reaction of these radicals with the surrounding aqueous environment occurs on the scale of 10−9 s, resulting in six dominant species (H2O2, H2, OH˙, H˙, eaq−, and H+).5 The production rate of these species is described by a ‘G-value’ that represents the number of species produced per 100 eV deposited in the irradiated solution within a small volume, termed the radiation spur. The G-value depends on the linear energy transfer (LET) of the ionizing particle travelling through the medium. As the species form, they will also diffuse rapidly through the fluid phase, undergoing other reactions. Oxygen which is not a direct radiolytic product is produced outside the radiation spur; however, its magnitude typically matches the production rate of the other molecular species (H2 and H2O2).The radiolytic processes that occur during liquid cell (LC) electron microscopy (EM) and can lead to many chemical effects. It is important that any observations are also supported by other methods that do not create these reactive species or with an understanding of how radiolysis will affect the LC. Nevertheless, the direct study of electron beam effects can provide intriguing insight into the chemistry of a system and that may help to solve the complexities of mineral dissolution.6–8
Materials and methods
Experiments were conducted with both solid and dissolved U, and a control study was performed with DI water and solutions containing bromide as described below. For the dissolved U experiments, an approximately 10 mM solution of ammonium uranyl carbonate (AUC), [(NH4)4UO2(CO3)3] (522.2 g mol−1) was prepared by dissolving 0.0529 g of the uranyl phase in 10 mL of DI water. AUC is an important component in the industrial conversion of UF6 to UO2. The bromine solutions were made as follows: 10−2 M solution of KBr (119.0 g mol−1) was produced by dissolving 0.0153 g of KBr in 10 mL of DI water. To make the 10−4 M KBr solution, 0.1 mL of the stock 10−2 M solution was diluted to 10 mL. 1 mL of this solution was diluted to 10 mL to yield the 10−5 M solution, and 1 mL of this solution was diluted to 10 mL to yield the 10−6 M solution.For the experiments with solid material, a UO2 powder was used (<45 μm size sieved material) that was subsequently crushed between two glass slides to create a < 5 μm particles which were suspended in deionised (DI) water.
Experiments were conducted with 6 μL of solution pipetted into a fresh QX-102 WetSEM sample cell (QuantomiX, Rehovot, Israel). These were examined at 15 keV and with a magnification of 100![[thin space (1/6-em)]](https://www.rsc.org/images/entities/char_2009.gif) 000× using an FEI (Thermo Fisher Scientific, Inc., Hillsboro, Oregon, USA) Quanta 250FEG scanning electron microscope. Irradiations were performed by rastering the beam over a 1 μm2 area and taking backscattered electron (BSE) images every few seconds.
000× using an FEI (Thermo Fisher Scientific, Inc., Hillsboro, Oregon, USA) Quanta 250FEG scanning electron microscope. Irradiations were performed by rastering the beam over a 1 μm2 area and taking backscattered electron (BSE) images every few seconds.
The irradiation of the beam over a specific area could be accomplished in the microscope by selecting a specific area and allowing the beam to raster continuously. Over time, a white area would form, an image would be taken over a larger area encompassing a much larger area than was irradiated. The images revealed bright regions within the irradiated region. To determine the amount of material in these areas, a line histogram was generated as shown in Fig. 1. The integrated intensity yielded a value that was used to represent the amount of material precipitated. The brightness/contrast settings were kept constant during the irradiations. The background contrast level was the same in each experiment and this value was subtracted from the result to yield the integrated intensity from the presence of the peroxide phase.
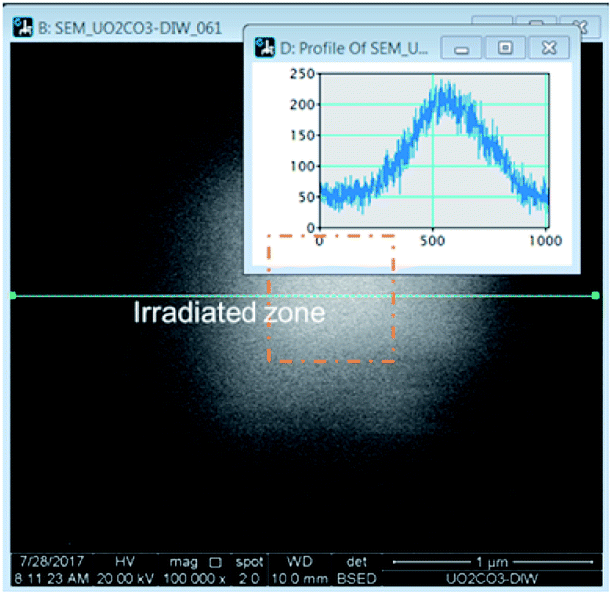 | ||
| Fig. 1 Method for determining the production of U-phase during irradiation. | ||
A beam current of 10.5 pA was measured with Keithley Instruments (Tektronix Inc., Beaverton, Oregon, USA) 485 microvoltmeter. This was obtained with a spot size of 1.5 and the smallest available condenser aperture during both image collection and irradiation. This dose prevented rupture of the liquid cell window. The total dose rate was determined to be 7.28 e− per nm2, assuming the irradiated region was 3 μm × 3 μm. As the electron beam was completely stopped within 5 μm, the estimated dose was 3.5 × 10⁶ Gy s−1.
The details of the measurement process are described in the ESI† section. Images were analysed with Gatan DigitalMicrograph 3.0 (Gatan Inc., Pleasanton, California, USA).9 A histogram of intensity was constructed from each image across the forming precipitates and was used as a means to measure H2O2 concentration. Nikon Elements 4.0 (Nikon Instruments, Inc., Melville, New York, USA) was used to determine the area of the features in the images.
Electron scattering effects were modelled using the CASINO program10 using the cross-section models by Browning et al.11 that were more applicable to the SEM beam energies.
Radiolysis model
Water radiolysis generation models have been developed by Shoesmith and co-workers12,13 and Wittman et al.,14 for UO2 dissolution (see Fig. 2); and Schneider et al.,4 for modelling the effects of radiolysis during in situ LC-EM. All models use rate constants from Elliot and McCracken15 to solve a series of equations with stiff ordinary differential equation (ODE) solvers. The code by Wittman and co-workers14 uses the FORTRAN ODEPACK solvers developed at the Lawrence Livermore National Laboratory. The Schneider model uses MATLAB (MathWorks, Natick, Massachusetts, USA) solvers (ode15s) that are also based on the ODEPACK routines. The (Curtiss–Hirschfelder) stiff ODE solvers (MATLAB ode15s) are orders of magnitude faster than non-stiff (Dormand–Prince) solvers and MATLAB (ode45), for these types of problems that have orders of magnitude differences in many of the chemical rate equations to be solved. Like the Schneider model, the model used in this study also included the diffusion of species from the area of irradiation, but also included the effects of carbonate and halides.‡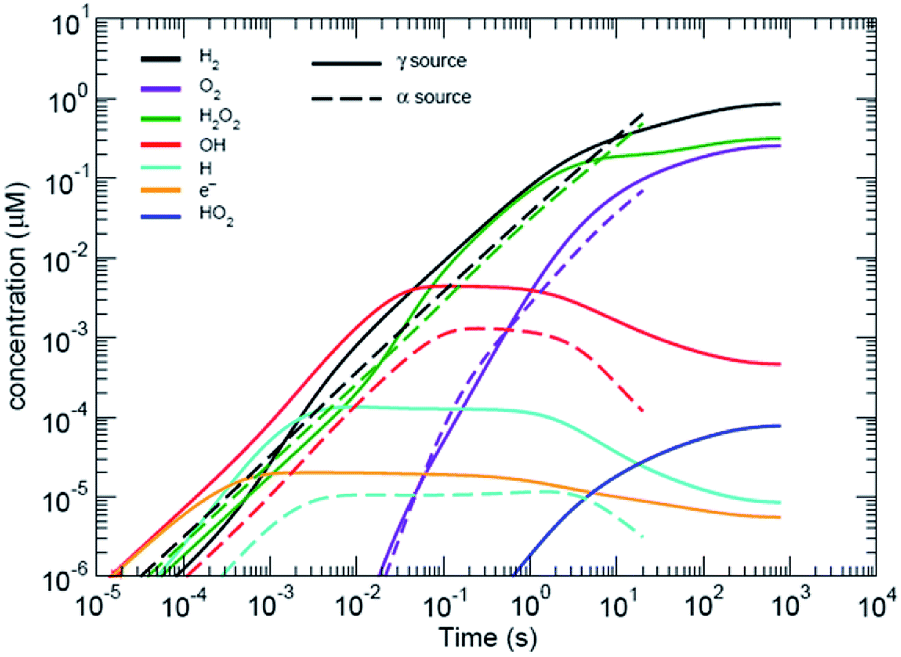 | ||
| Fig. 2 Predicted radiolytic species production rates for both α and β/γ radiation. The black lines corresponds to using the rate constants from ref. 15. α-Radiation results in a continuous production rate of H2 and H2O2; whereas, production under β,γ-radiation reaches a steady-state condition. | ||
As the 15 keV electron beam is completely stopped within 3 μm of water (based on CASINO models (see Fig. 3)), the effective LET for 15 keV in this system is comparable to that β-particles from tritium (3H) where the Emax = 18.6 keV and the mean energy ∼ 5.7 keV. Butarbutar and co-workers have suggested that the effective high LET of 3H β-radiolysis results in G-values that are similar to that of neutrons.16 In this study, we adopted high LET G-values rather than those used for β/γ-radiation. All radiation spurs would occur within this small volume and, hence, molecular products would be favoured over radicals in this environment, as is the case with neutron or α-radiolysis. The G-values used in the model are listed in the ESI.† At higher keV there is greater scattering in regions outside of the 1 μm wide beam irradiated zone but this occurs deeper into the solution (see Fig. 3).
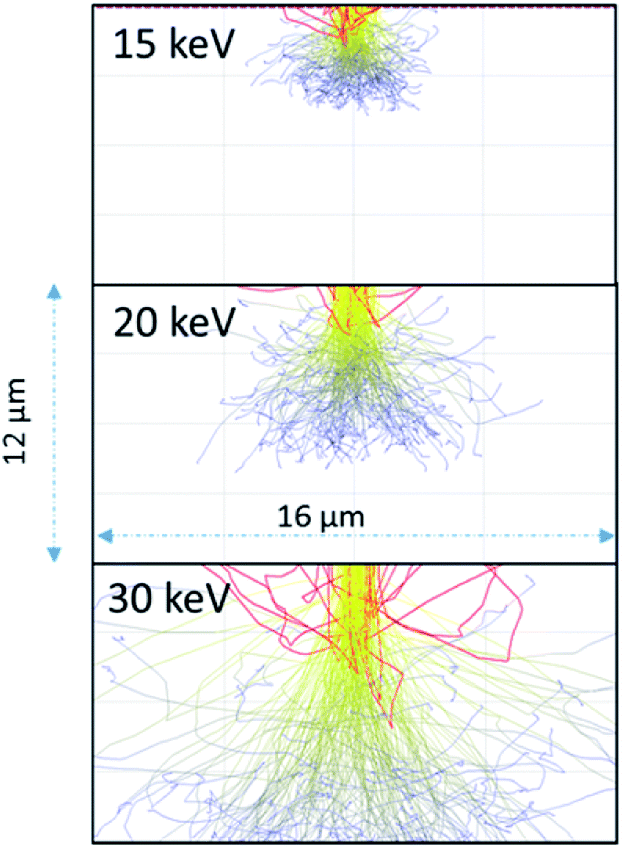 | ||
| Fig. 3 Anticipated electron scattering through water for a 1 μm wide beam at 15, 20, and 30 keV using the CASINO program.10 The red lines are backscattered electrons; the yellow are higher energy electrons leading to radiolytic events. The blue lines are scattered lower energy electrons although these electrons would still induce radiolytic events. | ||
Results of computational modelling
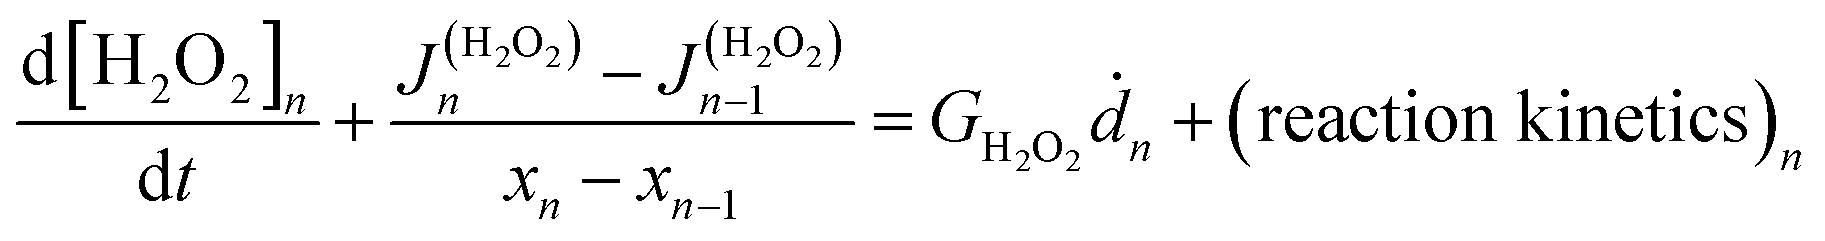
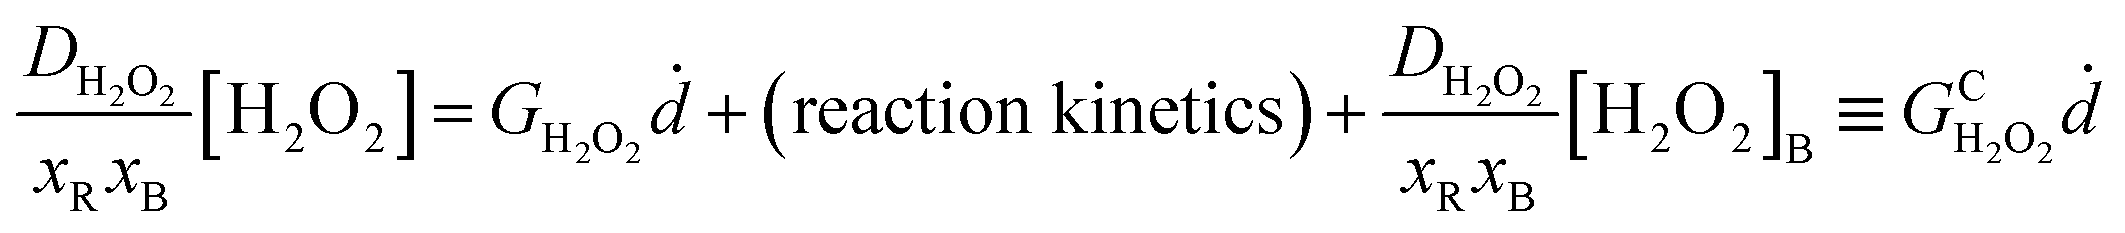
The coupled kinetics/diffusion rate equations for H2O2 on discrete special zones (n) can be expressed in terms concentrations [H2O2]n, fluxes Jn and dose rate according to:
 | (1) |
Assuming nonzero reaction kinetics and dose-rate only in the radiation zone (xR) with diffusion out to the boundary (xB), the steady-state solution to eqn (1) after inserting Fick's law fluxes containing diffusion constant D and boundary concentration [H2O2]B can be written:
 | (2) |
Eqn (2) serves as a working definition of a “conditional” G-value (Gc) for [H2O2] which describes H2O2 generation conditional on the local water chemistry. As compared with the radiolysis model with all approximately 100 reactions to fully describe the system,15 we have shown that only 30–40 of the reactions are required to determine [H2O2] to one part in 10−5 and to preserve most of the predictions for the major species.14 This allows a systematic approach for model simplification and offers guidance in designing experiments for validation. To include the effects of bromide or iodide, several other [Br−] and [I−] related reactions need to be included.17,18
Table 1 includes the main reactions for predicting H2O2 generation in the presence of bromide (for ease of interpretation, we have adopted the same reaction numbers as those reported by Elliot and McCracken15). Without Br− and for low O2 concentration, reaction 33 shows how the presence of H2 converts the ·OH˙ to the ·H˙ to accelerate H2O2 destruction, lowering its conditional G-value. At higher O2 concentrations, O2 effectively competes for ·H˙ radicals to disable H2O2 destruction (reaction 27).
| Reaction | Kr | |
|---|---|---|
| 3 | H2O2 → H+ + ˙HO2− | 1.1 × 10⁻¹ |
| 4 | H+ + ˙HO2− → H2O2 | 5.0 × 10¹⁰ |
| 15 | ˙HO2 → O2− + H+ | 1.3 × 10⁶ |
| 16 | O2− + H+ → ˙HO2 | 5.0 × 10¹⁰ |
| 23 | eaq− + H2O2 → ˙OH + OH− | 1.1 × 10¹⁰ |
| 26 | ˙H + H2O2 → ˙OH + H2O | 9.0 × 10⁷ |
| 27 | ˙H + O2 → ˙HO2 | 2.1 × 10¹⁰ |
| 33 | ˙OH + H2 → ˙H + H2O | 4.3 × 10⁷ |
| 34 | ˙OH + H2O2 → ˙HO2 + H2O | 2.7 × 10⁷ |
| 35 | ˙HO2 + O2− → ˙HO2− + O2 | 8.0 × 10⁷ |
| 36 | H2O2 → ˙OH + ˙OH | 2.5 × 10⁻⁷ |
| 94 | Br− + ˙OH → BrOH− | 1.1 × 10¹⁰ |
| 96 | Br− + ˙H → BrH− | 0.0 × 10⁶ |
| 102 | Br− + H2O2 → Br− + O2− + 2HO+ | 2.5 × 10⁹ |
| 138 | BrOH− → Br− + ˙OH | 3.0 × 10⁷ |
| 139 | BrOH− → ˙Br + OH− | 4.2 × 10⁶ |
The effect of even small concentrations of Br− can be seen in Fig. 4 where there is a decrease in the concentration of H2O2. As the H2O2 concentration decreases, H2 will increase. One question is whether this increasing H2 affects subsequent radiolysis. If the initial H2 concentration is high in the in situ LC, H2 would compete with Br− for OH˙. The model indicates that even at an initial concentration of 100–400 μM of Br−, the presence of H2 should bring Gc from 0.1 to nearly 1 molecule/100 eV. In the experiments, we did not see evidence for this type of process and the results fit models where the initial concentration of H2 is low. During radiolysis, the secondary species, O2, is also generated. In these experiments, the solutions were in equilibrium with atmospheric O2. In the ESI,† the effect of initial concentrations of O2 is described. It is always important to consider the initial conditions. However, the models suggest that if the system was initially devoid of O2, there would be no difference in the H2 and H2O2 concentrations at steady state.
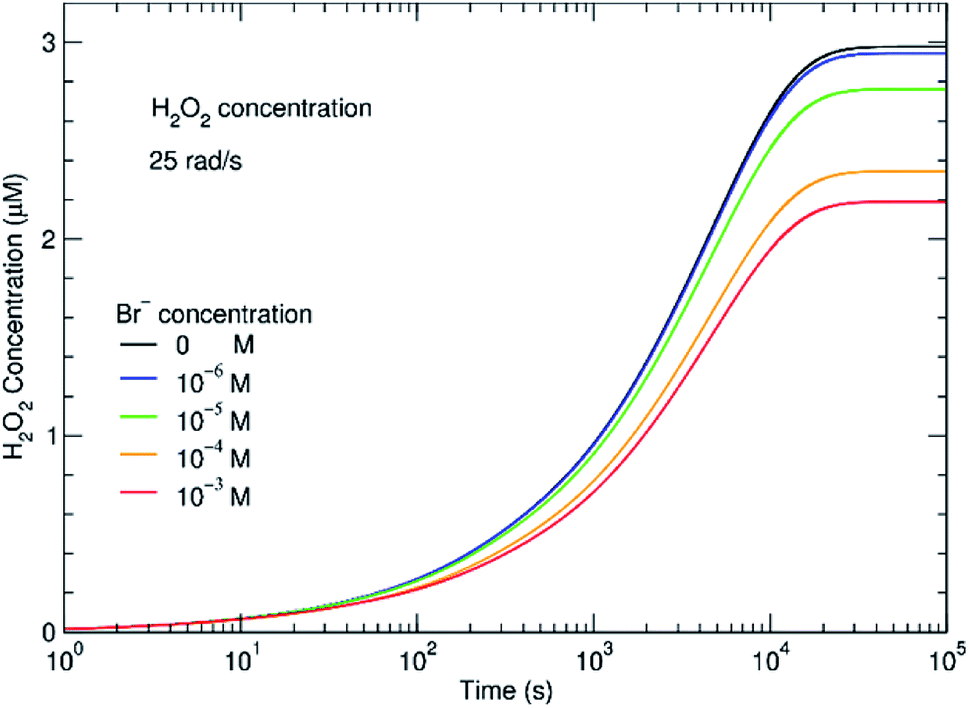 | ||
| Fig. 4 Effect of bromide on the steady-state concentration of H2O2 at a dose rate of 0.25 Gy s−1. Within minutes, the H2O2 concentration reaches a steady state concentration that depends on the initial Br− added. | ||
The radiation source is a surface or point, and allows for the radiolytic species to diffuse away from the irradiation region until steady-state conditions are reached distant from the source.19 This creates a different environment to a homogeneous field. In the electron microscope, the radiation source is also spatially isolated which may lead to different results compared to uniform irradiation.
The main reason for the effect is reaction 94 in Table 1. By competing for the ·OH˙, Br− disables the mechanism for converting ·OH˙ to H˙ radical, strongly lowering the rate of destruction of H2O2 destruction.
Monitoring bromide effect in the liquid cell
In the in situ LC, the formation of a uranyl peroxide exhibited strong bright BSE contrast that was observed within seconds in the DI water case. Fig. 5 is a series of SEM-BSE images that show the development of a uranyl peroxide precipitate in the central region where the irradiation was performed.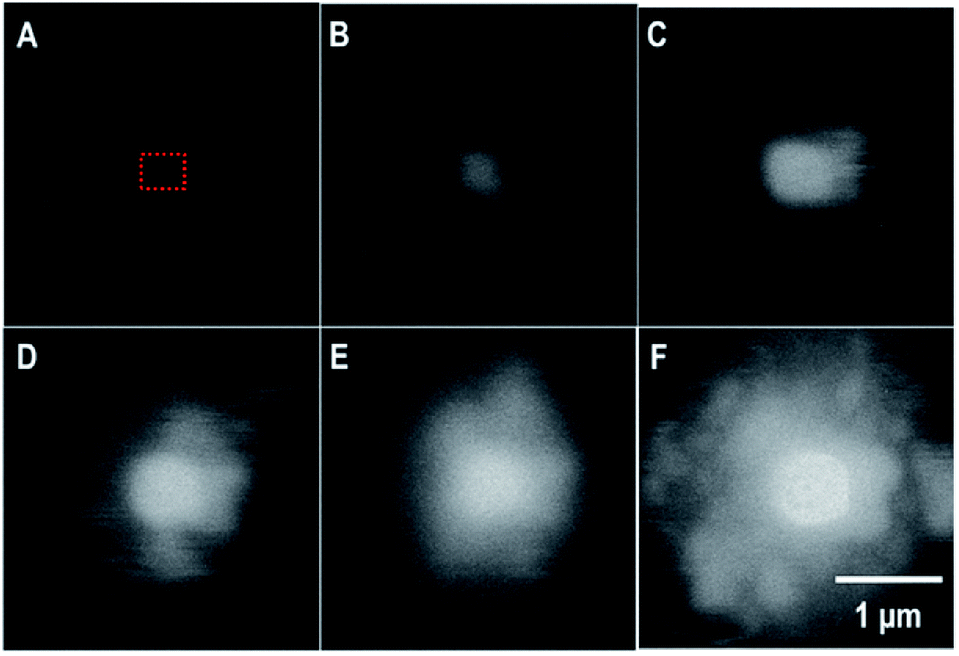 | ||
| Fig. 5 SEM-BSE images from the in situ LC showing the formation of a uranyl peroxide over time: (A) 0 s; (B) 78 s; (C) 194 s; (D) 314 s; (E) 479 s; and (F) 640 s. The irradiation occurred over a < 1 μm2 region in the center.§ The blurring is the result of the fast scan to capture the image without inducing excess irradiation to the area. The dotted red box represents the region that was irradiated. | ||
As the irradiation proceeded, material tended to precipitate far from the region of irradiation. This could be due to multiple scattering of the electrons leading to events outside the region irradiated directly or it could be from the diffusion of the longer-lived H2O2. We performed modelling of the electron scattering using the CASINO program10 to show the effects of different beam energies on electron scattering in the water. At 15 keV, the electrons are completely stopped within 3–5 μm. Resulting in an average LET close to 10 keV μm−1, similar to that of neutrons or tritium. As the beam energy is raised to 30 keV, the electrons penetrate much deeper and there is more scattering. The higher energy beam would be expected to have a lower overall LET, and would have radiolytic production distributions that were more similar to β/γ-sources. The effective of LET of electron beam sources is discussed further in the ESI.†
Similar time-resolved irradiations were performed with different concentrations of bromide (10−4 M, 10−5 M, and 10−6 M) with ammonium uranyl carbonate and monitored with BSE images. The integrated BSE contrast across the collected images was summed and plotted in Fig. 7. These results clearly show the dramatic effect of bromide on H2O2 production. As the bromide concentration was increased to 10−4 M, the bright contrast from the uranyl peroxide precipitate reduced in intensity significantly. Even at low bromide concentrations (10−5 M and 10−6 M) there was a slow-down in the production of H2O2 based on the reduction in the contrast from the U-peroxide phase.
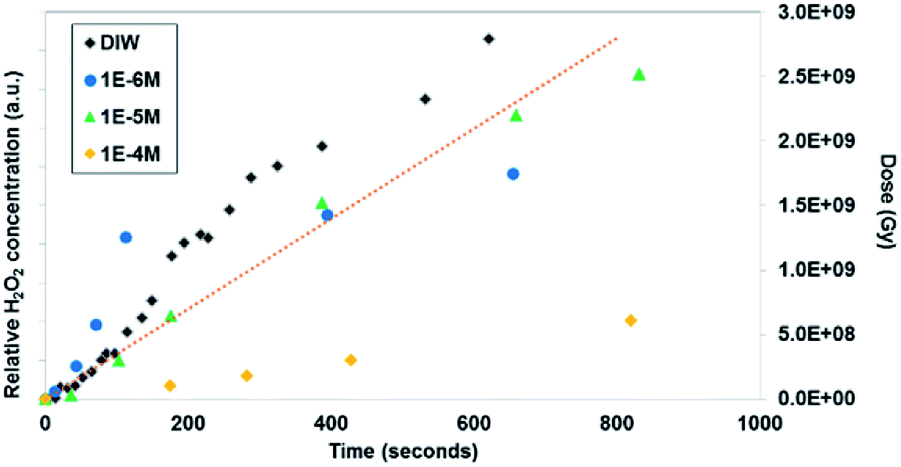 | ||
| Fig. 6 In situ microscopy measurement of uranyl peroxide formation with time and Br concentration (measurement method described in the ESI† section). The dotted line shows the dose (measured in Greys) estimated in the irradiated region with time. | ||
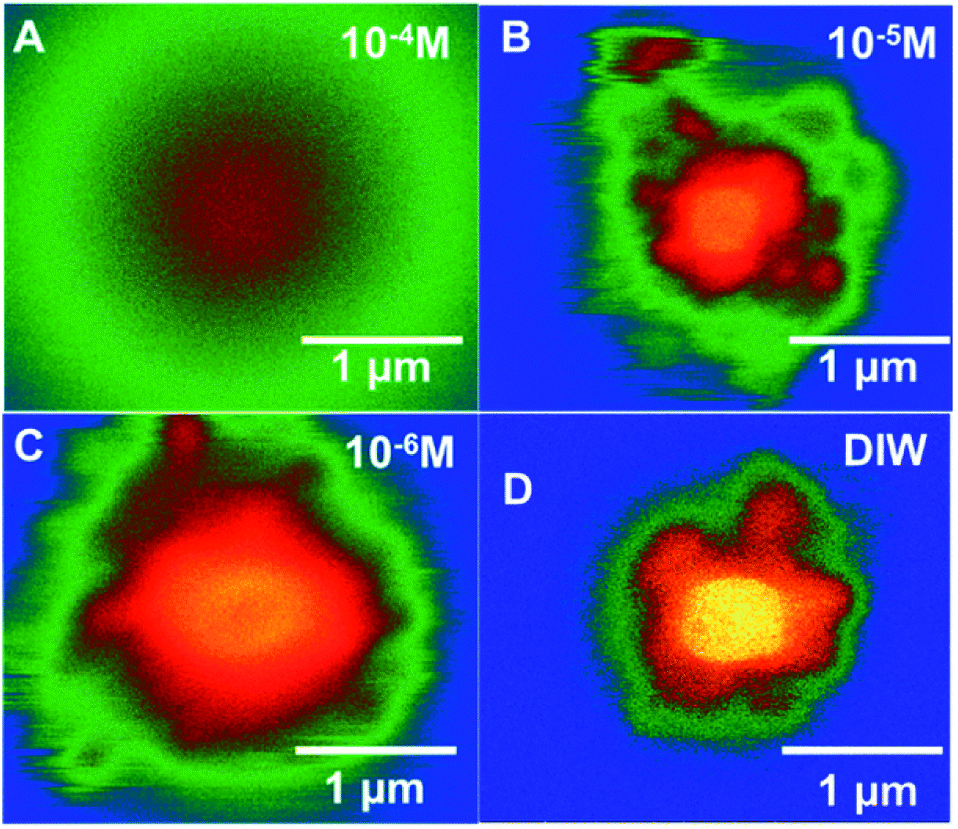 | ||
| Fig. 7 Colourized/heat mapped SEM-BSE images after 7 min of irradiation of ammonium uranyl carbonate in DI water and with three Br− concentrations. | ||
In Fig. 7, colourised/heat SEM-BSE images of the solutions with the different bromide solutions are all shown at approximately the same time of about 7 minutes of irradiation. The intensity of the image has been related to the concentration of U-peroxide. These images show, perhaps more clearly than the plot in Fig. 6, how the bromide influenced the precipitation phenomena. As Br− increased, there was a reduction in the U-peroxide phase concentration. This is in agreement with the model where the steady state concentration of H2O2 is impacted by Br−.
The addition of milli-molar amounts of Br− is commonly used to protect H2 from scavenging by OH radicals in reaction. The overall impact of Br−, as well as other halides (I− and Cl−), is reaction with ˙OH radical (see below). The rate constants for this forward reaction with Br− are faster than those for Cl−, at 1.1 × 10¹⁰ M−1 s−1 against 4.3 × 10⁹ M−1 s−1. However, the reverse reactions, are considerably slower for ˙BrOH− (3.3 × 10⁷ M−1 s−1) than for ˙ClOH− (4.3 × 10⁹ M−1 s−1).20
| ˙OH + Br− → ˙BrOH− |
| ˙BrOH− → ˙Br + OH− |
| ˙BrOH− + Br− → ˙Br2− + OH− |
Additional reactions of the ˙Br2− species, results in the formation of Br3−. Furthermore, additional Br radical species reactions in the radiolytic system tend to regenerate Br−. Altogether, these reactions result in Br− becoming a much more potent scavenger of ˙OH radical even at much lower effective concentrations than Cl−. The eaq− and ˙H will also react with Br3− and ˙Br2−, resulting in the formation of H+ and Br−. Knowledge of the bromide concentration in contacting solutions is very important for understanding and predicting its potential impact on the radiolytic system. It is also possible that radioiodine from nuclear fission may be present in the wastes debris at ∼10−4 M. Experiments by Bauhn et al. 238Pu-laced solutions containing solid UO2, do not agree with these results and models.21 Their results showed that 1 mM bromide-bearing solutions had no effect on H2O2 production.
According to our radiolytic model,‡ as the Br− content in the solution increased, H2O2 production decreased and H2 production increased (see Fig. 8). In this instance, the radiation source is modelled as emerging from a surface, and the concentrations represent those distant from the radiation source, such that the solution is no longer directly exposed to α-particles.
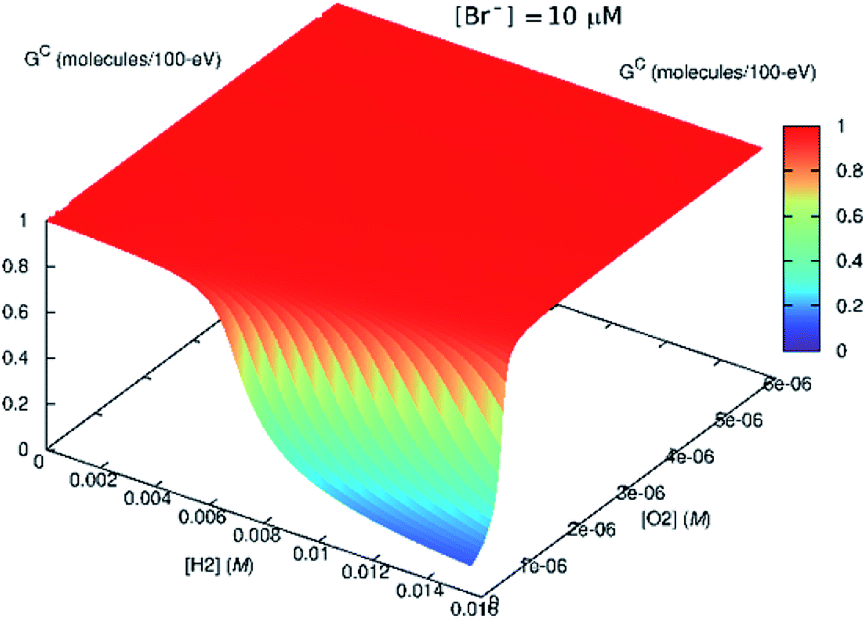 | ||
| Fig. 8 Effect of bromide ([Br−] = 10 μM) on the steady-state Gc value. If H2 is present in the system initially, the scavenging effect of Br− diminishes. | ||
This might imply that the building H2 concentration should affect further radiolysis and then prevent destruction of H2O2 despite the presence of bromide. In the in situ LC experiments, we do not see any delay production in H2O2. This is because there is no H2 at the start of the irradiation. If H2 had been present initially, this reversing effect, should have occurred.
In situ oxidative corrosion of UO2
Dissolution of particles of UO2 was initially investigated by irradiating the UO2 particles in solution to establish the conditions for both preserving the cells and obtaining suitable images that could be analysed. Similar work has been performed by Traboulsi et al. using He+ ions22 and with direct addition of H2O2.23 These experiments resulted in the formation or meta-studtite from UO2 corrosion.In Fig. 9, UO2 particles in DI water were irradiated continuously over a fixed area (indicated by the red square in Fig. 9b). The production of H2O2 from irradiation resulted in the dissolution of a portion of the UO2 and the precipitation of a uranyl oxide phase outside of the irradiated region over the course of several minutes. No significant changes were noted in the size of the initial UO2 particles because of their relatively large mass. Although it was not possible to identify directly the phase of the newly-formed uranium-bearing particles, it is likely (based on particle morphology and knowledge of H2O2 reaction with U) that these were the uranyl oxide peroxide phase studtite. The location of the studtite phase outside of the irradiated region points to the diffusion of H2O2 and the importance of considering this effect during irradiation of solutions in the electron microscope cells. The CASINO electron scattering model for 15 keV electrons shows that very little electron scattering occurs >3 μm outside the irradiated region (see Fig. 3), supporting the contention that the material found outside the irradiated region is from the diffusion of H2O2 and resulting reaction with U in solution.
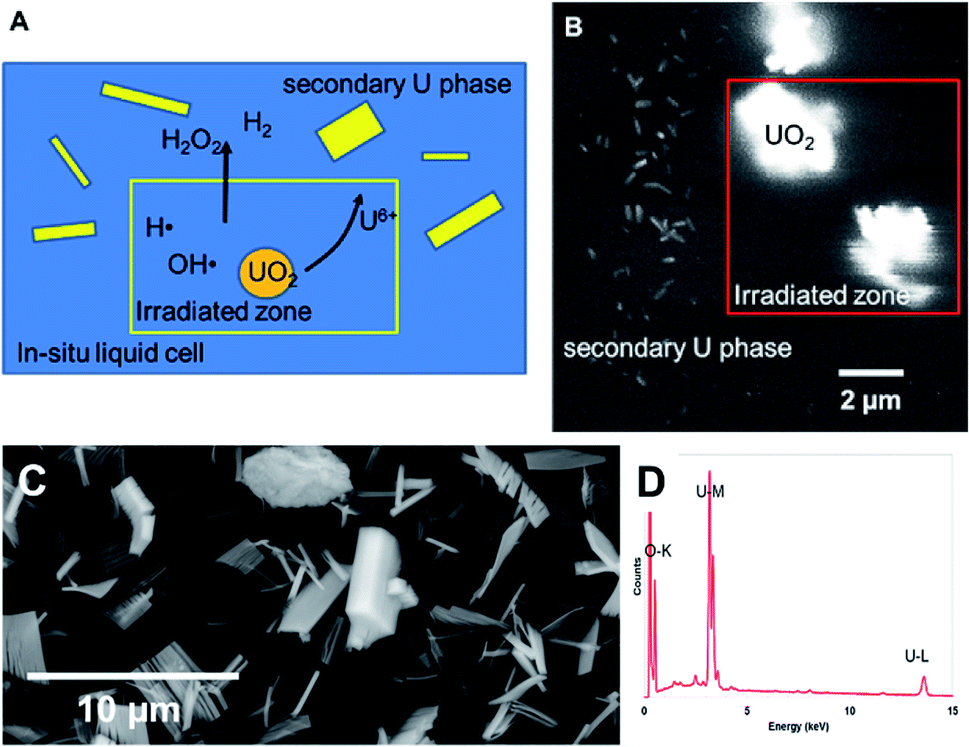 | ||
| Fig. 9 (A) Schematic showing the effect of localised electron irradiation on a solution containing UO2 particles. (B) SEM-BSE image showing the formation of studtite during irradiation of UO2 particles in solution. The irradiated zone is marked within the red outlined box. (C) SEM image of studtite formed from the alteration of irradiated U fuel in the K-Basins at the Hanford site, Washington, USA. (D) X-Ray energy dispersive analysis of the phase. | ||
Nuclear materials, when contacted with water, can induce radiolysis in the surrounding solution from their radioactive emissions. Uraninite (UO2) is thermodynamically unstable under oxidizing conditions and combined with the alpha (α)-radiation field drive oxidative dissolution.24–27 The oxidation process is controlled by the concentration of H2O2; where the high oxidation potential will lead to the formation of soluble UO2(aq)2+.28 In the presence of high concentrations of H2O2, a secondary phase studtite [(UO2)(O2)(H2O)2·2H2O] may precipitate.29–32 Indeed, studtite has been identified on the surface of spent UO2 nuclear fuel.33–36 Studtite is known to be stable in H2O2 containing environments.37 The recent studies by Bauhn et al. that show 1 mM bromide did not impact H2O2 production in an alpha-dominated environment21 may be due the spatial location of the radiation field. We show that studtite was formed outside of the irradiated region in agreement with the findings of Traboulsi et al.22 for He+ ions. It is unknown if direct irradiation would similarly allow the crystallisation of the secondary phase.
Conclusions
In situ LC electron microscopy was used to examine effect of different bromide concentrations on the production of H2O2 by monitoring precipitation of a U-peroxide phases during the irradiation. We were able to corroborate a radiolysis model for H2O2 generation by observing a reduction in H2O2 concentration with added bromide; although, this is in disagreement with the work of Bauhn et al.21 The study also points to the role of radiolysis in the electron microscope that can easily overwhelm a chemical system. However, with careful selection of beam current, beam energy, and dose, it is possible to conduct useful experiments with these types of liquid cell. We have shown that although it is possible to investigate radiolytic phenomena with the in situ LC, models need to include the diffusion of species to account for the nature of species migration in the cell and not just the steady state conditions under homogeneous irradiation.Conflicts of interest
There are no conflicts to declare.Acknowledgements
This research was performed by the Pacific Northwest National Laboratory (PNNL). Experiments with UO2 were conducted with support from the U.S. Department of Energy (DOE) Office of Nuclear Energy, Used Fuel Disposition (UFD) program. We thank S. K. Fiskum for the sample from the K-Basins at Hanford. Experiments with KBr solutions were conducted under the Nuclear Process Science Initiative (NPSI), a PNNL Laboratory Directed Research and Development (LDRD) project. PNNL is operated for the DOE by Battelle under contract DE-AC05-76RL01830.Notes and references
- N. de Jonge and F. M. Ross, Electron microscopy of specimens in liquid, Nat. Nanotechnol., 2011, 6(11), 695–704 CrossRef PubMed.
- J. E. Evans, et al., Controlled Growth of Nanoparticles from Solution with In Situ Liquid Transmission Electron Microscopy, Nano Lett., 2011, 11(7), 2809–2813 CrossRef PubMed.
- P. Abellan, et al., The formation of cerium(III) hydroxide nanoparticles by a radiation mediated increase in local pH, RSC Adv., 2017, 7(7), 3831–3837 RSC.
- N. M. Schneider, et al., Electron–Water Interactions and Implications for Liquid Cell Electron Microscopy, J. Phys. Chem. Lett., 2014, 118(38), 22373–22382 CrossRef.
- B. C. Garrett, The role of water in electron-initiated processes and radical chemistry: issues and scientific advances, Chem. Rev., 2005, 105, 355–390 CrossRef PubMed.
- J. J. De Yoreo, et al., Crystallization by particle attachment in synthetic, biogenic, and geologic environments, Science, 2015, 349(6247) DOI:10.1126/science.aaa6760.
- D. Li, et al., Direction-Specific Interactions Control Crystal Growth by Oriented Attachment, Science, 2012, 336(6084), 1014–1018 CrossRef PubMed.
- T. J. Woehl, et al., Direct in situ determination of the mechanisms controlling nanoparticle nucleation and growth, ACS Nano, 2012, 6(10), 8599–8610 CrossRef PubMed.
- D. R. G. Mitchell and B. Schaffer, Scripting-customised microscopy tools for Digital Micrograph™, Ultramicroscopy, 2005, 103(4), 319–332 CrossRef PubMed.
- P. Hovington, D. Drouin and R. Gauvin, CASINO: a new monte carlo code in C language for electron beam interaction—part I: description of the program, Scanning, 1997, 19(1), 1–14 CrossRef.
- R. Browning, et al., Low-energy electron/atom elastic scattering cross sections from 0.1–30 keV, Scanning, 1995, 17(4), 250–253 CrossRef.
- D. W. Shoesmith and S. Sunder, The prediction of nuclear fuel (UO2) dissolution rates under waste disposal conditions, J. Nucl. Mater., 1992, 190, 20–35 CrossRef.
- N. Liu, et al., Modelling the radiolytic corrosion of α-doped UO2 and spent nuclear fuel, J. Nucl. Mater., 2017, 494, 87–94 CrossRef.
- R. S. Wittman, et al., Conditions for critical effects in the mass action kinetics equations for water radiolysis, J. Phys. Chem. A, 2014, 118(51), 12105–12110 CrossRef PubMed.
- A. J. Elliot and D. R. McCracken, Computer modelling of the radiolysis in an aqueous lithium salt blanket: Suppression of radiolysis by addition of hydrogen, Fusion Eng. Des., 1990, 13(1), 21–27 CrossRef.
- S. L. Butarbutar, et al., Self-radiolysis of tritiated water. 2. Density dependence of the yields of primary species formed in the radiolysis of supercritical water by tritium [small beta]-particles at 400 [degree]C, RSC Adv., 2014, 4(44), 22980–22988 RSC.
- S. Mustaree, et al., Self-radiolysis of tritiated water. 3. The [radical dot]OH scavenging effect of bromide ions on the yield of H2O2 in the radiolysis of water by 60Co [gamma]-rays and tritium [small beta]-particles at room temperature, RSC Adv., 2014, 4(82), 43572–43581 RSC.
- G. V. Buxton and Q. G. Mulazzani, On the hydrolysis of iodine in alkaline solution: a radiation chemical study, Radiat. Phys. Chem., 2007, 76(6), 932–940 CrossRef.
- F. Nielsen, K. Lundahl and M. Jonsson, Simulations of H2O2 concentration profiles in the water surrounding spent nuclear fuel, J. Nucl. Mater., 2008, 372(1), 32–35 CrossRef.
- J. A. LaVerne, M. R. Ryan and T. Mu, Hydrogen production in the radiolysis of bromide solutions, Radiat. Phys. Chem., 2009, 78(12), 1148–1152 CrossRef.
- L. Bauhn, et al., The Effect of Bromide on Oxygen Yields in Homogeneous α-Radiolysis, MRS Adv., 2017, 2(13), 711–716 CrossRef.
- A. Traboulsi, et al., Radiolytic corrosion of uranium dioxide induced by He2+ localized irradiation of water: role of the produced H2O2 distance, J. Nucl. Mater., 2015, 467(part 2), 832–839 CrossRef.
- F. Clarens, et al., Formation of Studtite during the Oxidative Dissolution of UO2 by Hydrogen Peroxide: A SFM Study, Environ. Sci. Technol., 2004, 38(24), 6656–6661 CrossRef PubMed.
- D. J. Wronkiewicz, et al., Ten-year results from unsaturated drip tests with UO2 at 90 °C: implications for the corrosion of spent nuclear fuel, J. Nucl. Mater., 1996, 238(1), 78–95 CrossRef.
- R. C. Ewing, Long-term storage of spent nuclear fuel, Nat. Mater., 2015, 14(3), 252–257 CrossRef PubMed.
- D. J. Wronkiewicz and E. Buck, Uranium mineralogy and the geologic disposal of spent nuclear fuel, Rev. Mineral. Geochem., 1999, 38(1), 475–497 Search PubMed.
- M. Amme, et al., Combined effects of Fe(II) and oxidizing radiolysis products on UO2 and PuO2 dissolution in a system containing solid UO2 and PuO2, J. Nucl. Mater., 2012, 430(1–3), 1–5 CrossRef.
- I. Grenthe, et al., Uranium, in The chemistry of the actinide and transactinide elements, Springer Netherlands, 2008, pp. 253–698 Search PubMed.
- P. C. Burns and K.-A. Hughes, Studtite, [(UO2)(O2)(H2O)2](H2O)2: the first structure of a peroxide mineral, Am. Mineral., 2003, 88(7), 1165–1168 CrossRef.
- K.-A. H. Kubatko, et al., Stability of Peroxide-Containing Uranyl Minerals, Science, 2003, 302(5648), 1191–1193 CrossRef PubMed.
- P. F. Weck, E. Kim and E. C. Buck, On the mechanical stability of uranyl peroxide hydrates: implications for nuclear fuel degradation, RSC Adv., 2015, 5(96), 79090–79097 RSC.
- C. Mallon, et al., Physical Characterization and Reactivity of the Uranyl Peroxide [UO2(η2-O2)(H2O)2]·2H2O: Implications for Storage of Spent Nuclear Fuels, Inorg. Chem., 2012, 51(15), 8509–8515 CrossRef PubMed.
- B. D. Hanson, et al., Corrosion of commercial spent nuclear fuel. 1. Formation of studtite and metastudtite, Radiochim. Acta, 2005, 159 Search PubMed.
- B. McNamara, et al., Corrosion of commercial spent nuclear fuel. 2. Radiochemical analyses of metastudtite and leachates, Radiochim. Acta, 2005, 169 Search PubMed.
- T. Z. Forbes, et al., Alteration of dehydrated schoepite and soddyite to studtite, (UO2)(O-2)(H2O)(2)(H2O)(2), Am. Mineral., 2011, 96(1), 202–206 CrossRef.
- C. R. Armstrong, et al., Uranyl peroxide enhanced nuclear fuel corrosion in seawater, Proc. Natl. Acad. Sci. U. S. A., 2012, 109(6), 1874–1877 CrossRef PubMed.
- G. Sattonnay, et al., Alpha-radiolysis effects on UO2 alteration in water, J. Nucl. Mater., 2001, 288(1), 11–19 CrossRef.
Footnotes |
| † Electronic supplementary information (ESI) available. See DOI: 10.1039/c8ra01706a |
| ‡ The radiolysis model is described in the ESI section and in several publically available reports referenced in the ESI. |
| § The method for determining contrast intensity of the images is discussed in the ESI. |
| This journal is © The Royal Society of Chemistry 2018 |