 Open Access Article
Effect of polysiloxane encapsulation material compositions on emission behaviour and stabilities of perylene dyes†
Nils Steinbrücka,
Martin Könemannb and
Guido Kickelbick *a
*a
aSaarland University, Inorganic Solid State Chemistry, Campus Building C4 1, 66123 Saarbrücken, Germany. E-mail: guido.kickelbick@uni-saarland.de
bBASF SE, 67056 Ludwigshafen, Germany
First published on 17th May 2018
Abstract
The replacement of inorganic conversion dyes with their organic counterparts in LED application bears a large potential for the reduction of rare earth elements in these devices. A major challenge of this substitution is the emission and stability of organic dyes, which is more sensitive to the composition of the polymer matrix they are embedded in than inorganic systems. In this study we systematically investigated the influence of the composition and structure of a low refractive index (LRI) polydimethylsiloxane (PDMS) and a high refractive index (HRI) polymethylphenysiloxane (PMPS) based encapsulation material on the optical properties of two different embedded perylene diimide dyes. Both dyes show low solubility in the PDMS matrix, which also fosters the heat- or light-induced degradation of the incorporated dyes. Contrary phenyl containing polysiloxane encapsulation materials enhance dye solubility, improve quantum yields, and promote heat and radiation resistance. Bulky N-aryl substituents at the dye structure decrease the probability of dye–dye interaction and increase the absolute quantum yields additionally. Increased photostability and no leaching was observed when the dye was covalently attached to the polymer matrix. Additionally covalent bonding to and improved solubility of the organic dyes in the polysiloxanes allow for a solvent free processing of such dye-matrix combinations. In conclusion a good matching between the matrix and the dye is crucial for a substitution of inorganic conversion dyes by organic ones in LED devices.
Introduction
Most of the commonly used phosphors in LED applications consist of inorganic oxides doped with rare earth ions. Typical examples are Y3Al5O12:Ce3+, Lu3Al5O12:Ce3+, CaAlSiN3:Eu2+, (Ba,SrCa)2Si5N8:Eu2+ and β-sialon:Eu2+.1–9 Due to the geopolitical dependence of the supply of rare earth compounds and the high prices of those materials, alternative organic compounds are an object of recent research projects.10–13 The limited chemical and physical stability in LED applications is a major challenge of organic phosphors. High temperatures, oxygen, moisture and the continuous exposure to short wavelength visible light radiation promotes chemical and structural changes in organic dyes.10–13 Because of the low heat and photostability of most of the common dyes, the integration in high power LEDs requires specific precautions.10–14 Remote applications, in which the dye is embedded in a polymer matrix that is located in distance to the excitation light source and thus decomposition processes are minimized, are already commercially available.15–18 But a direct integration of the dye into the encapsulation material is preferred due to light performance and efficiency. The primary used epoxy based encapsulation materials show a heat- or light-initiated change in optical properties, which prevented their use in high power LEDs.19,20 Polysiloxane based encapsulation materials reveal a much better heat stability, high transparency, and tunable refractive indices by side group substitution.20,21 The chemical inertness of this polymer class in combination with the possibility for a covalent incorporation of an organic fluorescence dye makes them to an excellent material for an optimization focusing on dye stability. Polysiloxane matrices for LED applications can be categorized in two main groups: low (LRI) and high refractive index polymers (HRI).22 The main difference in their chemical composition is the quantity of phenylmethyl- or diphenylsiloxane units, which increase the refractive index due to the much higher electron density.23,24 The influence of the polysiloxane structure on the fluorescence properties of a matrix incorporated dye system is not studied yet. One of the most commonly used fluorescence dyes is the commercial available, perylene-based Lumogen® F Red 305 dye by BASF SE.25–29 This dye can only be non-covalently embedded in the polysiloxane matrix. In our study we present the synthesis of a new dye, which allows a covalent attachment to the polymer matrix. We investigated the influence of the matrix structure on quantum yields, heat- and photostability, as well as the crosslinking behaviour of polysiloxane matrices. The obtained results should lead to an optimized dye incorporated emitting encapsulation system for LED application.Experimental
Materials
Two commercially available polysiloxane matrices were used in our study: ShinEtsu KJR9022E [Shin(1)], which is a low refractive index (LRI) polydimethylsiloxane (PDMS), and Dow Corning OE6630 [Dow(1)], which is a high refractive index (HRI) polymethylphenylsiloxane (PMPS) (Scheme 1). They were used as received. Both are two component polymers containing Si–H and Si–vinyl groups, respectively. The curing process is based on a platinum catalysed hydrosilylation reaction. After crosslinking applying standard curing conditions the polymers revealed high transparency and high temperature stability up to temperatures above 200 °C. The main differences in the structure of the two systems are the phenyl groups, which are responsible for the increased refractive index of the Dow(1) polymer. In addition to the phenylmethylsiloxane units, diphenylsiloxane groups are a structural motive in the Dow(1) polymer. All components can additionally contain unknown additives like catalyst inhibitors, coupling or crosslinking agents.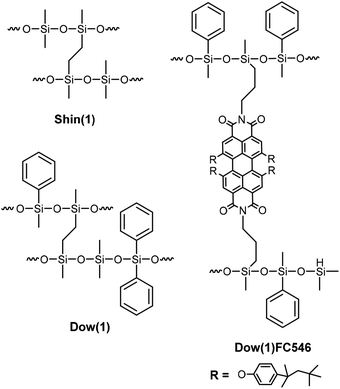 | ||
| Scheme 1 Scheme of possible structures of the cured Dow(1) and Shin(1) matrices and the covalent bonded FC546 dye in the Dow(1) matrix. | ||
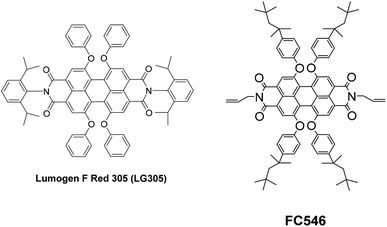
BASF SE provided the two organic dyes that were used in our studies Lumogen® F Red 305 (LG305) and FC546 (Scheme 2).30 The synthesis of FC546 is reported in the ESI,† Lumogen® F Red 305 (LG305) is a commercially available dye. Both dye structures are based on a perylene-3,4,9,10-tetracarboxylic acid diimide framework. LG305 contains four phenoxy units in bay position and N,N′-2,6-diisopropylphenyl units that lead to an increased solubility, a very high quantum yield of 1, and emission maxima around 600 nm. The best known common solvent for this dye is toluene.31 Covalent integration of LG305 in polysiloxane matrices can be excluded due to the lack of reactive groups. The novel dye FC546 contains N,N′-diallyl units which allow a covalent integration into the polysiloxane network via hydrosilylation. Due to the missing N,N′-2,6-diisopropylphenyl units, the solubility in toluene is decreased compared to LG305. Four 2,4,4-trimethylpentan-2-yl phenoxy units in bay position were introduced to offset this decrease. It is known that addition of bulky substituents to the imide position can change the intermolecular interactions by maintaining the perylene core's photo physical properties and improving the absolute quantum yield massively.32 Additionally a non-radiative deactivation caused by a rotation vibration of the N–R-bond is prevented,14 which also enhances the quantum yield. The missing bulky substituents on the FC546 molecule could lead to a decrease of quantum yield due to the mentioned reasons. At the same time, the covalent bonding of the dye to the polysiloxane structure could reduce the π-stacking probability by molecular separation.
Instrumentation
Fourier transformed infrared spectra (FTIR) were recorded in total reflectance mode on a Vertex 70 spectrometer (Bruker, USA) from 4500–400 cm−1 with a 4 nm increment and by averaging 10 scans. The absolute photoluminescence quantum yields and the emission spectra were measured in a Quantaurus C11347-11 integration sphere setup (Hamamatsu Photonics, Japan) with a xenon high-pressure lamp and a multichannel analyzer at 450 nm excitation wavelength. UV-VIS transmission and reflectance measurements were performed on a Lambda 750 instrument (Perkin Elmer Inc., USA) equipped with a 100 mm integration sphere from 700–320 nm with a 2 nm increment and 0.2 s integration time in transmission or reflectance mode. Fluorescence spectroscopy was performed applying a FluoroMax 4 Spectrofluorometer (Horiba Scientific, Japan) with an excitation wavelength of 450 nm and an emission wavelength of 630 nm. A fibre coupled, collimator equipped UHP-T-LED 450 nm wavelength system with 780 mW was used as irradiation source for photobleaching experiments (Prizmatix Ltd., Israel). NMR spectra were recorded with an Avance III 300 MHz spectrometer (Bruker, USA) applying a frequency of 300.13 MHz for 1H NMR-spectra. For the visualization of sub millimetre structures an Axioskop 50 transmitted light/fluorescence microscope with an AxioCam MRc (1388 × 1040 pixel) was used. Sample thickness was determined with a FMD12TB precision dial gauge (Käfer Messuhrenfabrik GmbH & Co. KG, Germany) with an accuracy of 1 μm.Preparation and sample denotation
The two components of the different polysiloxane were premixed as specified by the respective manufacturer (Dow Corning OE6630: 4/1; ShinEtsu KJR9022E: 10/1). A stock solution was used (0.1 wt%, CHCl3) to add a defined amount of dye to the mixtures. Physical dissolved gases and solvent were removed under reduced pressure (4 mbar, >30 min) before casting the samples into PTFE molds (30 × 10 × 1 mm). The mixtures were cured for 4 h at 150 °C. The resulting mean sample thickness is 1.11 ± 0.09 mm. The samples are denoted by the polymer and dye type abbreviations and the final dye concentration in ppm by weight (Table 1). Sample concentrations of 100, 250, 500, 750, 1000, 1500, 2000, and 3000 ppm dye in the matrix were prepared for each polymer.| Sample designation | Polymer | Dye |
|---|---|---|
| a X is the dye concentration by weight with 100, 250, 500, 750, 1000, 1500, 2000 and 3000 ppm. | ||
| Dow(1)LG305-X | Dow Corning OE6630 | Lumogen® F Rot 305 |
| Dow(1)FC546-X | Dow Corning OE6630 | FC546 |
| Shin(1)LG305-X | ShinEtsu KJR9022E | Lumogen® F Rot 305 |
| Shin(1)FC546-X | ShinEtsu KJR9022E | FC546 |
Swelling and leaching behaviour
Investigations of the degree of crosslinking and dye mobility in the cured polymers were performed in swelling experiments. If there is any influence of the crosslinking behaviour due to the dye molecules the swelling behaviour should be different compared to the pristine matrix. In the swelling experiments, a weighted, small sample was placed in toluene for 24 h at room temperature. Excess of surface adsorbed solvent was removed by a filter paper before mass determination. The degree of swelling (SD) was calculated applying eqn (1).
 | (1) |
Quantum yield (QE) measurement and self-absorption coefficient (SA-coefficient) calculation
For a quantification of the dye stability and reabsorption phenomena absolute quantum yield measurements were implemented. An alteration in quantum yield due to a physical treatment should be directly related to the dye concentration. The self-absorption coefficient a can be calculated from the emission spectra recorded with the photoluminescence quantum yield measurement.35,36 It can be used for quantum yield correction procedure and as a measure for self-absorption effects. From raw spectral data the sum of the product of photon count rate and the wavelength E are calculated applying eqn (2).| E = ∑E(λ)Δλ | (2) |
The quantum yield is calculated from eqn (3).
 | (3) |
 | (4) |
The self-absorption coefficient a is calculated by the ratio of the areas of the emission spectra of a regular sample Fsample and a very low concentrated sample with virtually zero self-absorption F0 (15 ppm dye by weight) using eqn (5).
 | (5) |
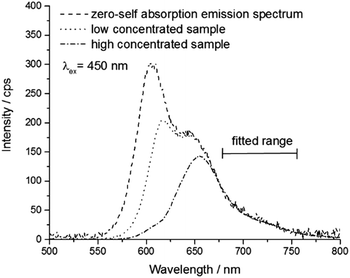
The spectra Fsample are scaled to match the spectrum F0 that is not effected by self-absorption. The scaling is linked to a fitting of the spectra at longer wavelength and leads to a normalization in an area, which is not influenced by self-absorption (Fig. 1). The fit quality was verified by Pearson's chi squared test.
Heat and photostability experiments
Long-time stability of and matrix influence to the different dyes was examined after the main curing procedure by heat and irradiation exposure experiments to simulate the operation conditions in high performance LED applications. The samples were heat treated for 48 h and another 72 h at 200 °C (summed up 120 h). After every heating step the absolute quantum yield was measured. Despite the curing for 4 h at 150 °C a post-curing process was initialized by the additional heat treatment. Therefore, the samples got more rigid due to a higher crosslinking density after the main curing procedure. For photostability experiments a mask sample (5 × 7 mm) with a dye concentration of 100 ppm was fixed to the UV-VIS sample holder and light was exposed under air or nitrogen applying a 450 nm LED with 800 W cm−2. Exposure was carried out for at least 60 h or until a decrease of absorbance of at least 50% was observed. The absorbance was determined by UV-VIS spectroscopy with an integration sphere setup in transmission mode periodically.Results and discussion
The two perylene dyes were incorporated in two different cured polysiloxane matrices to investigate the influence of the matrix on the stability and optical properties of the dyes. Dow(1) is a phenyl containing HRI PMPS and Shin(1) is a non-phenyl containing LRI PDMS type polymer, which are regularly used as encapsulation materials of high performance LEDs. Both polymeric systems were used as received. The two components containing Si–H and Si–vinyl groups were mixed and thermally cured by platinum catalysed hydrosilylation. LG305 is a commercially available perylene based dye and not suitable for a covalent inclusion in the matrix. FC546 was synthesized with N-allyl groups to force a covalent attachment to the polymer structure by hydrosilylation with Si–H groups in the polymer backbone.Dye incorporation into the matrix was carried out by mixing the polymer components according to the suppliers' specifications and addition of a stock solution of a chosen dye concentration between 15 and 3000 ppm by weight. This covers a range in which concentration quenching effects can occur. Before curing at 150 °C for 4 h the mixtures were degassed, the solvent was removed by reduced pressure, and the samples were casted in Teflon molds. After the curing procedure, the samples were cut into pieces for the different experiments and measurements (Fig. 2).
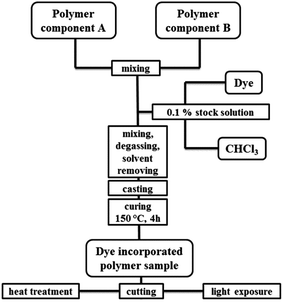 | ||
| Fig. 2 Schematic preparation process of dye incorporated polysiloxane samples from two components and a dye containing chloroform stock solution. | ||
Fluorescence spectroscopy of dilute solution
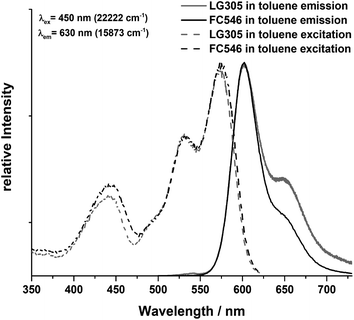
The fluorescence of the two pure dyes was determined in toluene to obtain a qualitative comparison of excitation and emission maxima. The emission as well as the excitation spectra of LG305 and FC546 in toluene are similar referring to the location of the maxima (Fig. 3). The emission maximum is located at 604 nm (16![[thin space (1/6-em)]](https://www.rsc.org/images/entities/char_2009.gif) 556 cm−1) with an excitation wavelength of 450 nm (22
556 cm−1) with an excitation wavelength of 450 nm (22![[thin space (1/6-em)]](https://www.rsc.org/images/entities/char_2009.gif) 222 cm−1). The excitation maximum is located at 575 nm (17
222 cm−1). The excitation maximum is located at 575 nm (17![[thin space (1/6-em)]](https://www.rsc.org/images/entities/char_2009.gif) 391 cm−1) with an emission wavelength of 630 nm (15
391 cm−1) with an emission wavelength of 630 nm (15![[thin space (1/6-em)]](https://www.rsc.org/images/entities/char_2009.gif) 873 cm−1). The third local excitation maximum is detected at 444 nm (22522 cm−1) which is the most important one concerning LED applications, due to the 450 nm emission wavelength of the blue LED chip. It is caused by the lateral substituents on the perylene core and is not detectable in molecules without bay substituents.13
873 cm−1). The third local excitation maximum is detected at 444 nm (22522 cm−1) which is the most important one concerning LED applications, due to the 450 nm emission wavelength of the blue LED chip. It is caused by the lateral substituents on the perylene core and is not detectable in molecules without bay substituents.13
Solubility
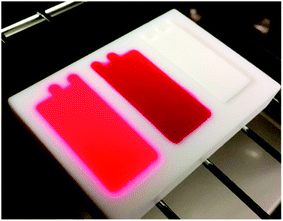
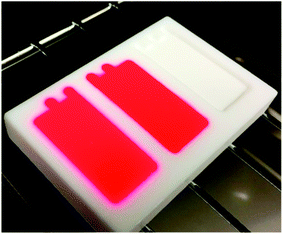
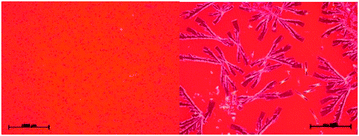
The two dyes were incorporated into the matrices by adding a chloroform stock solution to the premixed polymer components. After removing the solvent from the prepared but still liquid polymer mixtures, the dye precipitated in all samples with a concentration ≥750 ppm of the Shin(1) series independent of the used dye. The casted mixtures turned dark red and opaque, while the Dow(1) mixtures remained transparent and bright red without any visible precipitation (Fig. 4). Due to its structures the perylene diimide based dyes were highly soluble in the more phenyl groups containing Dow(1) mixture, most likely due to the ability of π–π-stacking interactions. The solubility in the non-phenyl containing Shin(1) matrix is very low. After curing at 150 °C for 4 h the Shin(1) series of both dyes showed a significant change in colour from dark red to bright red for samples with a concentration ≥750 ppm. The colour of the Dow(1) sample did not change (Fig. 5), which can be explained by the high curing temperatures resulting in an increased solubility of the dyes in the Shin(1) matrix.Every sample was evaluated with light microscopy to investigate potential inhomogeneous distributions of the dye in the matrix. Samples of the Shin(1)LG305 series showed crystallization of the dye at concentrations ≥750 ppm after the curing process. There was no crystallization detected for all Dow(1)LG305 samples and for all samples with FC546 dye independent of the concentration. The LG305 dye was soluble in Dow(1) up to 4 wt% without any crystallization. The main reason for the prevention of crystallization of the FC546 dye in the Shin(1) matrix is most likely the covalent bonding between the molecules and the matrix. Similar to LG305, precipitation occurs for every sample with a concentration ≥750 ppm in the liquid polymer mixture. After the curing process no crystallites were detectable up to 3000 ppm. The high temperature curing process leads to an increase of dye solubility and mobility in the matrix. In addition the FC546 molecules can covalently attach to the polymer matrix by hydrosilylation, which prevents diffusion of the dye in the matrix and thus crystallization. This leads to the result, that FC546 can be incorporated into non-phenyl or phenyl containing polysiloxanes without any solvent. The covalent bonding was also verified by FTIR spectroscopy (see ESI†). An indirect prove was obtained by the leaching experiments described in the next paragraph.
A second heat treatment of the already cured samples showed the high mobility of the non-bonded LG305 in the solid matrix. The additional heat treatment at 200 °C for 120 h benefits a crystal growth process, which could be detected by light microscopy (Fig. 6). The crystallization of LG305 in the Shin(1) matrix is supported by FTIR and UV-VIS data (see related chapters).
Swelling and leaching
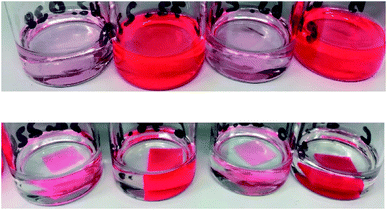
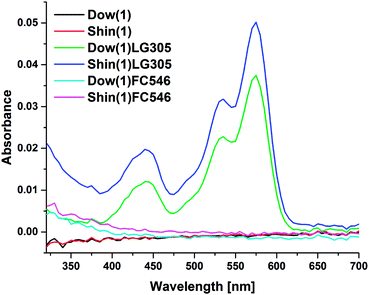
Contrary to FC546 the LG305 dye is not covalently connected to the polymer structure. During swelling studies of the samples in toluene LG305 is entirely leached out of the crosslinked matrices while FC546 completely remained in the matrix (Fig. 7).The visual impression was supported by UV-VIS spectroscopy of the diluted toluene solution after the leaching experiments. Only Shin(1)LG305 100 and Dow(1)LG305 100 show the typical dye absorption bands at 575 nm (Fig. 8). Differences in absorbance were due to variations in sample sizes which leads to deviations in the dye concentrations after leaching. As a result the leaching experiment can give an indirect indication of the covalent linkage of the dye to the matrix.
The swelling degree is a measure for the crosslinking degree of a polymer system (eqn (1)). A high swelling degree indicates a less crosslinked polymer. The high mobility of the polymer chains increase the permeation of solvent molecules. A higher crosslinked system decreases this permeation and the swelling degree, respectively. The swelling degree of the isolated Shin(1) matrix is 117.9 ± 0.9%. The Dow(1) samples show a similar swelling behaviour of 80.4 ± 1.9% irrespective of the incorporated dye molecule, which indicates a much higher crosslinked system. There was no significant change in swelling behaviour due to the dye incorporation. This means, no macroscopic influence to the crosslinking of the matrix can be detected by incorporation of the dyes (Fig. 9).
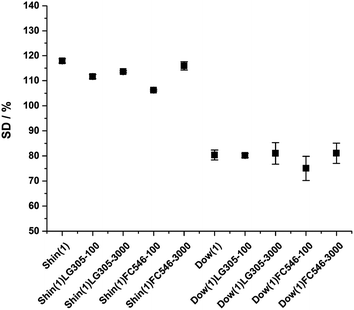 | ||
| Fig. 9 Swelling degree of Shin(1), Dow(1) and the dye incorporated samples with 100 and 3000 ppm dye concentration, respectively. | ||
ATR-FTIR spectroscopy
The FTIR spectra of the isolated components and cured matrices reveals the anticipated vibration bands for the two polysiloxane type polymers (see ESI†).37–40 The B components of the Dow(1) and Shin(1) show additional vibration bands due to the Si–H bond respectively at 2129/2159 cm−1 [ν(Si–H)] and 896/906 cm−1 [ρ(Si–H)], which disappeared after curing. The Dow Corning OE6630 spectra shows specific aromatic vibration bands due to phenyl side groups at 3049, 3072 [ν(C–H)AR]; 1490, 1430 [ν(C![[double bond, length as m-dash]](https://www.rsc.org/images/entities/char_e001.gif) C–C)AR] and 726, 694 [δ(C–H)AR] cm−1. The FTIR spectra of the polymers containing FC546 and the Dow(1)LG305 samples present no substantial differences to the isolated polymer. Heat treatment has no significant influence on the vibration spectra of these samples. The spectrum of Shin(1)LG305 3000 ppm displays an additional increase of sharp vibration bands between 1750 and 1250 cm−1. These bands can be assigned to the Lumogen® F Red 305 chemical groups at 3030, 3064 [ν(C–H)AR]; 2960, 2925 [ν(C–H)]; 1705, 1672 [ν(C
C–C)AR] and 726, 694 [δ(C–H)AR] cm−1. The FTIR spectra of the polymers containing FC546 and the Dow(1)LG305 samples present no substantial differences to the isolated polymer. Heat treatment has no significant influence on the vibration spectra of these samples. The spectrum of Shin(1)LG305 3000 ppm displays an additional increase of sharp vibration bands between 1750 and 1250 cm−1. These bands can be assigned to the Lumogen® F Red 305 chemical groups at 3030, 3064 [ν(C–H)AR]; 2960, 2925 [ν(C–H)]; 1705, 1672 [ν(C![[double bond, length as m-dash]](https://www.rsc.org/images/entities/char_e001.gif) O)]; 1583, 1485 [ν(C
O)]; 1583, 1485 [ν(C![[double bond, length as m-dash]](https://www.rsc.org/images/entities/char_e001.gif) C–C)AR]; 1407, 1338 [ν(C–N)] and 1309, 1282, 1193 [ν(C–O–C)] cm−1.28 As previously mentioned the LG305 dye precipitates in the Shin(1) polymer at concentrations ≥750 ppm. The ATR-FTIR measurement is limited in its penetration depth. The samples with 3000 ppm concentration show crystallized dye on the sample surface as well. This leads to detectable signals from dye vibrations (Fig. 10). The intensity of the vibrations increases after the heat treatment at 200 °C for 120 h. All measured spectra are part of ESI.†
C–C)AR]; 1407, 1338 [ν(C–N)] and 1309, 1282, 1193 [ν(C–O–C)] cm−1.28 As previously mentioned the LG305 dye precipitates in the Shin(1) polymer at concentrations ≥750 ppm. The ATR-FTIR measurement is limited in its penetration depth. The samples with 3000 ppm concentration show crystallized dye on the sample surface as well. This leads to detectable signals from dye vibrations (Fig. 10). The intensity of the vibrations increases after the heat treatment at 200 °C for 120 h. All measured spectra are part of ESI.†
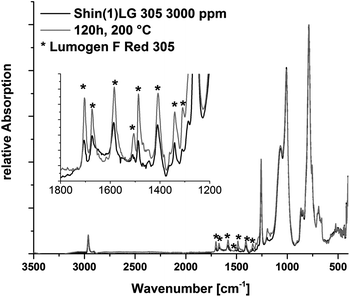 | ||
| Fig. 10 FTIR spectra of Shin(1)FC546 3000 before and after the heat treatment at 200 °C for 120 h. An increase of LG305 vibration bands occurs due to the heat treatment. | ||
UV-VIS spectroscopy
The absorption of the samples was measured by transmission UV-VIS spectroscopy. A comparison of the absorption values at 450 nm is plotted below (Fig. 11). All samples show a direct relationship between the increase of dye concentration and the increase of absorption until saturation is reached. Sample Shin(1)LG305 deviates the most from the a theoretical Lambert–Beer function calculated by eqn (6).| A = 1 − 10−εcd | (6) |
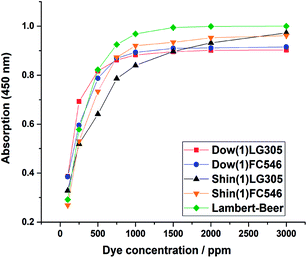 | ||
| Fig. 11 Absorption of the Dow(1)LG305, Shin(1)LG305, Shin(1)FC546, and Dow(1)FC546 concentration series. A theoretical Lambert–Beer function calculated using eqn (6) is included for reasons of comparison. | ||
Due to the saturation a concentration optimum can be determined for any dye matrix combination. For example the Dow(1)LG305 absorption is saturated at 1000 ppm, thus a higher concentration is unnecessary from the perspective of absorbance. The unexpected trend in the Shin(1)LG305 absorption can be explained by the crystallization process which changes the absorption values due to the solid phase inside the polymer matrix. This crystallization of the LG305 dye in the Shin(1) matrix can be detected by reflectance measurement as well (Fig. 12). The reflectance from 615–700 nm is increasing at concentrations larger than 750 ppm. This increase is caused by the reflectance of the crystalline dye, which generates a strong reflectance edge in this area of the VIS spectrum. This is verified by the reflectance spectrum of the isolated pure dye.
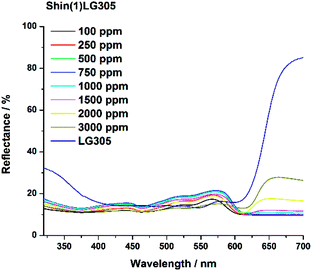 | ||
| Fig. 12 Reflectance spectra of the Shin(1)LG305 concentration series and the isolated dye as solid powder. | ||
Despite the high absorption values an efficiency increase of solar cell concentrators was determined in solution for Lumogen® F Red 305.41 Because total LED efficiency also depends on emission efficiency, absolute quantum yield measurement were performed as well. All UV-VIS spectra are part of the ESI.†
QE and SA-coefficient
Quantum yield was measured from all untreated samples, after 48 and 120 h heat treatment at 200 °C and after the light exposure experiments (Fig. 13). The incorporated dyes in the Dow(1) polymer reveal much higher quantum yields compared to the Shin(1) system. The quantum yield of the Dow(1)LG305 series is 1 and not influenced by an increase of dye concentration. An absolute absence of quenching effects due to the matrix dye combination is observed. A similar result is known for LG305 in a PMMA matrix for concentrations smaller than 1600 ppm.36 The Dow(1)FC546 series quantum yield increases slightly from 0.93 to 0.97 at 100 and 250 ppm then decreases slowly but constant to 0.77 at 3000 ppm. The Shin(1)LG305 series quantum yield also increases slightly from 0.90 to 0.92 at 100 and 250 ppm then decreases fast to 0.26 at 3000 ppm. The Shin(1)FC546 series quantum yield is decreasing very fast from 0.93 to 0.37 at 100 and 3000 ppm samples, but it shows higher quantum yields at 2000 and 3000 ppm than Shin(1)LG305 samples with similar concentrations.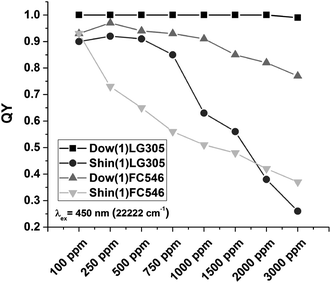 | ||
| Fig. 13 Absolute quantum yield of the Dow(1)LG305, Shin(1)LG305, Shin(1)FC546, and Dow(1)FC546 concentration series. | ||
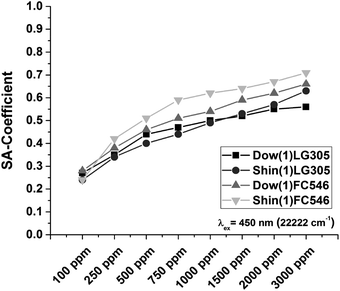
The calculated SA-coefficient is increasing with the increase of concentration for all samples (Fig. 14). The lowest concentrated samples with 100 ppm dye are starting with the same SA-coefficient for each matrix.
 | ||
| Fig. 14 Calculated SA-coefficient of the Dow(1)LG305, Shin(1)LG305, Shin(1)FC546, and Dow(1)FC546 concentration series (eqn (5)). | ||
The SA-coefficient of the Dow(1)LG305 and the Dow(1)FC546 100 samples are 0.27 and 0.28. The SA-coefficient of the Shin(1)LG305 and the Shin(1)FC546 100 samples are 0.24, respectively. These values are much lower compared to LG305 in PMMA.36 The largest increase of the SA-coefficient with increasing dye concentration is observed for the Shin(1)FC546 series. At 3000 ppm dye concentration, the SA-coefficient is 0.71. The Dow(1)LG305 3000 sample shows an enlargement up to 0.56. The Dow(1) polymer contains a high number of aromatic phenyl units able to interact with the planar perylene core of the dyes. As a consequence a sterically blocking of the dye–dye π–π-stacking is conceivable.32,42 Additionally the structure of the LG305 dye is sterically affecting the π–π-stacking due to its bulky imide substituents.14,32 Hence, a high quantum yield independent of the dye concentration is observed. The Shin(1) polymer contains no aromatic units. Its weak solvation due to its structure benefits a dye–dye interaction and causes crystallization. The quantum yield of the Shin(1)LG305 series is lowered by this interaction and starts decreasing massively with the crystallization process at concentration of 750 ppm. A decrease of quantum yield by concentration for the FC546 series is caused by the dye structure. Certainly the missing bulky imide substituents benefit a quenching effect due to dye–dye interactions.32 Comparable results are known for different perylene diimide compounds in PMMA.32 A sterically blocking of the dye–dye π–π-stacking due to the phenyl units of the Dow(1) structure is supported by the Dow(1)FC546 quantum yield results compared to the Shin(1)FC546 series. If the dye–dye π–π-stacking of the FC546 occurs first in the process of sample preparation a separation by covalent bonding is not necessarily probable. This is supported by the Shin(1)FC546 series quantum yield, which decreases constantly by increasing concentration in the non-heat treated samples. After heat treatment and thus a covalent connection of the FC546 dye to the matrix, the quantum yield shows not such a high concentration dependency. The samples with matrix dye combination Dow(1)LG305 in any concentration and Dow(1)FC546 100–500 ppm display the highest quantum yields and are most suitable for the application in LED devices.
Heat treatment results
In LED applications usually a post-curing process is carried out by reheating the polymer samples. After heating the samples to 200 °C for 48 h a decrease of QY occurs (Fig. 15). This indicates a direct influence of the post-curing process to the dye–dye interaction or to the structural integrity of the dye molecules.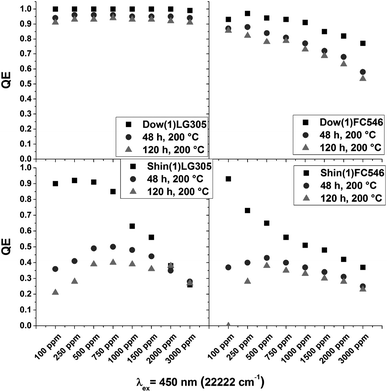 | ||
| Fig. 15 Absolute quantum yields of the Dow(1)LG305, Shin(1)LG305, Shin(1)FC546, and Dow(1)FC546 concentration series before and after a heat treatment for 48 and 120 h at 200 °C. | ||
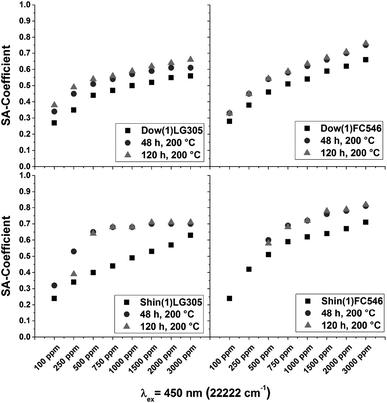
The quantum yields of the Dow(1)FC546 series decreases with an increasing dye concentration. Higher dye concentration leads to a larger and systematic decrease in quantum yield. A rearrangement of the dye molecules due to the post-curing at high temperatures is possible. Compared to the Shin(1) we do not assume a heat induced decomposition of the dye molecules. The Shin(1)LG305 100 sample bleaches under heat treatment and the quantum yield decreases from 0.9 to 0.2, which is both a strong hint for dye decomposition. At significantly higher concentrations, a constant quantum yield is measured. This is caused by the high concentration of temperature stable crystalline dye aggregates (>200 °C).43 The LG305 dye is precipitated due to the low solubility in the Shin(1) matrix, as described in detail in the previous chapters. The quantum yield of the low concentrated Shin(1)FC546 decreases massively as well. Contrary to the Dow(1)FC546 series the decrease is smaller at higher dye concentrations. This indicates a very fast decomposition of the dye due to the high temperatures, promoted by the structure of the Shin(1) matrix. The decrease at higher concentrations caused by some destructive processes is not significant compared to the low concentrated sample values. The main difference in the matrix structure is the methyl to phenyl group ratio. The Shin(1) matrix contains no phenyl groups. This leads to the conclusion that the phenyl groups are protecting the dye from physical decomposition or chemical reactions with the matrix. This is supported by the results of the Dow(1)LG305 series, which is barely influenced by the heat treatment. At temperatures above 200 °C different decomposition mechanisms are reported for PDMS, PMPS and PDMDPS.44–49 In PDMS a homolytic cleavage of the Si–CH3 bond is described by forming radicals.45–47 A second mechanism is described by forming cyclic oligomers from a condensation reaction with terminal hydroxyl groups.47 A third possible decomposition mechanism describes the cyclic oligomer formation by an intramolecular reaction of the silicone backbone by forming four membered ring transition states.47,49 In phenyl containing systems the decomposition causes a benzene or cyclic oligomer formation. The proposed decomposition mechanisms are similar to the PDMS mechanisms.44,48,49 The main difference in decomposition is the chemical bonding in the main chain. The electron withdrawing phenyl groups increase the strength of the Si–O bonds due to inductive effects. The formation of cyclic oligomers is hindered which leads to an increase of degradation temperature.49 A radical formation in Shin(1) at 200 °C is conceivable and a possible reason for the massive decomposition of the incorporated dye. The calculated SA-coefficient is increasing for all samples (Fig. 16). Due to the crystallization of the LG305 dye in the Shin(1)LG305 series the value of the SA-coefficient stays constant for samples with dye concentrations larger than 750 ppm after 48 h.
 | ||
| Fig. 16 SA-coefficient of the Dow(1)LG305, Shin(1)LG305, Shin(1)FC546, and Dow(1)FC546 concentration series before and after a heat treatment for 48 and 120 h at 200 °C. | ||
Caused by the very intense weak emission spectra of the samples Shin(1)LG305 100 and the samples Shin(1)FC546 100 and 250 a calculation of the SA-coefficient was not possible. As a result the Dow(1) matrix is capable to protect the incorporated dyes from heat initiated decomposition while the Shin(1) matrix promotes their decomposition. The use of an isolated polymethylsiloxane matrix for dye protection is inappropriate.
All results of the fitted quantum yield emission spectra, the calculated SA-coefficients and the corrected quantum yield values for each concentration series are reported in the ESI.†
Photostability
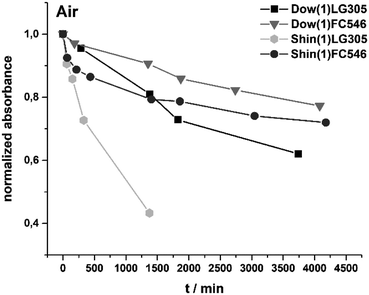
The photostability of the incorporated dyes is correlated to the change in absorbance. Samples with equal dye concentration of 100 ppm were exposed to a high power density 450 nm light source. For all samples a decrease of absorbance occurs. The absorbance of Shin(1)LG305 decreased about 57% in 1375 min. The absorbance of the FC546 dye in the same matrix in the same period decreased just by 21%. The absorbance of Dow(1)LG305 decreased 19% in 1380 min and just 10% in the same period for Dow(1)FC546 (Fig. 17).This indicates a much higher photostability of the covalent bonded FC546 dye. Possible photodegradation phenomena are more ineffective due to its structure. It is already known that N-alkyl substituted perylene diimide dyes in solution are generally more photostable than N-aryl substituted.14 There is no mechanism described, which explains this promotion due to a 450 nm light exposure yet. It is reasonable that a radical initiated decomposition takes place, as proposed for UV radiation experiments of LG305 in PMMA.13 In these literature described studies a decomposition is initiated by the disruption of the lateral phenoxy substituents as radicals followed by a homolytic cleavage of the N–R bond.13 A second possible explanation is an oxygen caused photo-oxidation as described for Lumogen® F Red 300 and Lumogen® F Orange 240 in polyester and PMMA.50
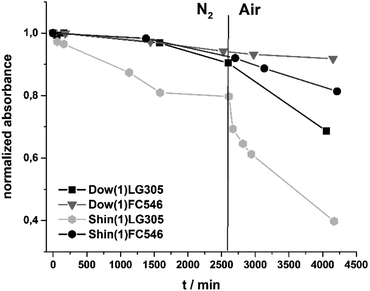
A second photostability experiment was carried out to investigate an oxygen influence. After 2500 min of light exposure under nitrogen atmosphere, the samples were exposed to air. The absorbance of all samples decreased under nitrogen atmosphere and the Shin(1)LG305 revealed the highest decrease in absorbance (Fig. 18). This indicates a matrix promoted degradation as described above.
In an air atmosphere the photostability decreases much more pronounced particularly for the Shin(1)LG305 sample. One reason for this behaviour might be the high oxygen permittivity of the Shin(1) matrix. An additional oxygen barrier layer could protect the encapsulation against this influence.51 The results show a strong influence of oxygen and of the matrix structure on the photodegradation process of the perylene diimide dyes in polysiloxane matrices. Independent of the extrinsic reasons for the degradation, the FC546 dye is the most stable investigated sample in combination with the Dow(1) matrix. But its loss of 33% absorbance in 4000 h is still considerable less than the lifetime of a commercially available LEDs containing inorganic conversion phosphors.
Conclusions
The influence of a LRI polydimethylsiloxane (ShinEtsu KJR 9022 E [Shin(1)]) and a HRI polymethylphenysiloxane (Dow Corning OE6630 [Dow(1)]) on the properties of two different incorporated perylene diimide based dyes was investigated. Heat- and photostability were measured and evaluated for both dyes in both matrices. Shin(1) showed a weak solubility for both dyes, which was increased by the curing procedure due to an increase of temperature. Crystallization of the LG305 dye in Shin(1) was observed after curing and crystal growth appears after an additional heat treatment. This indicated a high mobility of dissolved molecules caused by a temperature increase. There was no crystallization detected for the other samples due to covalent bonding or higher solubility of the dyes in the Dow(1) matrix. As a result, a solvent free incorporation of FC546 is achievable due to the covalent bonding and the increased solubility at curing conditions. High quantum yields ≥0.9 were detected for low concentrated samples of all kind. The Dow(1)LG305 series showed no decrease in quantum yield with an increase in concentration. A π–π-stacking is blocked due to the high amount of aromatic phenyl units in Dow(1), which are able to interact with the planar perylene core. A decrease of quantum yield for the FC546 series is caused by the dye structure, which favours dye–dye interaction. The Shin(1) series quantum yield decreases constantly with an increase of concentration. The low solubility benefits a dye–dye interaction that even leads to a crystallization process in the matrix. Dye incorporation is not influencing the polymer structure, shown by swelling experiments in toluene. Furthermore, no leaching occurs for covalent bonded FC546. Heat treatment for 120 h at 200 °C results in a decrease in quantum yield due to a post-curing process or dye decomposition. The Shin(1) matrix benefits the decomposition process massively. The highest photostability was observed for the FC546 dye. Shin(1) also favors a photo initiated decomposition of the dyes. Overall, a phenyl containing polysiloxane matrix with a low concentrated, covalently bonded perylene-based dye is a promising combination for LED application.Conflicts of interest
There are no conflicts to declare.Acknowledgements
This research has been funded by the Federal Ministry of Education and Research (BMBF, Germany) in the project ORCA – Organic and rare earth reduced conversion materials for LED-based lightning (project number 03XP0050). We would like to thank Prof. Gregor Jung for granting access to the Quantaurus instrument and for fruitful discussions, Dr Patrick Wenderoth and Dennis Meier for experimental, and Silvia Beetz for technical support.References
- Z. Xia and Q. Liu, Prog. Mater. Sci., 2016, 84, 59–117 CrossRef.
- T. Jüstel, H. Nikol and C. Ronda, Angew. Chem., Int. Ed., 1998, 37, 3084–3103 CrossRef.
- C. Feldmann, T. Jüstel, C. R. Ronda and P. J. Schmidt, Adv. Funct. Mater., 2003, 13, 511–516 CrossRef.
- C. R. Ronda, J. Alloys Compd., 1995, 225, 534–538 CrossRef.
- S. Ye, F. Xiao, Y. X. Pan, Y. Y. Ma and Q. Y. Zhang, Mater. Sci. Eng., R, 2010, 71, 1–34 CrossRef.
- M. Born and T. Jüstel, Chem. Unserer Zeit, 2006, 40, 294–305 CrossRef.
- P. Schlotter, R. Schmidt and J. Schneider, Appl. Phys. A Mater. Sci. Process., 1997, 64, 417–418 CrossRef.
- Y. N. Arukawa, I. N. Iki, K. I. Zuno, M. Y. Amada, Y. M. Urazaki and T. M. Ukai, Jpn. J. Appl. Phys., 2002, 41, 371–373 Search PubMed.
- R.-J. Xie, N. Hirosaki, H.-L. Li, Y. Q. Li and M. Mitomo, J. Electrochem. Soc., 2007, 154, J314 CrossRef.
- D. Di Martino, L. Beverina, M. Sassi, S. Brovelli, R. Tubino and F. Meinardi, Sci. Rep., 2014, 4, 4400 CrossRef PubMed.
- H. J. Kim, J. Y. Jin, Y. S. Lee, S. H. Lee and C. H. Hong, Chem. Phys. Lett., 2006, 431, 341–345 CrossRef.
- L. Zhang, B. Li, B. Lei, Z. Hong and W. Li, J. Lumin., 2008, 128, 67–73 CrossRef.
- G. Griffini, L. Brambilla, M. Levi, M. Del Zoppo and S. Turri, Sol. Energy Mater. Sol. Cells, 2013, 111, 41–48 CrossRef.
- A. Rademacher, S. Märkle and H. Langhals, Chem. Ber., 1982, 115, 2927–2934 CrossRef.
- G. Wagenblast, M. Könemann, S. Ivanovici, G. de Keyzer, R. Send and M. Pepers, Novel Illumination Devices, US Pat., US20160084477 A1, 2016 Search PubMed.
- G. Wagenblast, M. Könemann, S. Ivanovici, G. de Keyzer and R. Send, Color Converters, US Pat., US9711665 B2, 2017 Search PubMed.
- M. Könemann, G. Wagenblast, S. Ivanovici, G. de Keyzer and R. Send, Novel Color Converters, US Pat., US20140076397 A1, 2014 Search PubMed.
- M. Könemann, G. Wagenblast, S. Ivanovici, G. de Keyzer and R. Send, Novel Color Converter, US Pat., US20160284947 A1, 2016 Search PubMed.
- Y. Yang, G. Xian, H. Li and L. Sui, Polym. Degrad. Stab., 2015, 118, 111–119 CrossRef.
- R. Wen, J. Huo, J. Lv, Z. Liu and Y. Yu, J. Mater. Sci.: Mater. Electron., 2017, 28, 1–14 Search PubMed.
- J. E. Mark, Acc. Chem. Res., 2004, 37, 946–953 CrossRef PubMed.
- T. Higashihara and M. Ueda, Macromolecules, 2015, 48, 1915–1929 CrossRef.
- J. Wang, M.-L. Du, C.-S. Xu, H. Zhu and Y.-Q. Fu, J. Macromol. Sci., Part B: Phys., 2012, 51, 2462–2472 CrossRef.
- J. S. Kim, S. Yang and B. S. Bae, Chem. Mater., 2010, 22, 3549–3555 CrossRef.
- I. A. Lei, D. F. Lai, T. M. Don, W. C. Chen, Y. Y. Yu and W. Y. Chiu, Mater. Chem. Phys., 2014, 144, 41–48 CrossRef.
- M. Buffa and M. G. Debije, Springer Ser. Mater. Sci., 2014, 190, 247–266 Search PubMed.
- L. Y. Tyng, M. R. Ramli, M. B. H. Othman, R. Ramli, Z. A. M. Ishak and Z. Ahmad, Polym. Int., 2013, 62, 382–389 CrossRef.
- G. Maggioni, A. Campagnaro, S. Carturan and A. Quaranta, Sol. Energy Mater. Sol. Cells, 2013, 108, 27–37 CrossRef.
- C. Huang, S. Barlow and S. R. Marder, J. Org. Chem., 2011, 76, 2386–2407 CrossRef PubMed.
- M. Könemann, S. Ivanovici, H. S. Mangold, G. Kickelbick and N. Steinbrück, EP18151250.0 (patent pending), 2018.
- BASF AG, Lumogen(R)F – Technical Information, TI/P 3201 e (9125), 1997.
- B. Zhang, H. Soleimaninejad, D. J. Jones, J. M. White, K. P. Ghiggino, T. A. Smith and W. W. H. Wong, Chem. Mater., 2017, 29, 8395–8403 CrossRef.
- C. Feldgitscher, H. Peterlik, M. Puchberger and G. Kickelbick, Chem. Mater., 2009, 21, 695–705 CrossRef.
- N. Stafie, D. F. Stamatialis and M. Wessling, Sep. Purif. Technol., 2005, 45, 220–231 CrossRef.
- T. S. Ahn, R. O. Al-Kaysi, A. M. Müller, K. M. Wentz and C. J. Bardeen, Rev. Sci. Instrum., 2007, 78, 2007–2009 CrossRef PubMed.
- L. R. Wilson and B. S. Richards, Appl. Opt., 2009, 48, 212 CrossRef PubMed.
- P. J. Launer, Silicon Compd. Regist. Rev., 1987, pp. 100–103 Search PubMed.
- J. H. Lady, G. M. Bower, R. E. Adams and F. P. Byrne, Anal. Chem., 1959, 31, 1100–1102 CrossRef.
- J. Coates, Encycl. Chem. Technol., 2000, 10815–10837 Search PubMed.
- N. B. Sanches, S. N. Cassu, R. De Cássia and L. Dutra, Polimeros, 2015, 25, 247–255 Search PubMed.
- Z. Krumer, W. G. J. H. M. van Sark, R. E. I. Schropp and C. de Mello Donega, Sol. Energy Mater. Sol. Cells, 2017, 167, 133–139 CrossRef.
- M. Mitsui, H. Fukui, R. Takahashi, Y. Takakura and T. Mizukami, J. Phys. Chem. A, 2017, 121, 1577–1586 CrossRef PubMed.
- Y. Nagao, Prog. Org. Coat., 1997, 31, 43–49 CrossRef.
- G. Deshpande and M. E. Rezac, Polym. Degrad. Stab., 2002, 76, 17–24 CrossRef.
- G. Camino, S. M. Lomakin and M. Lageard, Polymer, 2002, 43, 2011–2015 CrossRef.
- C. Camino, S. M. Lomakin and M. Lazzari, Polymer, 2001, 42, 2395–2402 CrossRef.
- N. Grassie and I. G. Macfarlane, Eur. Polym. J., 1978, 14, 875–884 CrossRef.
- N. Grassie, I. G. Macfarlane and K. F. Francey, Eur. Polym. J., 1979, 15, 415–422 CrossRef.
- N. Grassie, K. F. Francey and I. G. Macfarlane, Polym. Degrad. Stab., 1980, 2, 67–83 CrossRef.
- N. Tanaka, N. Barashkov, J. Heath and W. N. Sisk, Appl. Opt., 2006, 45, 3846–3851 CrossRef PubMed.
- G. H. Kim, J. Oh, Y. S. Yang, L. M. Do and K. S. Suh, Thin Solid Films, 2004, 467, 1–3 CrossRef.
Footnote |
| † Electronic supplementary information (ESI) available: Including measured and corrected quantum yield, self-absorption coefficient calculations and fit functions, infra-red spectroscopy data, UV/VIS spectra of the bleaching experiments and the 1H NMR spectra of the Lumogen®F 305 Red and FC546 dyes. See DOI: 10.1039/c8ra01700j |
| This journal is © The Royal Society of Chemistry 2018 |

