 Open Access Article
Crystal structure and luminescence properties of a novel single-phase orange-red emitting phosphor Ca9La (PO4)7:Sm3+
Bin Ma *a,
Xiaoqin Mab,
Tonghui Xua,
Ke Sua and
Qianxin Zhanga
aQinghai Provincial Key Laboratory of New Light Alloys, Qinghai Provincial Engineering Research Center of High Performance Light Metal Alloys and Forming, Qinghai University, Xining 810016, P. R. China. E-mail: mabinss@126.com; Fax: +86-0971-5363128; Tel: +86-0971-5363128
bAnalytical Instrumentation Center, Qinghai Normal University, Xining 810016, P. R. China
First published on 17th April 2018
Abstract
Ca9La1−x(PO4)7:xSm3+ phosphors (0.01 < x < 0.25) were synthesized via high temperature solid-state reaction. Their properties including crystal structure, decay performance, thermal stability and photoluminescence were examined in detail. Phase analysis indicated that the phosphors crystallized in a rhombohedral structure, and the emission spectra of the phosphors consisted of four peaks centered around 570, 607, 653, and 714 nm, attributed to Sm3+ ions transitions 4G5/2 → 6HJ (J = 5/2, 7/2, 9/2, and 11/2, respectively). The optimal Sm3+ doping content was 0.12 mol and the Ca9La(PO4)7:Sm3+ phosphor also exhibited better thermal stability compared to other phosphors. In addition, the mechanism behind the energy transfer between Sm3+ ions was determined to be dipole–dipole interactions as described by Dexter theory. The results indicated that as orange-red phosphors, Ca9La (PO4)7:Sm3+ phosphors were promising candidates for being integrated into white light emitting diodes.
1. Introduction
As a new generation of illumination light sources, white light emitting diodes (w-LEDs) have received much attention. Their main advantages over conventional light sources are extended lifetime, better security and reliability as well as higher energy-efficiency.1–6 In general, w-LEDs can be achieved with the following two approaches: in the first method a yellow phosphor such as Y3Al5O12:Ce3+ (YAG:Ce) is integrated into a blue LED chip (as InGaN-based chip);7 in the second one, a near-UV (n-UV) LED chip, emitting in the 350 - 420 nm spectral range, is incorporated in a tri-color phosphor (i.e. blue, green, and red).8 However, the former method suffers from a rather high color temperature (>4500 K) and poor color-rendering index (CRI < 75) resulted from the weak emission in the visible red range.9 The second method can better control the w-LED colors, still, it is a great challenge to obtain orange or red phosphors with a high stability and brightness, so this issue is necessary to addressed.Lanthanides are commonly used in displays and lighting devices thanks to the 5d → 4f or 4f → 4f transitions.4 Red and orange-red emitting phosphors can be realized by doping lanthanides with Eu3+ or Sm3+ ions and exploiting 4f → 4f transitions. However, Eu3+ doped phosphors display efficient luminescence only under n-UV excitation, which limits their application in w-LEDs.5 While Sm3+ doped phosphors can be more easily stimulated by a blue region radiation. Moreover, Sm3+ doped phosphors can act as orange-red emitters due to the 4G5/2 → 6HJ (with J = 5/2, 7/2, 9/2, and 11/2) transitions.10 These features have motivated intense researches on compounds such as Sr3Lu(PO4)3:Sm3+,11 Ba3Lu(PO4)3:Sm3+,12 NaSrVO4:Sm3+ (ref. 13) and KLaSr3(PO4)3F:Sm3+.14
Recently, multiple examples of phosphates with whitlockite crystal structure fabricated based on M9R(PO4)7 compounds, in which M = Ca or Sr and R = La, Y, Sc, Gd, or Bi, have demonstrated the feasibility for them to be applied as host materials for phosphors. Specifically, such phosphates compounds possess good thermal stability,15 and perfect charge stabilization allowed by the rigid tetrahedral matrix of the phosphate.16,17 Besides, they can be synthesized in an easy and low-cost method.18 Currently, the luminescence of rare-earth ions doped whitlockite-type phosphate have been intensively studied in many compounds including Ca9La(PO4)7:Eu2+, Mn2+,19 Ca9Ln(PO4)7:Tb3+ (with Ln = Y, La or Gd),20 Ca9Bi(PO4)7:Ce3+, Tb3+, Mn2+,21 Ca9LiGd(2/3) (PO4)7:Eu2+,22 Sr8MgLn(PO4)7:Eu2+ (with Ln = Y or La)23 and Sr9Sc(PO4)7:Eu2+, Mn2+.24 Yet, the crystal structure and luminescence properties of Ca9La(PO4)7:Sm3+ were seldomly reported before.
In this article, orange-red single-phase Ca9La(PO4)7:Sm3+ phosphors were fabricated via solid state reaction. Then their crystal structure and photoluminescence performance were discussed in detail. Beside that, thermal quenching, lifetime and concentration quenching were also investigated. The energy transfer in Ca9La(PO4)7 doped with Sm3+ were also detailly examined, which demonstrated the feasibility of Ca9La(PO4)7:Sm3+ phosphors applied in n-UV or blue light excited w-LEDs as orange-red emitters.
2. Experimental methods
2.1. Materials and synthesis
A series of Ca9La1−x(PO4)7:xSm3+ (x = 0.01, 0.03, 0.06, 0.09, 0.12, 0.15, 0.18 and 0.25) were fabricated via high temperature solid-state reaction with following precursors: CaCO3 (Aladdin, 99.9%), NH4H2PO4 (Aladdin, 99.9%), La2O3 (Aladdin, 99.99%) and Sm2O3 (Aladdin, 99.99%). Each reactant of stoichiometric amount was fully grinded and preheated at 650 °C for 6 h. Then, the mixture was heated at 1300 °C for 4 h. After cooling down to room temperature and grinding, the products were obtained.2.2. Characterizations
Powder X-ray diffraction (XRD) data was acquired from a Bruker D8 Advance X-ray powder diffractometer, using Cu Kα radiation (λ = 1.5418 Å) with operation voltage of 40 kV and current of 40 mA. Then, Rietveld analysis was performed on XRD data (step size: 0.02°, counting time: 2 s per step, and 2θ: 5° – 120°) collected from Ca9La0.99(PO4)7:0.01Sm3+ and Ca9La0.88(PO4)7:0.12Sm3+ phosphors. TOPAS program was used to perform crystal structure refinement.25 And photoluminescence emission (PL) and excitation (PLE) spectra, as well as temperature-dependent luminescence properties were all obtained by a Hitachi F-4600 fluorescence spectrophotometer. In addition, the decay curves were detected by a Yvon TBXPS spectrofluorometer. ZEISS 6035 scanning electron microscope (SEM) equipped with an Inca X-Max energy dispersive spectroscope (EDS) operated at voltage of 20 kV was used to characterize the particle morphology and conduct elemental analysis.3. Results and discussion
3.1. Crystal structure
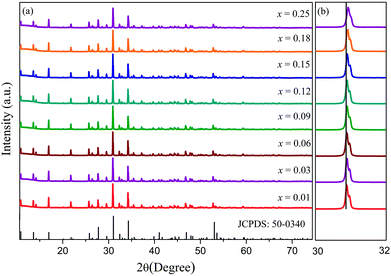
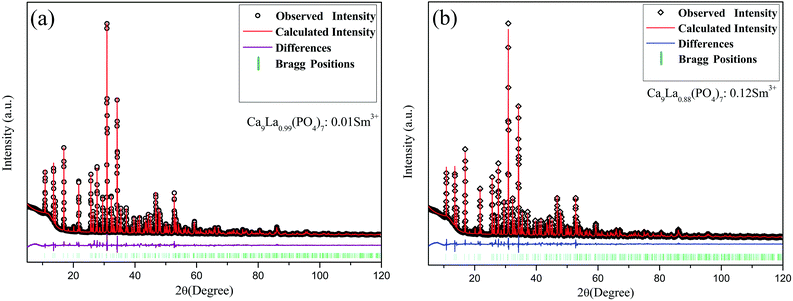
XRD patterns for samples Ca9La1−x(PO4)7:xSm3+ (x = 0.01, 0.03, 0.06, 0.09, 0.12, 0.15, 0.18 and 0.25) were shown in Fig. 1, and due to the isostructure, the polycrystalline standard data of compound Ca9Sc(PO4)7 (JCPDS: 50-0340) was taken as a reference. As can be seen from the Fig. 1, all the diffraction peaks of the phosphors perfectly matched with the reference, suggesting that the prepared phosphors was a single phase and that the introduction of Sm3+ ions did not sensibly influence the crystal lattice of Ca9La(PO4)7. Besides, considering the similar ionic radius and the same valence state, the Sm3+ ions were thought to take up the La sites. Moreover, the diffraction peaks position slightly shifted toward higher angles along with the raised Sm3+ doping concentration (Fig. 1(b)), which also confirmed the occupation of La3+ ions by smaller Sm3+ions. To further verify the purity of Ca9La1−x(PO4)7:xSm3+ compounds, Rietveld refinement was performed on x = 0.01 and x = 0.12 samples at room temperature. The initial structural model for Rietveld refinement was constructed based on isostructural single crystal crystallographic data of Ca9Sc(PO4)7. And Fig. 2 showed Rietveld refinement results on x = 0.01 (Fig. 2(a)) and x = 0.12 (Fig. 2(b)) samples using TOPAS 4.2. The original experimental patterns were indicated by black circles and diamonds, the calculated patterns were represented by solid lines. The difference between them were shown in purple and blue curves, the calculated Bragg reflections positions of Ca9Sc(PO4)7 was shown in olive vertical lines. As shown in Table 1 and Fig. 2, the refinements possessed low R-factors. The reliability parameters finally converged to Rwp = 5.77%, Rp = 3.90% and x2 = 1.60 for x = 0.01 and Rwp = 5.43%, Rp = 3.86% and x2 = 1.46 for x = 0.12 phosphors, indicating that both samples were pure single phase. Besides, the results listed in Table 1 showed that the samples were well crystallized in an rhombohedral lattice with the space group of R3c. Interestingly, the cell volume dropped with the increasing of doping x, which was because of the smaller ion radius of Sm3+ compared to La3+ (3572.32 Å3 for x = 0.01 and 3570.16 Å3 for x = 0.12).| Compound | Ca9La0.99(PO4)7:0.01Sm3+ | Ca9La0.88(PO4)7:0.12Sm3+ |
|---|---|---|
| 2θ-interval | 5–120 (°) | 5–120 (°) |
| Space group | R3c (161) | R3c (161) |
| Symmetry | Rhombohedral | Rhombohedral |
| Cell parameters | a (Å) = 10.48233 (9); | a (Å) = 10.48020 (9); |
| c (Å) = 37.5409 (4); | c (Å) = 37.5334 (4); | |
| V (Å3) = 3572.32 (7) | V (Å3) = 3570.16 (7) | |
| Z = 6 | Z = 6 | |
| Reliability factors | Rp = 3.90 | Rp = 3.861 |
| Rwp = 5.77 | Rwp = 5.43 | |
| Rexp = 1.44 | Rexp = 1.42 | |
| RBragg = 1.79 | RBragg = 1.59 | |
| x2 = 1.60 | x2 = 1.46 |
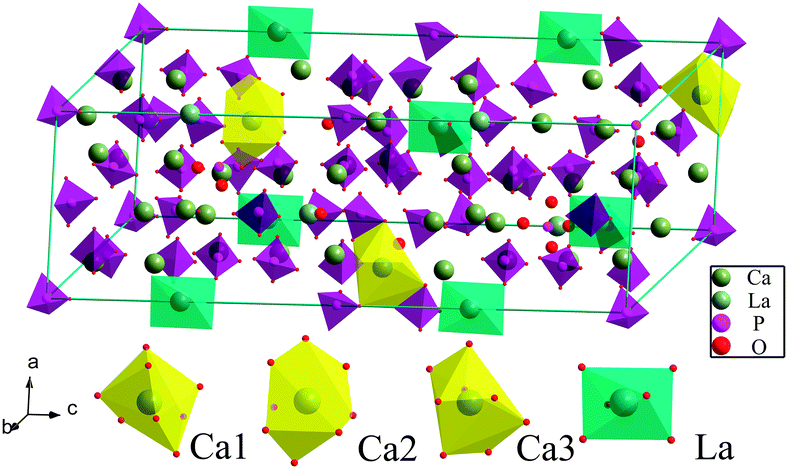
Fig. 3 showed the details of the reference Ca9La(PO4)7 crystal structure based on β-Ca3(PO4)2,26 and it was obvious that Ca9La(PO4)7 was isostructural to Ca9Sc(PO4)7 and Ca9Fe(PO4)7.27,28 In particular, three different Ca2+ ionic sites and only one kind of La3+ site were observed. More specifically, the three kinds of Ca2+ ionic sites were all coordinated with eight oxygen atoms, while the La3+ site was coordinated with six oxygen atoms. This could further explain why the Sm3+ (r(Sm3+) = 0.958 Å, CN = 6) ions occupied the sites of the La3+ (r(La3+) = 1.032 Å CN = 6), as described in Fig. 1.
Fig. 4 displayed the SEM image of the x = 0.12 phosphor including the EDS elemental analysis in the red rectangle area. The irregular particle size and the agglomeration occurred during the heating process were the typical morphology from high temperature solid-state reaction synthesis.5 Meanwhile, the EDS analysis showed that the atom ratio of each element Ca, La, O, P and Sm were 9.11, 0.83, 28.37, 7.06 and 0.14 at%, respectively. The results indicated the actual atom ratio of each element was very close to the intended atom ratio, and also confirmed the success of Sm doping.
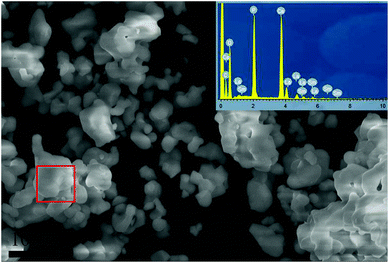 | ||
| Fig. 4 SEM image of x = 0.12 sample, the EDS element analysis of the surface points within the rectangle area is shown in the inset. | ||
3.2. Luminescence properties
For the purpose of investigation on the luminescence properties of Sm3+ in Ca9La(PO4)7, the PLE spectra at different emission wavelengths (λem = 570, 607, 653 nm) and PL spectra under different excitation wavelengths (λex = 377, 406, 408 nm) of x = 0.12 sample were monitored under the same testing conditions as shown in the Fig. 5. All the excitation spectra as well as emission spectra possessed the same features except for the discrepancy in relative intensities. The PL spectra also indicated that Ca9La(PO4)7:Sm3+ compounds had potential to be applied as near-UV light (350–420 nm) excited phosphor, since the emission intensities were maximal under the excitation at 406 nm.The PLE spectrum in Fig. 5(a) clearly was made up of multiple narrow bands (at 320, 347, 365, 377, 406, and 478 nm) in the wavelength range from 300 to 500 nm, which were corresponding to the following transitions of Sm3+ ions: 6H5/2 → 2L15/2, 6H5/2 → 4H9/2, 6H5/2 → 4D3/2, 6H5/2 → 4D1/2, 6H5/2 → 4F7/2 and 6H5/2 → 4I11/2.4,29 Among them, by analyzing the integrated areas of every narrow peaks, it was manifested that the 4F7/2 was the most populated level under the excitation at 406 nm. The PL bands maxima in Fig. 5(b) were centered at 570, 607, 653, and 714 nm, corresponding to the 4G5/2 → 6H5/2, 4G5/2 → 6H7/2, 4G5/2 → 6H9/2 and 4G5/2 → 6H11/2 transitions of Sm3+,5,30 respectively. Likewise, among these transitions, it was indicated the 4G5/2 → 6H7/2 (at 607 nm) transition was the most intense one by the integrated areas analysis. And according to the selection rules, this was a partially magnetic and partially electric dipole transition,31 while 4G5/2 → 6H9/2 as well as 4G5/2 → 6H11/2 was purely electric dipole transitions and 4G5/2 → 6H5/2 was purely magnetic dipole transition.4
For a better understanding of the luminescence behaviors of Sm3+ in Ca9La(PO4)7, the energy level diagram of Sm3+ was shown in Fig. 5(c). According to the diagram, Sm3+ ions can be excited to the 4F7/2, 4D1/2 and 4I11/2 states from the 6H5/2, and the states were relaxed to the 4G5/2 emitting state through non-radiative (NR) transitions. The efficient multi-channel transition emissions of Sm3+ ions occurred when the 4G5/2 state was populated. As a result, Sm3+ exhibited visible emitting colors.
In order to identify the optimal Sm3+ doping content and clarify the dependence of the emission intensities on the Sm3+ concentration, the optical properties of a series of Ca9La1−x(PO4)7:xSm3+ phosphors (x = 0.01, 0.03, 0.06, 0.09, 0.12, 0.15, 0.18 and 0.25) were investigated. And Fig. 6 showed the emission spectra under 406 nm excitation. The intensities of emission peaks initially increased with the enhanced Sm3+ doping content and reached a maximum value at the Sm3+ content of 0.12 mol, and then decreased due to the concentration quenching. According to ref. 32 and 33, the critical energy transfer distance RC between Sm3+ ions can be calculated according to the concentration quench formula:
 | (1) |
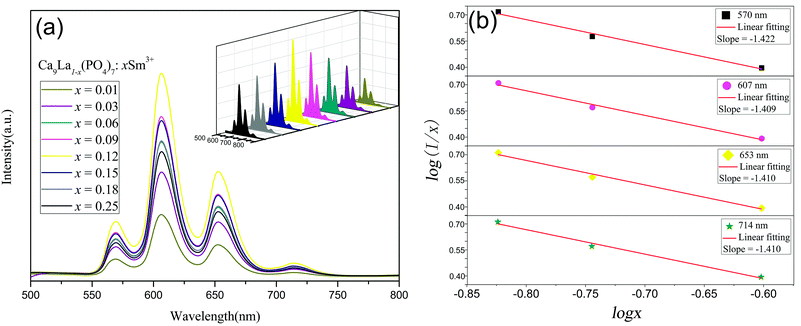 | ||
Fig. 6 PL spectrum (λex = 406 nm) of Ca9La1−x(PO4)7:xSm3+ phosphors (a), The relationship between log(I/x) versus log![[thin space (1/6-em)]](https://www.rsc.org/images/entities/char_2009.gif) x in Sm3+ doped Ca9La(PO4)7 phosphors (b). x in Sm3+ doped Ca9La(PO4)7 phosphors (b). | ||
According to Dexter theory, this kind of interaction between sensitizer and activator can be further analyzed based on the calculation from the following equation:34,35
 | (2) |
![[thin space (1/6-em)]](https://www.rsc.org/images/entities/char_2009.gif) x obtained in Sm3+ doped Ca9La(PO4)7 phosphors at 406 nm exicitation was displayed in Fig. 6(b). The slope (equal to θ/3) was −1.422, −1.409, −1.410, and −1.410, indicated that the θ values were 4.266, 4.227, 4.230 and 4.230, respectively. These values close to 6 revealed that the principal concentration quenching mechanism behind the luminescence quenching of Ca9La1−x(PO4)7:xSm3+ phosphors was the dipole–dipole interaction.
x obtained in Sm3+ doped Ca9La(PO4)7 phosphors at 406 nm exicitation was displayed in Fig. 6(b). The slope (equal to θ/3) was −1.422, −1.409, −1.410, and −1.410, indicated that the θ values were 4.266, 4.227, 4.230 and 4.230, respectively. These values close to 6 revealed that the principal concentration quenching mechanism behind the luminescence quenching of Ca9La1−x(PO4)7:xSm3+ phosphors was the dipole–dipole interaction.
To further investigate luminescence properties, Fig. 7 showed the fluorescence decay curves of Ca9La1−x(PO4)7:xSm3+ phosphors (x = 0.03, 0.12, and 0.25) under 406 nm excitation and monitored at 570, 607 and 653 nm. Each curve exhibited a single – exponential decay and could be calculated by the following equation:5
I(t) = I0 + A1![[thin space (1/6-em)]](https://www.rsc.org/images/entities/char_2009.gif) exp(−t/τ) exp(−t/τ)
| (3) |
 | ||
| Fig. 7 Decay curves of Sm3+ in x = 0.03, 0.12, and 0.25 phosphors excited at 406 nm and monitored at 607 (a), 653 (b) and 570 (c) nm. | ||
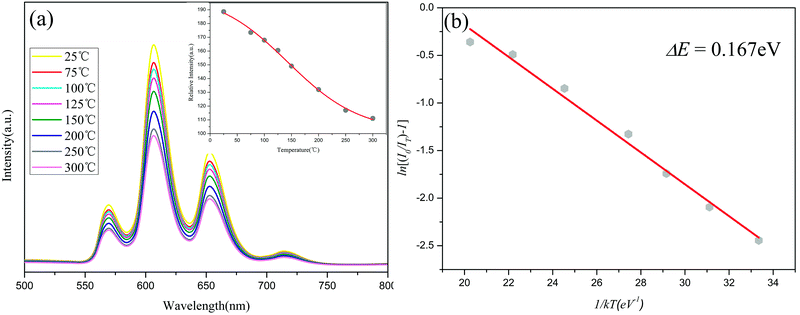
As one of the most important parameters for technological utilization of phosphors, thermal stability was also investigated.5 The PL spectra (λex = 406 nm) of x = 0.12 phosphor within 25–300 °C were showed in Fig. 8(a) and the relationship between relative emission intensities and the temperature was showed in the inset. Each emission spectrum included the several characteristic peaks of Sm3+ within 500–800 nm. However, the emission intensities declined gradually along with the rising temperature, which was because of the thermal quenching effect.2,5 As shown in the inset, the integrated emission intensities of the x = 0.12 phosphor at 150 °C was about 79% of the one at 25 °C, which indicated rather good stability of the phosphor.
To detailly investigate the thermal quenching effect and estimate the activation energy during the quenching process, the variation tendency of the luminescence intensity of x = 0.12 sample along with changing temperature could be depicted by the Arrhenius equation:36
 | (4) |
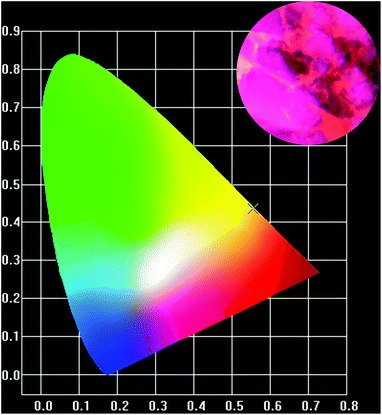
The CIE (Commission Internationale de L′ Eclairage) color chromaticity coordinates (x, y) of the x = 0.12 phosphor acquired from the PL spectra under 406 nm excitation were labelled with a cross symbol in the CIE chromaticity diagram, as showed in Fig. 9. The resulting coordinates (0.5548, 0.4358) indicated the emission in the orange-red region. For exhibition purpose, the inset in Fig. 9 showed the digital image of the phosphor. Above results suggested that this orange-red phosphors could be promising candidate in w-LEDs excited by n-UV chips.
4. Conclusions
In summary, a series of Ca9La1−x(PO4)7:xSm3+ phosphors were successfully fabricated via conventional solid-state reaction. The crystal structure, photoluminescence performance, decay lifetime and thermal quenching behaviors were studied in detail. The crystallographic analysis indicated that the doped Ca9La(PO4)7:Sm3+ compounds crystallized in rhombohedral crystal structure (space group: R3c (161)). The PL spectra of Ca9La1−x(PO4)7:xSm3+ samples were made up of four emission bands around 570, 607, 653, and 714 nm, corresponding to the 4G5/2 → 6HJ (J = 5/2, 7/2, 9/2, and 11/2) transitions of Sm3+ ions, respectively. Among them, the 6H7/2 was the most populated level. The optimal Sm3+ doping content turned out to be x = 0.12 mol, and the critical transfer distance RC of Sm3+ in Ca9La(PO4)7 was determined as 10.17 Å. Besides, On the basis of the Dexter theory, the electric dipole–dipole interaction was determined to be the principal concentration quenching mechanism behind the energy transfer between Sm3+ in Ca9La1−x(PO4)7:xSm3+ phosphors. From the life time decay curves that the energy transfer between Sm3+ ions in Ca9La(PO4)7 was also observed. Moreover, Ca9La(PO4)7:Sm3+ possessed fine thermal and color stability. All the results pointed out that the Ca9La1−x(PO4)7:xSm3+ phosphors have great potential as orange-red phosphors for developing w-LEDs excited by n-UV radiation.Conflicts of interest
There are no conflicts to declare.Acknowledgements
This work is supported by the Qinghai Provincial Natural Science Foundation for Young Scholars (No. 2017-ZJ-929Q) and the Qinghai Provincial Innovation Platform Program (No. 2017-ZJ-Y17).References
- J. Zhao, C. Guo, T. Li, X. Su, N. Zhang and J. Chen, Dyes Pigm., 2016, 132, 159–166 CrossRef CAS.
- B. Ma, Z. Huang, M. Fang, Y. Liu and X. Wu, RSC Adv., 2015, 5, 9933–9938 RSC.
- H. Liu, L. Liao, M. S. Molokeev, Q. Guo, Y. Zhang and L. Mei, RSC Adv., 2016, 47, 24577–24583 RSC.
- L. Li, X. Tang, Z. Jiang, X. Zhou, S. Jiang, X. Luo, G. Xiang and K. Zhou, J. Alloys Compd., 2017, 701, 515–523 CrossRef CAS.
- B. Ma and B. Liu, J. Lumin., 2017, 188, 54–59 CrossRef CAS.
- X. Mi, J. Sun, P. Zhou, H. Zhou, D. Song, K. Li, M. Shang and J. Lin, J. Mater. Chem. C, 2015, 3, 4471–4481 RSC.
- Z. Xia and A. Meijerink, Chem. Soc. Rev., 2016, 46, 275–299 RSC.
- Q. Zhou, Y. Zhou, Y. Liu, L. Luo, Z. Wang, J. Peng, J. Yan and M. Wu, J. Mater. Chem. C, 2015, 3, 3055–3059 RSC.
- Z. Sun, M. Wang, Z. Yang, Z. Jiang, K. Liu and Z. Ye, J. Alloys Compd., 2016, 658, 453–458 CrossRef CAS.
- J. Xu, Z. Ju, X. Gao, Y. An, X. Tang and W. Liu, Inorg. Chem., 2013, 52, 13875–13881 CrossRef CAS PubMed.
- J. Du, D. Xu, X. Gao, Z. Yang and J. Sun, J. Mater. Sci.: Mater. Electron., 2017, 28, 8136–8143 CrossRef CAS.
- Z. Yang, D. Xu and J. Sun, Opt. Express, 2017, 25, A391 CrossRef CAS PubMed.
- P. Biswas, V. Kumar, G. Agarwal, O. M. Ntwaeaborwa and H. C. Swart, Ceram. Int., 2016, 42, 2317–2323 CrossRef CAS.
- Q. Guo, C. Zhao, L. Liao, S. Lis, H. Liu, L. Mei and Z. Jiang, J. Am. Ceram. Soc., 2017, 100, 2221–2231 CrossRef CAS.
- X. Dong, J. Zhang, Z. Xia, Z. Hao and Y. Luo, J. Alloys Compd., 2014, 587, 493–496 CrossRef CAS.
- Y. S. Tang, S. F. Hu, C. C. Lin, N. C. Bagkar and R. S. Liu, Appl. Phys. Lett., 2007, 90, 151103–151108 CrossRef.
- Z. Wu, J. Liu and M. Gong, Chem. Phys. Lett., 2008, 466, 88–90 CrossRef CAS.
- X. Dong, J. Zhang, Z. Xia, Z. Hao and S. Lv, Ceram. Int., 2014, 40, 5421–5423 CrossRef CAS.
- C. H. Huang and T. M. Chen, Opt. Express, 2010, 18, 5089–5099 CrossRef CAS PubMed.
- F. Zhang, J. Xie, G. Li, W. Zhang, Y. Wang, Y. Huang and Y. Tao, J. Mater. Chem. C, 2016, 5, 872–881 RSC.
- K. Li, M. Shang, Y. Zhang, J. Fan, H. Lian and J. Lin, J. Mater. Chem. C, 2015, 3, 7096–7104 RSC.
- F. Du, R. Zhu, Y. Huang, Y. Tao and H. J. Seo, Dalton Trans., 2011, 40, 11433–11440 RSC.
- C. H. Huang and T. M. Chen, Inorg. Chem., 2011, 50, 5725–5730 CrossRef CAS PubMed.
- X. Dong, J. Zhang, L. Zhang, X. Zhang, Z. Hao and Y. Luo, Eur. J. Inorg. Chem., 2013, 2014, 870–874 CrossRef.
- V. TOPAS, Bruker AXS, Karlsruhe, Germany, 2008 Search PubMed.
- A. A. Belik, F. Izumi, T. Ikeda, M. Okui, A. P. Malakho, V. A. Morozov and B. I. Lazoryak, J. Solid State Chem., 2002, 168, 237–244 CrossRef CAS.
- H. F. Li, Y. L. Jia, T. F. Ma, R. Pang, W. Z. Sun, D. Li, J. P. Fu, S. Zhang, L. H. Jiang and C. Y. Li, Eur. J. Inorg. Chem., 2016, 2016, 867–873 CrossRef CAS.
- B. I. Lazoryak, V. A. Morozov, A. A. Belik, S. S. Khasanov and V. S. Shekhtman, J. Solid State Chem., 1996, 122, 15–21 CrossRef CAS.
- R. Yu, N. Xue, T. Wang, Z. Zhao, J. Wang, Z. Hei, M. Li, H. M. Noh and J. H. Jeong, Ceram. Int., 2015, 41, 6030–6036 CrossRef CAS.
- Y. Liu, P. Yang, W. Wang, H. Dong and J. Lin, CrystEngComm, 2010, 12, 3717–3723 RSC.
- B. Bondzior, D. Stefańska, A. Kubiak and P. J. Dereń, J. Lumin., 2016, 173, 38–43 CrossRef CAS.
- G. Blasse, Phys. Lett. A, 1968, 28, 444–445 CrossRef CAS.
- G. Blasse, J. Solid State Chem., 1986, 62, 207–211 CrossRef CAS.
- D. L. Dexter, J. Chem. Phys., 1953, 21, 836–850 CrossRef CAS.
- B. Ma, Q. Guo, M. S. Molokeev, Z. Lv, J. Yao, L. Mei and Z. Huang, Ceram. Int., 2016, 42, 5995–5999 CrossRef CAS.
- S. Arrhenius, Über die Dissociationswärme und den Einfluss der Temperatur auf den Dissociationsgrad der Elektrolyte, Wilhelm Engelmann, 1889 Search PubMed.
| This journal is © The Royal Society of Chemistry 2018 |

