
 Open Access Article
 This Open Access Article is licensed under a
 Creative Commons Attribution 3.0 Unported Licence
Modulating the magnetic properties of MoS2 monolayers by group VIII doping and vacancy engineering†
Cuifang Jia,
Bo Zhou *,
Qi Song,
Xiaodong Zhang and
Zhenyi Jiang
*,
Qi Song,
Xiaodong Zhang and
Zhenyi Jiang
Institute of Modern Physics, Shaanxi Key Laboratory for Theoretical Physics Frontiers, Northwest University, Xi'an 710069, People's Republic of China. E-mail: zhoubo@nwu.edu.cn
First published on 23rd May 2018
Abstract
In this work, density functional theory is adopted to study the electronic and magnetic properties of MoS2 monolayers combined with a single S vacancy defect and a group VIII (G8) atom dopant, in which the dopant is incorporated via Mo substitution. The calculated results show that the magnetic properties of monolayer MoS2 can be tuned by changing the distribution of the G8 atom and S vacancy. The S vacancy tends to decrease the net magnetic moment of the doped system when these two defects are in their closest configuration. By adjusting the distance between the dopant and the S vacancy, the doped MoS2 monolayer may show a variable net magnetic moment. In particular, all of the Ni-doped MoS2 monolayers show zero magnetic moment with or without an S vacancy. The mean-field approximation is used to estimate the Curie temperature (TC). Our results show that Fe, Co, Ru, Rh, Os and Ir-doped MoS2 monolayers are potential candidates for ferromagnetism above room temperature. The density of states calculations provide further explanations as to the magnetic behavior of these doped systems. These results provide a new route for the potential application of atomically thin dilute magnetic semiconductors in spintronic devices by employing monolayer MoS2.
Introduction
Dilute magnetic semiconductors (DMSs) have been the focus of extensive research over the last decade, driven by the prospect of achieving spintronic devices, which can exploit both the charge and spin freedom.1–5 Meanwhile, two-dimensional (2D) transition metal dichalcogenides (TMDCs) have also demonstrated great potential for the new generation spintronics devices due to their unique structural and electronic properties. A significant amount of theoretical and experimental effort has been devoted in the field of TMDCs to comprehending the role of magnetic impurities such as V, Cr, Mn, Fe, Co, Ni, and Cu as discussed in several reviews.5–10 Despite the great advances in this field, producing strong ferromagnetic interactions and the stability of such ferromagnetic order is still the most important and most difficult part.Recently, many studies, theoretical and experimental, have focused on the magnetic properties of 1H-MoS2.11–13 Magnetic doping through either adsorption or substitution is found to be an efficient method to introduce magnetism into MoS2.5–7 Magnetic interactions can be tuned by carriers and strain. At the same time, sulfur vacancies have also been found to be related to the magnetic properties of MoS2.14 Vacancies not only influence the magnetic properties, but also change the carrier density of the semiconductor. Obviously, S vacancies can influence the magnetism in the transition metal doping case. Lots of studies have been done on each factor. However, it is not clear how these two factors interplay and then what the influence of this interplay is on the magnetic properties.
In this paper, theoretical methods are used to study the effect of substitutional group VIII (G8) atom doping in 1H-MoS2 with or without an S vacancy. The distributions of the S vacancy and G8 elements have also been considered. This work may bring a new insight into the preparation of ferromagnetic materials in DMSs.
Computational methods
First principles calculations were performed using the Vienna ab initio simulation package (VASP)15 on the basis of density functional theory (DFT). The electron–ion interactions were described by the projected augmented wave (PAW) method,16 and the electronic exchange–correlation potential employed the generalized gradient approximation with the Perdew–Burke–Ernzerhof functional (GGA-PBE).17 In order to verify our results, the Hubbard-U correction method18 was also used. Different U values were assigned to the G8 impurities, while the U parameterization was not used for the host materials since they have little impact on the magnetic ordering, as suggested by many authors in ref. 19–21. A 4 × 4 × 1 MoS2 supercell structure containing 32 S and 16 Mo atoms was constructed as the pristine model in this calculation. Moreover, a vacuum region of 15 Å was added along the c plane to minimize the interaction between the adjacent periodic images. The cutoff energy for the plane-wave expansion is set at 500 eV after extensive convergence analysis. The Brillouin zone (BZ) is sampled using a 3 × 3 × 1 gamma-centered Monkhorst–Pack grid. The valence electron configurations in this calculation are Mo 4p6 4d5 5s1, S 3s2 3p4, Fe 3d6 4s2, Co 3d7 4s2, Ni 3d8 4s2, Ru 4d7 5s1, Rh 4d8 5s1, Pd 4d10, Os 5d6 6s2, Ir 5d7 6s2, and Pt 5d8 6s2, respectively. All of the structures are fully relaxed using the conjugate gradient method, and during the structural relaxation, the energy convergent criterion is 10−6 eV per unit cell, and the forces on all relaxed atoms are less than 0.02 eV Å−1.Results and discussion
A. Tendency of the formation energy
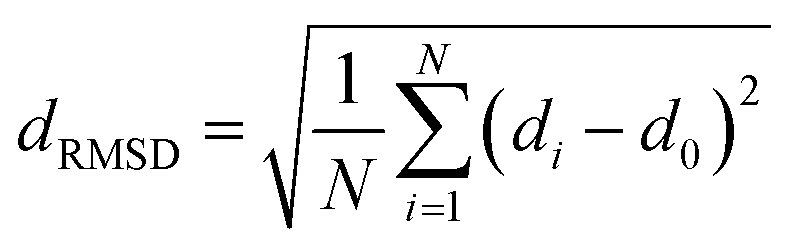
The fully relaxed lattice constant of monolayer MoS2 is 3.19 Å and the Mo–S bond length is 2.42 Å, which agrees with the experimental value (3.16 Å).22 Defects play an important role in the electronic and magnetic properties of materials. Doping atoms or vacancies in 1H-MoS2 are introduced by replacing or removing a single host atom in the pristine system. In this paper, we mainly consider the G8 atoms as impurities to substitute a host Mo atom in both host materials. For the doped pristine 1H-MoS2, the Mo atoms are replaced by impurity atoms, represented as Mo15XS32 (X = Fe, Co, Ni, Ru, Rh, Pd, Os, Ir, or Pt). Structure relaxation shows that the distances between the 3d atoms (Fe, Co, and Ni) and the adjacent three S atoms are roughly similar and slightly shorter than the original Mo–S bond length. For the 4d and 5d atoms, the larger the number of extranuclear electrons, the longer the bond length. For the doped defective 1H-MoS2, the configurations are marked as Mo15XS31-A, B, C, D, or E according to the distance between the dopant and the S vacancy, as shown in Fig. 1. The maximum displacement of the dopant and the S vacancy is 7.53 Å (pristine Mo15XS31-D) and the minimum is 2.42 Å (pristine Mo15XS31-A). This corresponds to simulating a Mo1−xAxS2−y periodic system with x = 6.25% (y = 3.13%). Furthermore, to characterize the deviation of the impurity atom from the original Mo position, we calculated the root-mean-square deviation (RMSD) of the X–S bond length using the following formula:
 | (1) |
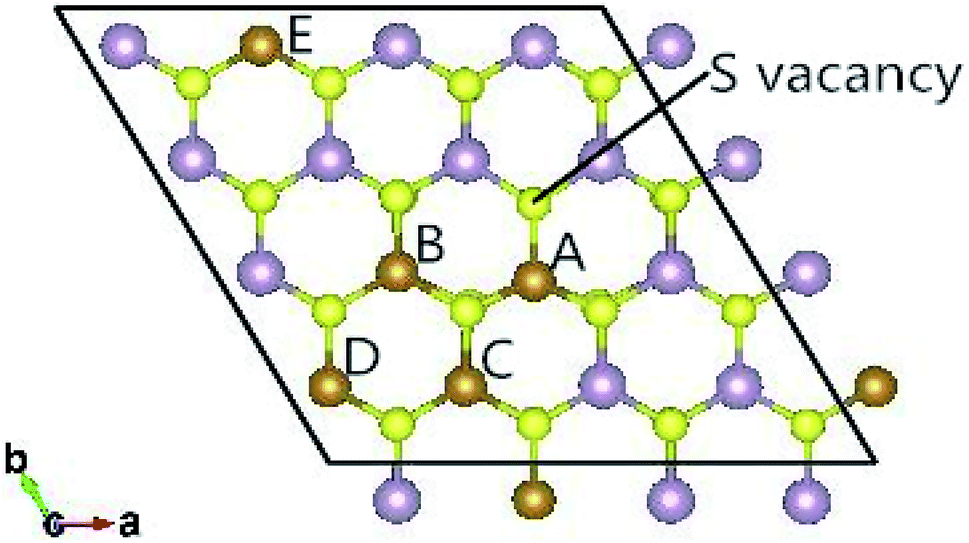 | ||
| Fig. 1 Top view of the 4 × 4 × 1 supercell of the defective 1H-MoS2 impurities. Five configurations are taken into account in this work and marked as Mo15XS31-A, B, C, D, or E according to the distance between the dopant and S vacancy. | ||
| Doped-atom | Configuration | dRMSD (Å) | Eform (eV) | Mtot (μB) | Q (e) | Eg (eV) | |
|---|---|---|---|---|---|---|---|
| Mo-rich | S-rich | ||||||
| Fe | Mo15FeS32 | 0.121 | 2.64 | −0.06 | 2.00 | 6.95 | 0.30 |
| Mo15FeS31-A | 0.152 | 6.61 | 5.26 | 0 | 7.11 | 0.33 | |
| Mo15FeS31-B | 0.117 | 7.79 | 6.44 | 2.00 | 6.99 | 0.19 | |
| Mo15FeS31-C | 0.113 | 7.80 | 6.45 | 2.00 | 7.00 | 0.27 | |
| Mo15FeS31-D | 0.118 | 7.76 | 6.41 | 2.00 | 6.98 | 0.37 | |
| Mo15FeS31-E | 0.119 | 7.82 | 6.47 | 2.00 | 6.98 | 0.27 | |
| Co | Mo15CoS32 | 0.120 | 3.91 | 1.21 | 3.00 | 8.23 | 0.18 |
| Mo15CoS31-A | 0.169 | 7.19 | 5.84 | 1.00 | 8.32 | 0.21 | |
| Mo15CoS31-B | 0.122 | 9.05 | 7.70 | 3.00 | 8.21 | 0.24 | |
| Mo15CoS31-C | 0.444 | 8.66 | 7.29 | 1.00 | 8.29 | 0.28 | |
| Mo15CoS31-D | 0.134 | 8.97 | 7.68 | 1.00 | 8.24 | 0.22 | |
| Mo15CoS31-E | 0.118 | 9.09 | 7.74 | 3.00 | 8.22 | 0.11 | |
| Ni | Mo15NiS32 | 0.029 | 4.72 | 2.22 | 0 | 9.35 | 0.28 |
| Mo15NiS31-A | 0.175 | 7.82 | 6.47 | 0 | 9.37 | 0.43 | |
| Mo15NiS31-B | 0.034 | 9.75 | 8.74 | 0 | 9.37 | 0.15 | |
| Mo15NiS31-C | 0.030 | 9.57 | 8.57 | 0 | 9.36 | 0.30 | |
| Mo15NiS31-D | 0.411 | 9.70 | 8.35 | 0 | 9.35 | 0.27 | |
| Mo15NiS31-E | 0.031 | 9.88 | 8.74 | 0 | 9.35 | 0.27 | |
| Ru | Mo15RuS32 | 0.032 | 3.05 | 0.35 | 2.00 | 7.14 | 0.17 |
| Mo15RuS31-A | 0.067 | 6.54 | 5.19 | 0 | 7.32 | 0.57 | |
| Mo15RuS31-B | 0.039 | 7.90 | 6.60 | 0 | 7.19 | 0.34 | |
| Mo15RuS31-C | 0.037 | 7.96 | 6.61 | 0 | 7.20 | 0.26 | |
| Mo15RuS31-D | 0.046 | 7.92 | 6.57 | 0 | 7.18 | 0.38 | |
| Mo15RuS31-E | 0.048 | 8.04 | 6.69 | 0 | 7.18 | 0.23 | |
| Rh | Mo15RhS32 | 0.033 | 4.17 | 1.47 | 1.00 | 8.39 | 0.03 |
| Mo15RhS31-A | 0.060 | 7.22 | 5.87 | 1.00 | 8.52 | 0.19 | |
| Mo15RhS31-B | 0.293 | 8.98 | 7.63 | 1.00 | 8.47 | 0.28 | |
| Mo15RhS31-C | 0.415 | 8.72 | 7.23 | 1.00 | 8.49 | 0.20 | |
| Mo15RhS31-D | 0.038 | 9.09 | 7.74 | 1.00 | 8.40 | 0.15 | |
| Mo15RhS31-E | 0.035 | 9.21 | 7.86 | 1.00 | 8.41 | 0.10 | |
| Pd | Mo15PdS32 | 0.298 | 5.03 | 2.33 | 0 | 9.58 | 0.30 |
| Mo15PdS31-A | 0.058 | 8.28 | 6.93 | 0 | 9.60 | 0.49 | |
| Mo15PdS31-B | 0.347 | 10.08 | 8.73 | 2.00 | 9.59 | 0.19 | |
| Mo15PdS31-C | 0.355 | 9.86 | 8.51 | 0 | 9.59 | 0.42 | |
| Mo15PdS31-D | 0.356 | 10.08 | 8.73 | 0 | 9.58 | 0.28 | |
| Mo15PdS31-E | 0.358 | 10.12 | 8.77 | 0 | 9.57 | 0.27 | |
| Os | Mo15OsS32 | 0.031 | 3.59 | 0.89 | 2.00 | 7.06 | 0.12 |
| Mo15OsS31-A | 0.065 | 7.08 | 5.73 | 0 | 7.30 | 0.58 | |
| Mo15OsS31-B | 0.035 | 8.26 | 6.91 | 0 | 7.14 | 0.40 | |
| Mo15OsS31-C | 0.026 | 8.43 | 7.08 | 2.00 | 7.15 | 0.21 | |
| Mo15OsS31-D | 0.043 | 8.36 | 7.01 | 0 | 7.11 | 0.35 | |
| Mo15OsS31-E | 0.044 | 8.50 | 7.15 | 0 | 7.11 | 0.16 | |
| Ir | Mo15IrS32 | 0.032 | 4.38 | 1.68 | 1.00 | 8.44 | — |
| Mo15IrS31-A | 0.059 | 7.46 | 6.11 | 1.00 | 8.60 | 0.23 | |
| Mo15IrS31-B | 0.048 | 9.21 | 7.86 | 1.00 | 8.48 | 0.35 | |
| Mo15IrS31-C | 0.032 | 9.19 | 7.84 | 1.00 | 8.50 | 0.19 | |
| Mo15IrS31-D | 0.038 | 9.22 | 7.87 | 1.00 | 8.46 | 0.11 | |
| Mo15IrS31-E | 0.040 | 9.36 | 8.01 | 1.00 | 8.47 | 0.09 | |
| Pt | Mo15PtS32 | 0.322 | 4.98 | 2.28 | 0 | 9.68 | 0.32 |
| Mo15PtS31-A | 0.055 | 8.14 | 6.79 | 0 | 9.72 | 0.58 | |
| Mo15PtS31-B | 0.373 | 9.85 | 8.50 | 0 | 9.70 | 0.36 | |
| Mo15PtS31-C | 0.372 | 9.77 | 8.42 | 0 | 9.71 | 0.45 | |
| Mo15PtS31-D | 0.392 | 9.93 | 8.58 | 0 | 9.68 | 0.27 | |
| Mo15PtS31-E | 0.393 | 9.95 | 8.60 | 0 | 9.67 | 0.28 | |
In order to inspect the stability and feasibility of all optimized geometrical structures, the formation energies were obtained utilizing the following formula:23–25
| Eform = Edoped − Epure + (μMo − μG8) + μS | (2) |
| Eform(MoS2) = μMoS2 − μ0Mo − 2μ0S | (3) |
The values of μMo and μS in eqn (2) depend on the experimental growth conditions. For the Mo-rich case, the Mo chemical potential is equal to the bulk Mo value, μMo-richMo = μ0Mo, and the S chemical potential can be obtained from μMoS2 = μMo + 2μS on the basis of thermodynamic equilibrium. Hence, combined with eqn (3), the chemical potentials for the Mo-rich limit can then be written as:
| μMo-richMo = μ0Mo, | (4) |
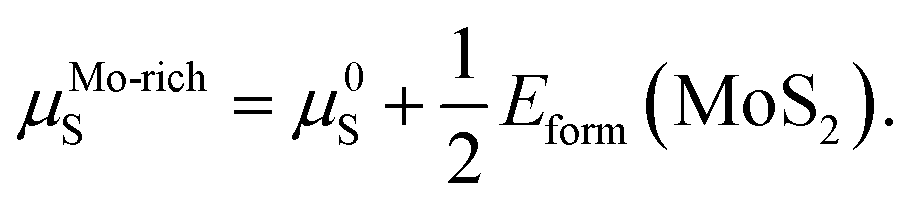 | (5) |
Likewise, under S-rich conditions, the values are:
| μS-richMo = μ0Mo + Eform(MoS2), | (6) |
| μS-richS = μ0S. | (7) |
All of the formation energies are listed in Table 1.
Monolayer MoS2 with a single S vacancy (VS) or Mo vacancy (VMo) was fully relaxed. The optimized structure shows that the neighboring Mo and S atoms have slight displacements with respect to the vacancy site VS and VMo, which is different from the obvious reconstruction in a graphene sheet with a single C vacancy.27 For VS-MoS2, this is more likely to occur under S-rich conditions and the formation energy is 6.57 eV, which in agreement with the previous values of 5.89 (ref. 28) and 5.72 eV,7 is much lower than the formation energy of the Mo vacancy VMo (14.09 eV) in Mo-rich conditions. The previous studies have reported that the substitution of an Mo site is more stable than that of an S site.7,29 Experimentally, S vacancies are more common than Mo vacancies.30 Therefore, in this paper, the co-doped configurations mainly consist of an S vacancy and G8 impurity substitution of an Mo site. The C3v symmetry of pristine monolayer MoS2 is destroyed after G8 element doping, and the distances between the impurities and the nearest S atom change with different distributions of the dopants and the vacancy. All the calculated formation energies are summarized in Table 1. The distances between the dopants atoms and the S vacancy are taken from their original positions in pristine 1H-MoS2. Fig. 2 shows our calculated formation energies as a function of the distance between the S vacancy and dopant atoms, which varies from 2.42 to 7.53 Å. The first data “0” represents the doped MoS2 without an S vacancy. According to our theoretical results, Fe doping is most favorable energetically among all considered impurities. For all of the G8 elements, the formation energies from the doped defective 1H-MoS2 configurations of the second-, third-, fourth-, and fifth-nearest neighbor are very close, and are 1.50 eV larger than the corresponding nearest neighboring case. The relevant data for the Co atom are consistent with ref. 31.
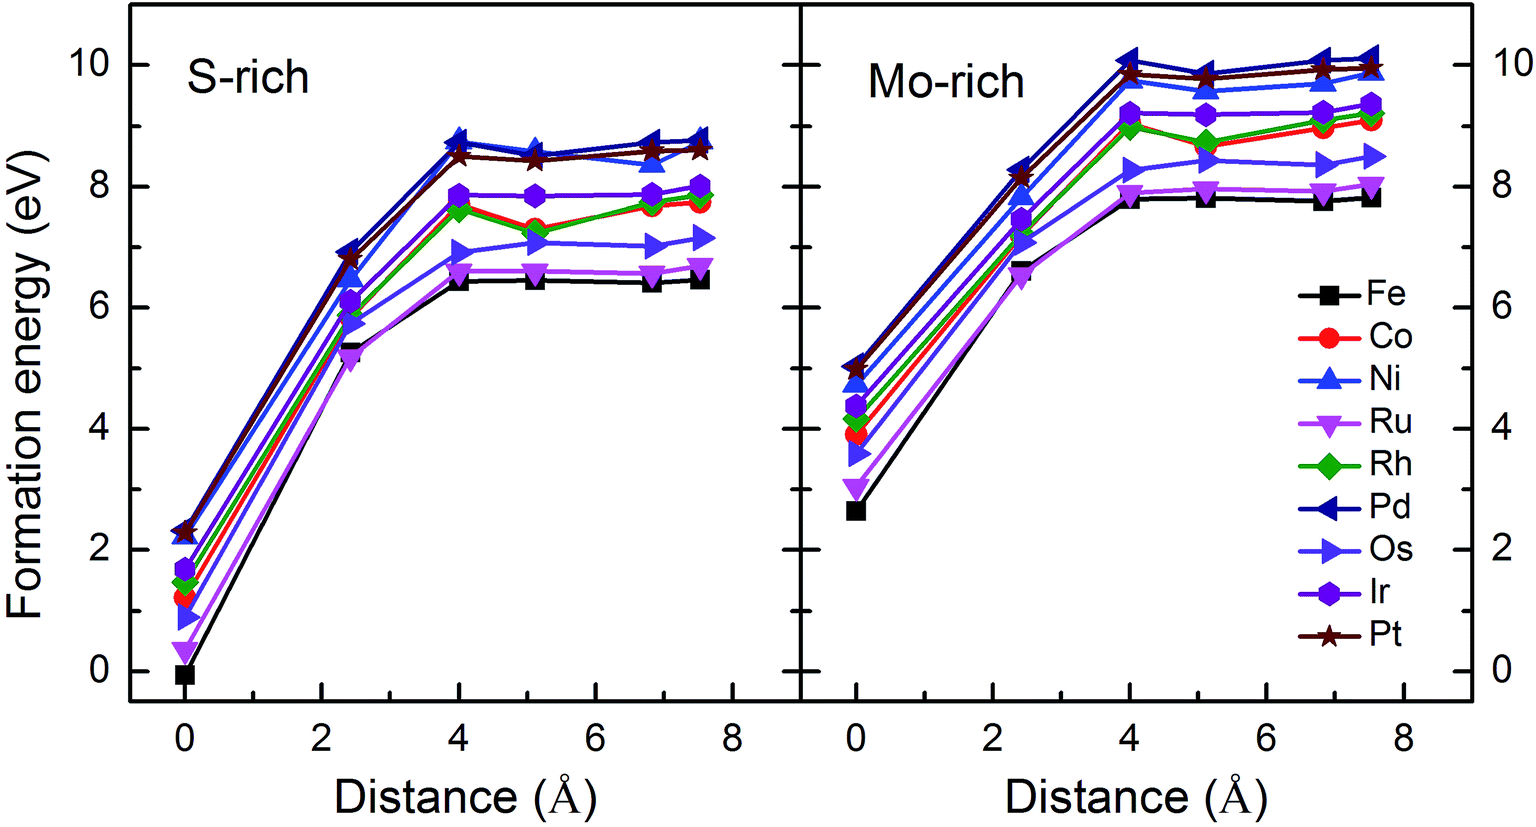 | ||
| Fig. 2 Formation energies as a function of the distance between the S vacancy and impurity atoms in S-rich and Mo-rich conditions. | ||
The positive formation energy indicates that the formation of the vacancy defect and the doping of the transition metal are endothermic processes. The equilibrium concentrations of the vacancies are usually very low because of their high formation energies. Nonetheless, new techniques have been developed to create these defects. The generation of nanomesh size vacancies in graphene has been reported.32,33 Vacancy engineering of a doped MoS2 monolayer can also be achieved.
B. Magnetic properties
It is known that MoS2 has D3h symmetry and the d-orbitals have a schematic band structure with a d2 configuration of the metal atom, as shown in Fig. 3. The two valence electrons of the Mo ion occupy the lowest dz2 orbital, which is the reason for the lack of magnetism for MoS2. In our case, the sulfur atom vacancy introduces two defective bands in the band gap region, which mainly consists of the “unsaturated” d orbitals of Mo atoms. The relatively large energy gap of MoS2 can almost accommodate the five d states of TM magnetic impurities. Therefore, about seven defective bands may appear in the forbidden gap region of the pristine bands when the doped G8 atoms are incorporated with an S vacancy. The magnetic properties mainly depend on the correlation between these defective bands.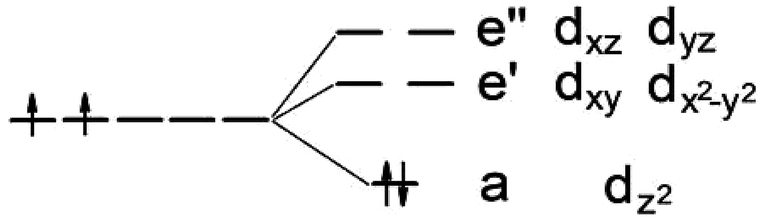 | ||
| Fig. 3 Ligand field picture and corresponding d-orbitals for a trigonal prismatic coordination (D3h symmetry) in a d-metal dichalcogenide with a d2 configuration of the metal atom. | ||
The Fe case, which corresponds to the d4 configuration, is likely to have a net magnetic moment of 2μB, except for the A case. In the nearest configuration, the interaction between the Fe and the S vacancy (the unsaturated Mo atoms) leads to strong crystal field splitting between the dz2, dxy, and dx2−y2 orbitals, which causes the system to become a small band gap semiconductor. Among all of the five pristine dopant-vacancy configurations, the B and E cases have more symmetry and the vertical mirror plane is preserved. It is important for the system to keep the energy levels of the hybridized states below the Fermi level in the close energy range. This can explain the net magnetic moment of the B and E cases of Fe, and Co. On the other side, the C and D cases are more likely to have zero magnetic moment. Our results also indicate that local stress appears to be a crucial factor in the development of magnetism as Jahn–Teller distortions that destroy the C3v lattice symmetry lead to the disappearance of magnetism. For the Fe and Co cases, the C and D configurations may also have a net magnetic moment because of the coupling between the defective d orbital of the unsaturated Mo atoms and the lower dxy, dx2−y2, and dz2 orbitals of the impurity atom.
For 4d or 5d dopants such as the Ru-doped cases, only the structure of mono-doped Mo15RuS31 generates a 2μB magnetic moment. The origin of the magnetism is attributed to the near degeneracy of the Ru dx2−y2 and dz2 orbitals. The Os-doping has similar characteristics to the Ru doped cases. For the Pd-doping, only the Mo15PdS31-B structure generates a 2μB magnetic moment. For the Rh- and Ir-doping, all of the structures generate a 1μB magnetic moment. For the Pt-doping structures, all are nonmagnetic. Taken as a whole, the net magnetic moments from the 3d elements are larger than those from the 4d and 5d elements, because strongly localized 3d orbitals are more likely to induce net magnetic moments due to strong Hund coupling, which competes with the ligand field energy splitting.
Furthermore, the ligand field energy splitting is connected with the distortion of the local structure around the dopants. The root-mean-square deviations of the X–S bonds have been obtained to quantify the local deformation caused by the dopants and are listed in Table 1. The results clearly show that the RMSDs of the models with smaller magnetic moments are much larger, which means a larger deviation from C3v symmetry. This rule holds for the Fe, Co and Os cases.
To verify our results, the DFT+U method was also used. It was found that the magnetic properties with the GGA+U method are consistent with the results without the Hubbard-U parameter. The results with the corresponding U values are shown in ESI Table S1.† There is no relevant influence on our conclusions and therefore we discuss in the following the results without on-site interaction.
The system is stabilized by charge transfer. The Bader charge has also been obtained to analyze the charge transfer between the G8 atoms and MoS2, as shown in Table 1. In a perfect 1H-MoS2, the formal valences of Mo and S are +4 and −2, respectively. Since a Mo has six S neighbors, it contributes 2/3 electrons to each Mo–S covalent bond. Therefore, the charge transfer of the S and Mo atoms is approximately +0.67e and −1.33e, respectively. Taking Fe-doped 1H-MoS2 as an example, in the monodoping case, the charge number of Fe will be 8 − 2 × 2/3 = 6.67 (8 is the valence electron number of Fe treated by the PBE pseudopotential). It will be 8 − 5/3 × 2/3 = 6.89 when one S atom is removed. The theoretical charge numbers of Ru and Os are equal to that of Fe due to their similar valence electron numbers. For the other G8 elements, the two values for mono- and co-doping are 7.67 and 7.89 for Co, Rh and Ir, and 8.67 and 8.89 for Ni, Pd and Pt. The more the Bader charge deviates from the ideal charge number, the more electron transfer there is from the host ions to the dopant ion (Fig. 4).
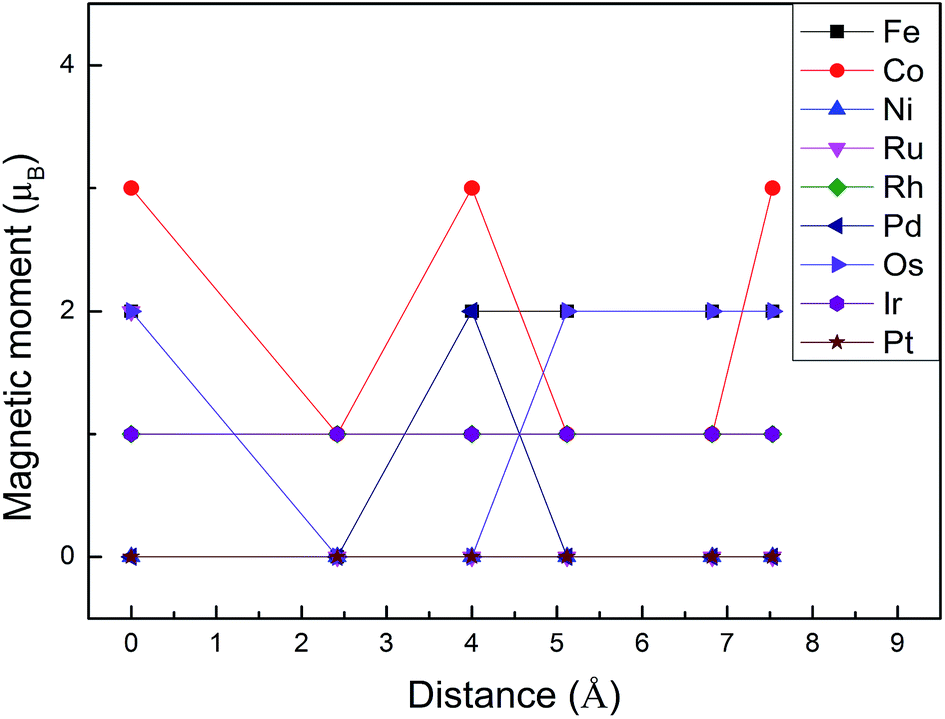 | ||
| Fig. 4 Summary of the magnetic moments for all G8-doped 1H-MoS2 systems. | ||
In order to understand the characteristics of the magnetic moment induced by impurity states in the G8-doped 1H-MoS2 systems, the spin density distribution is plotted to visualize the distribution of the magnetic moments of the doped 1H-MoS2 systems in Fig. 5. Taking Fe-doped 1H-MoS2 as an example, Fig. 5(a)–(f) show that the spatial extensions of the spin polarizations have reached the first-nearest S atoms and the second-nearest Mo atoms. The structure Mo15FeS32 displays weak ferromagnetic and antiferromagnetic coupling between Fe and three neighboring S atoms, and ferromagnetic coupling among the six second-nearest Mo atoms. Fig. 5(b) shows the nearest configuration of the co-doping system, which is typical for the no magnetism case. The antiferromagnetic alignment of d electrons is observed.
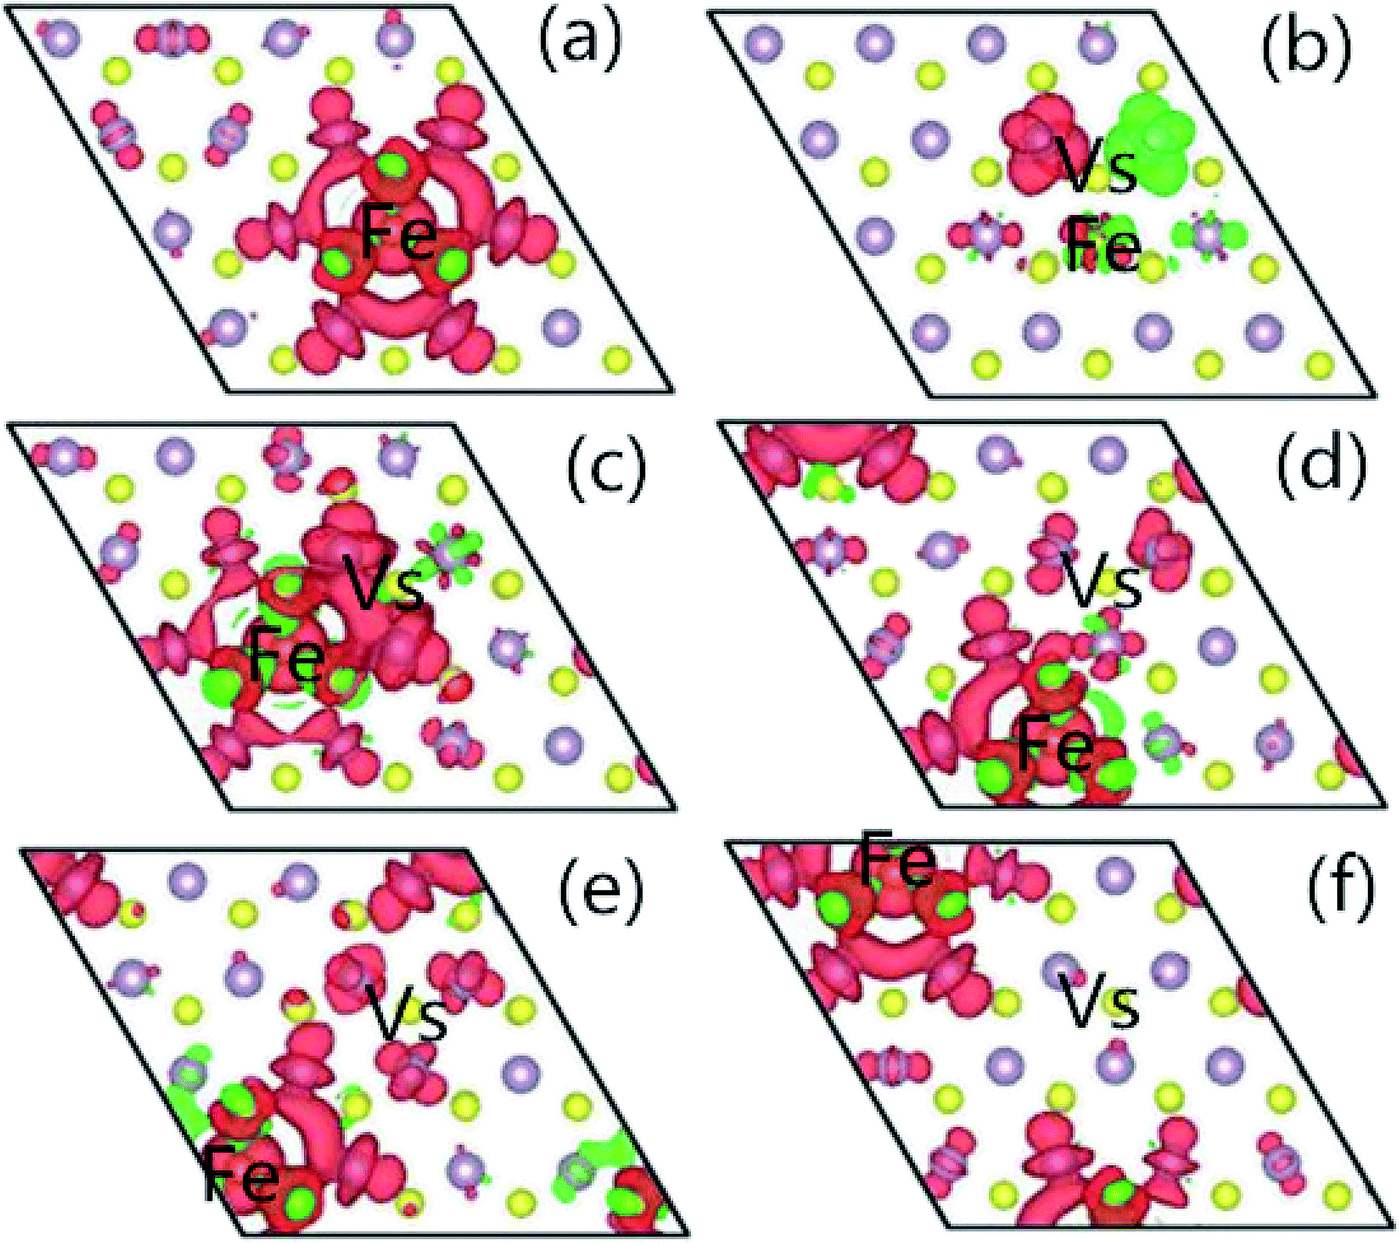 | ||
| Fig. 5 The spatial distribution of the spin density for (a) Mo15FeS32, (b) Mo15FeS31-A, (c) Mo15FeS31-B, (d) Mo15FeS31-C, (e) Mo15FeS31-D, and (f) Mo15FeS31-E. The S, Mo, and Fe atoms are denoted by yellow, purple, and dark yellow spheres, respectively. The red isosurface corresponds to the spin-up density, and the green one represents the spin-down density. | ||
C. Estimation of the Curie temperature
The Curie temperature (TC) values can be roughly estimated from the mean-field expression34 using the relation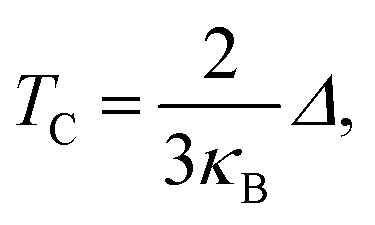 where κB is the Boltzmann constant and Δ is the difference in the supercell total energy between the antiparallel and parallel alignments. The results are listed in Table 2. Our theoretical results show that Fe, Co, Ru, Rh, Os and Ir-doped MoS2 are candidates for room-temperature ferromagnetic materials in DMSs. It is should also be noticed that the mean field approximation used in this paper is known to overestimate the Curie temperature.35 Nevertheless, a high Δ will imply a high TC and the trends presented here should hold.
| Mo15XS32 | Mo15XS31-A | Mo15XS31-B | Mo15XS31-C | Mo15XS31-D | Mo15XS31-E | ||
|---|---|---|---|---|---|---|---|
| Fe | Δ | 0.209 | — | 0.138 | 0.037 | 0.053 | 0.175 |
| TC | 1614 | — | 1106 | 284 | 410 | 1352 | |
| Co | Δ | 0.110 | 0.060 | 0.114 | 0.072 | 0.060 | 0.027 |
| TC | 850 | 462 | 882 | 556 | 464 | 208 | |
| Ru | Δ | 0.125 | — | — | — | — | — |
| TC | 966 | — | — | — | — | — | |
| Rh | Δ | 0.026 | 0.099 | 0.070 | 0.050 | 0.039 | 0.026 |
| TC | 200 | 766 | 542 | 386 | 302 | 200 | |
| Pd | Δ | — | — | 0.010 | — | — | — |
| TC | — | — | 78 | — | — | — | |
| Os | Δ | 0.088 | — | — | 0.032 | — | — |
| TC | 680 | — | — | 248 | — | — | |
| Ir | Δ | 0.022 | 0.053 | 0.090 | 0.055 | 0.031 | 0.017 |
| TC | 170 | 410 | 696 | 426 | 240 | 132 | |
D. Density of states
To gain further insight into the emergent magnetic behavior, the total density of states (TDOS) and projected density of states (PDOS) of all of the models are shown, which also provides a specific description of the ground state electronic structure. The upper and lower panels denote the TDOS and PDOS, and positive and negative values represent spin-up and spin-down channels, respectively. The Fermi level is set at zero energy, which is indicated by black dotted lines, to easily identify the band gap and the relative position of the states from the impurity atoms. Fig. 6 shows the DOS and PDOS of pristine 1H-MoS2 and defective 1H-MoS2 with one S vacancy. We can see that both of them are nonmagnetic semiconductors with the spin-up and spin-down channels completely symmetrical, and the former opens a direct gap of 1.67 eV, agreeing with the experimental value (1.90 eV) as well as other calculation results (1.66 eV (ref. 31) and 1.67 eV (ref. 36)), while the latter shows an indirect band gap of 1.06 eV. After the removal of the S atom, new impurity states appear above the Fermi level, which are mainly from the 4d orbitals of Mo atoms.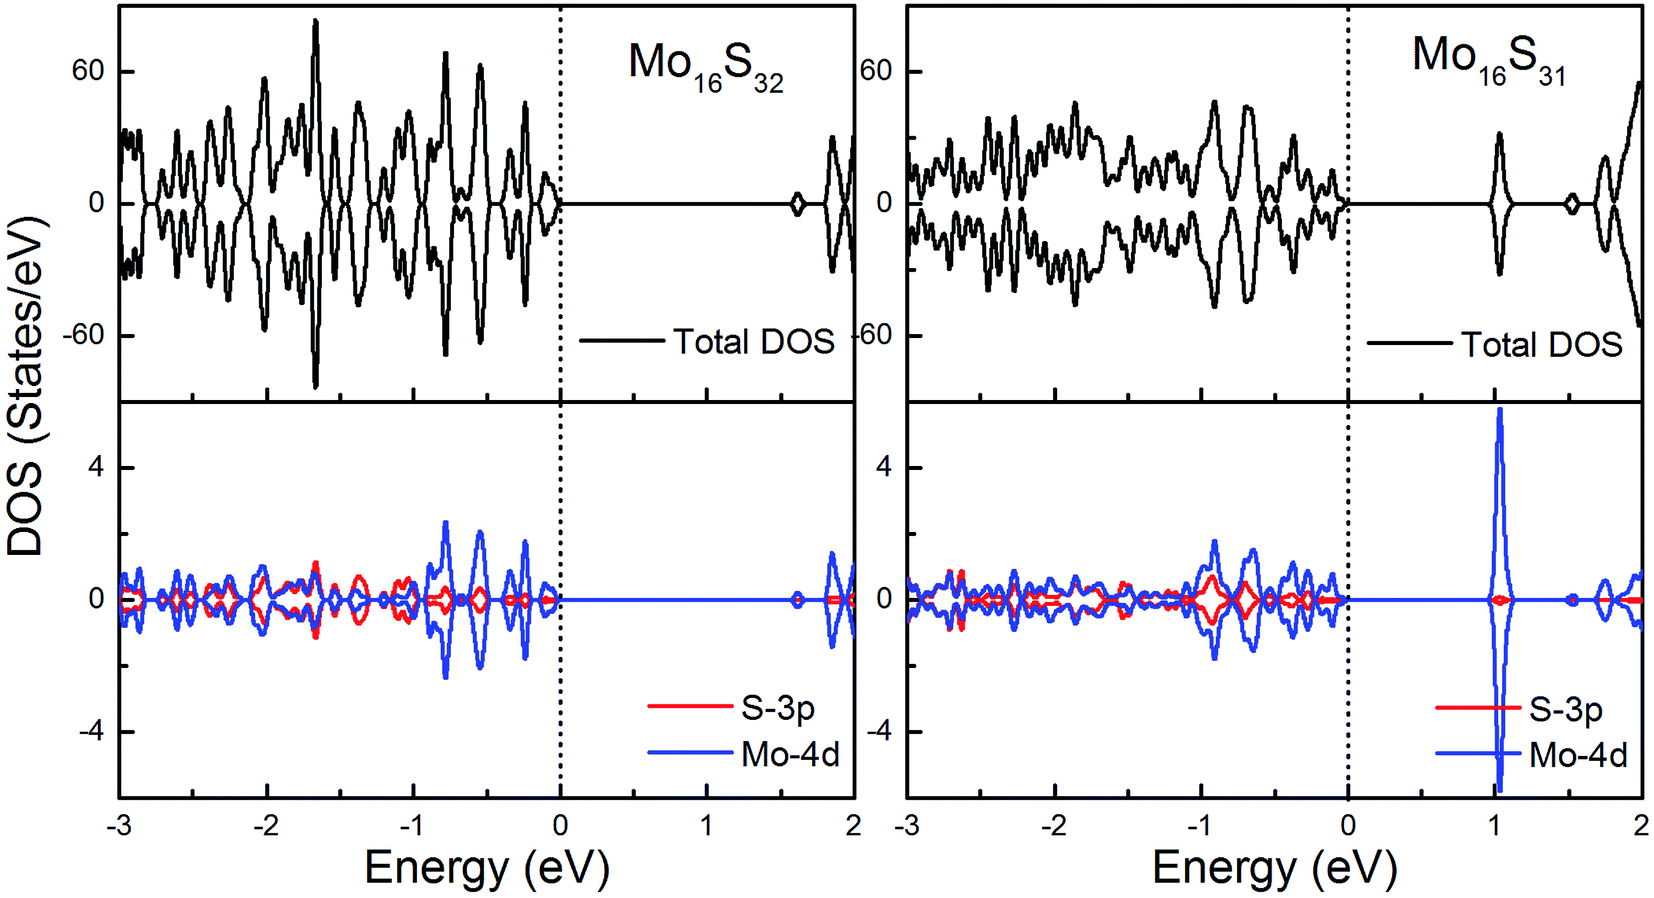 | ||
| Fig. 6 Total DOS and partial DOS for pristine 1H-MoS2 with and without S vacancies. The dashed line indicates the Fermi level at 0 eV. | ||
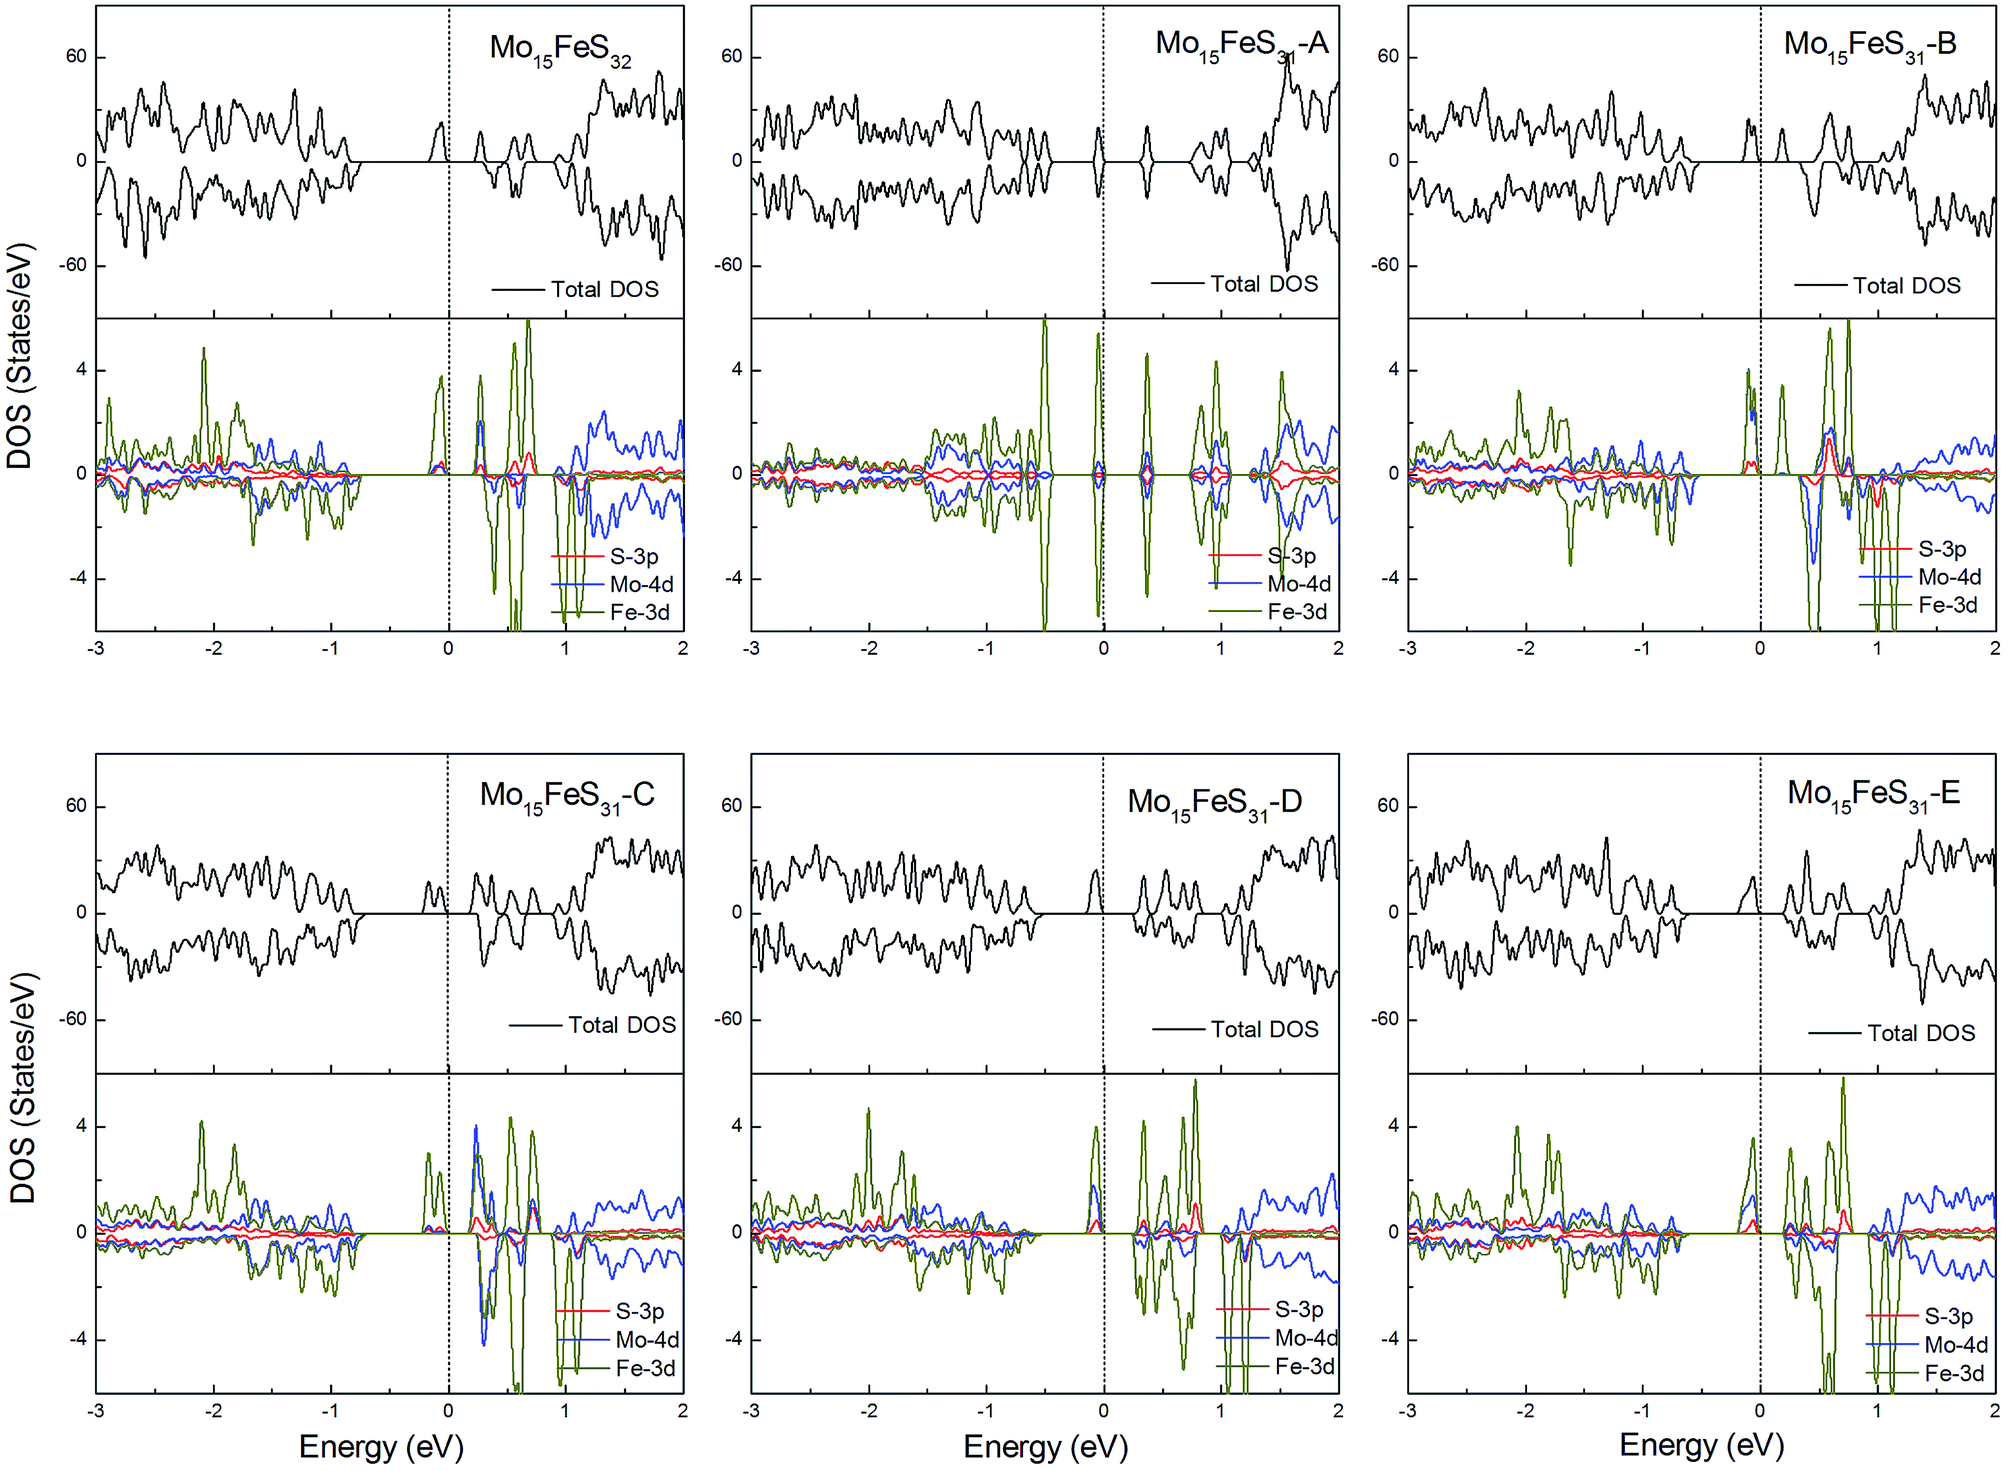
The density of states of all the Fe-doped MoS2 models are shown in Fig. 7. It can be found that the impurity states presented in the band gap region are mainly contributed by the Mo 4d, Fe 3d, and S 3p orbitals. All of these systems are ferromagnetic with net magnetic moments of 2μB, except for the structure Mo15FeS31-A, which is a nonmagnetic semiconductor with a 0.3 eV band gap. In configuration A, the largest deformation of the Fe atom can be found from visualizing the optimized structure, which results in the removal of the degeneracy of the 3d orbitals and leads to the formation of the localized hydride states near the valance bands. As for the five magnetic systems, as expected, the Fe dopant is a main contributor to the total magnetic moment. This feature applies to all G8 impurity-doped configurations in this calculation.
 | ||
| Fig. 7 Total DOS and partial DOS for each atomic species in the all Fe-doped 1H-MoS2. The dashed line indicates the Fermi level at 0 eV. | ||
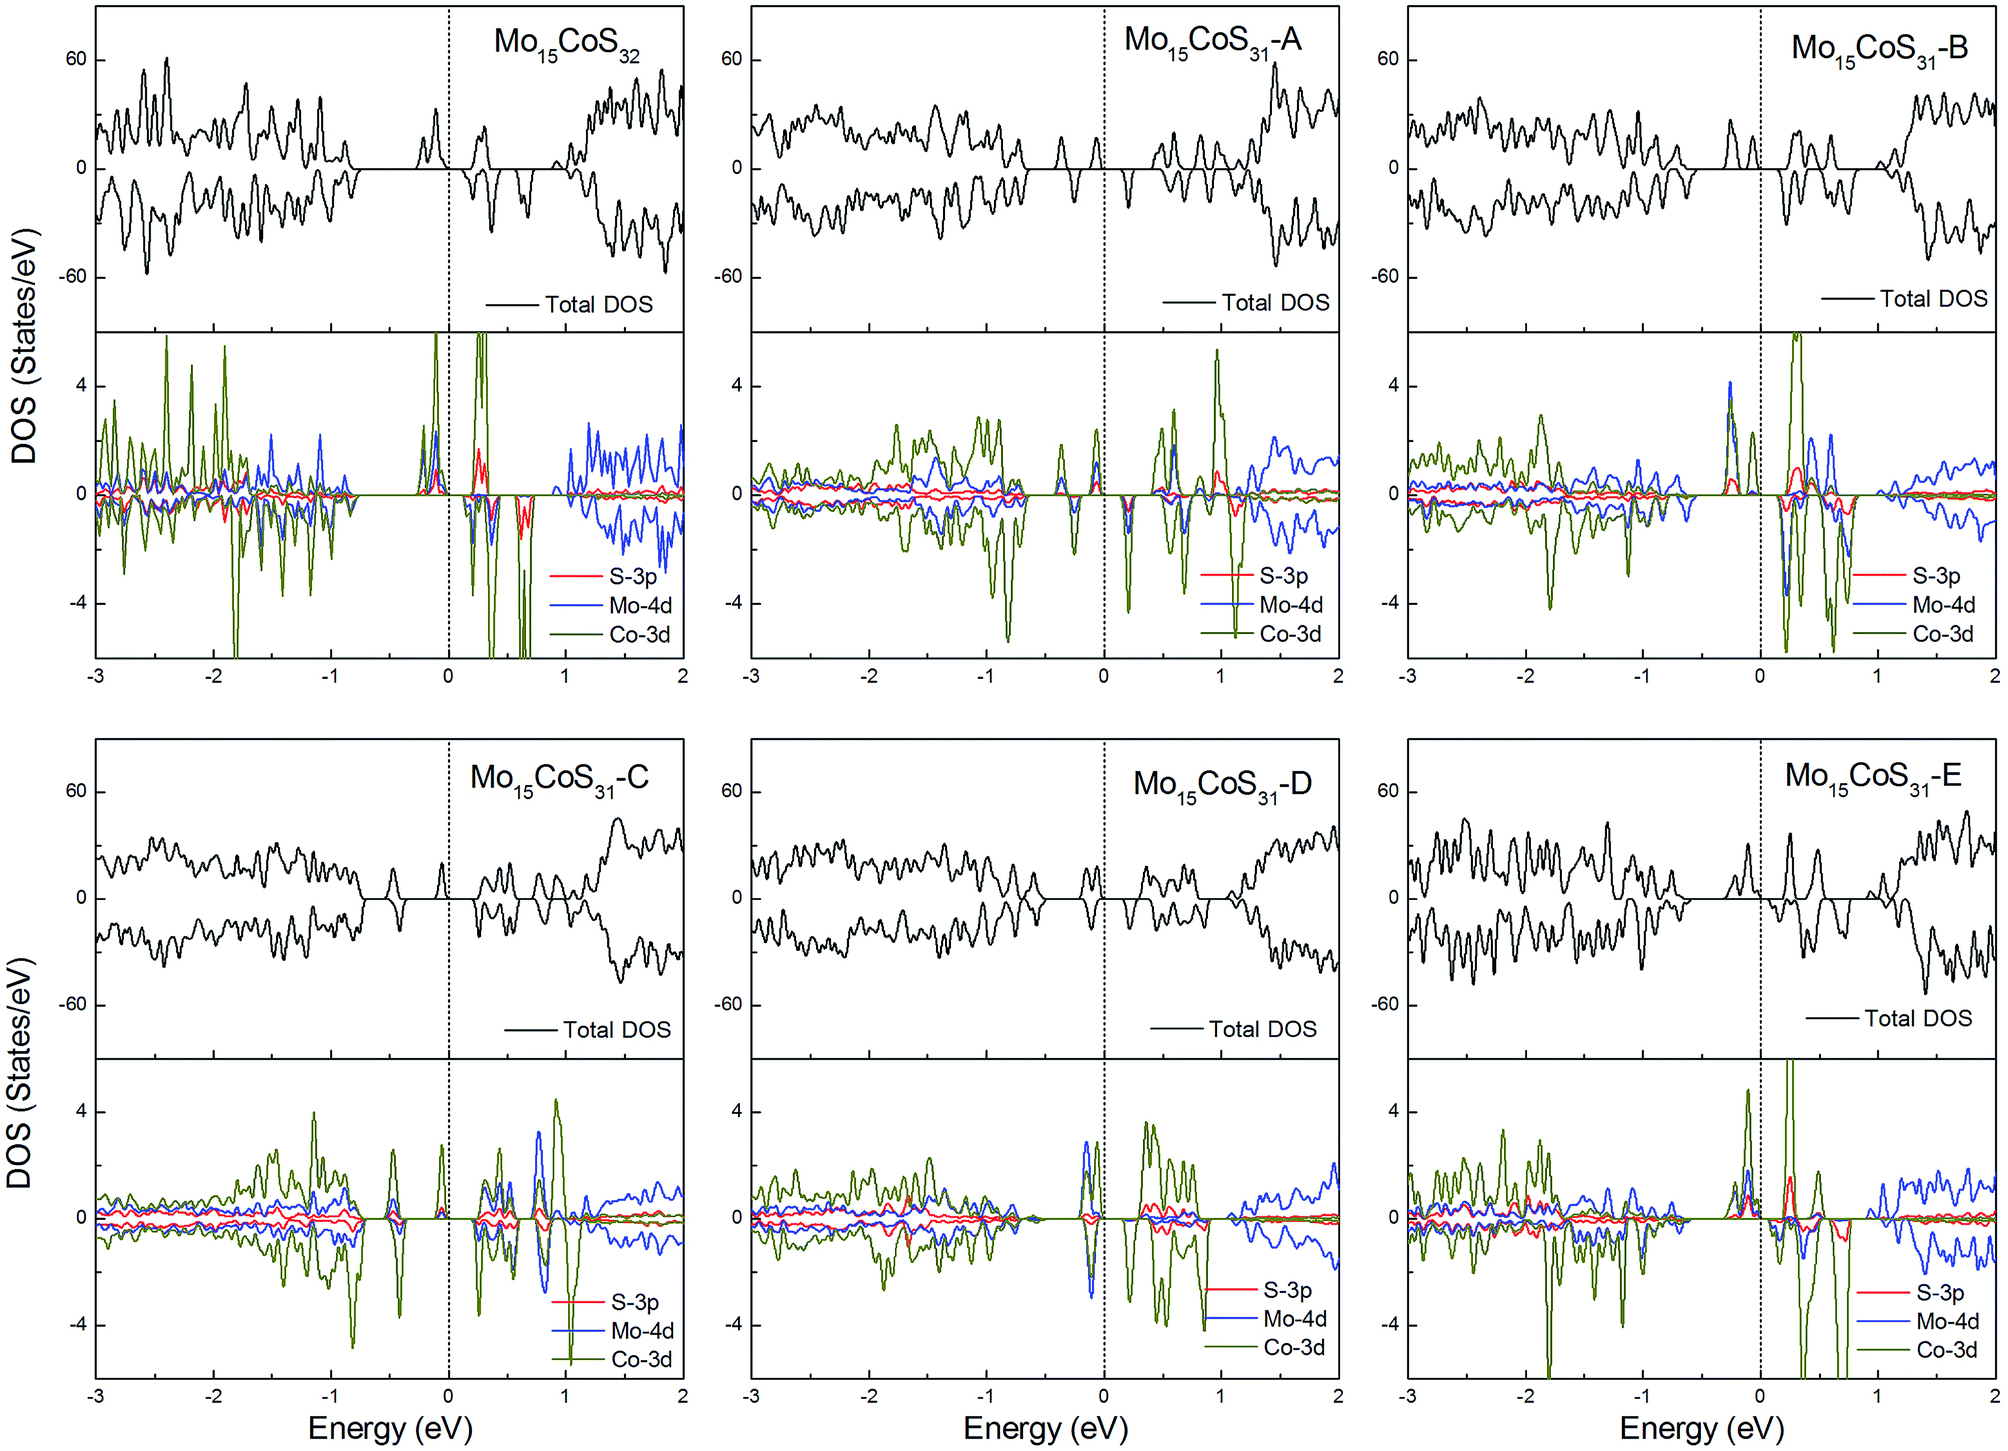
For the Co-doped cases, these systems have odd electrons. They are all ferromagnetic with a magnetic moment of 3 or 1μB. Unlike the Fe case, the correlation between the Co atom dopant and the S vacancy causes the impurity states to spread in the whole band gap region. Especially for the configurations Mo15CoS31-A and Mo15CoS31-D, the strong interaction between the Co–Mo–S pairs leads to the formation of a localized impurity state near the valance bands. The decrease in the magnetic moment can be attributed to the pairing of the electrons in this mixed orbital. In other words, the magnetic properties of the co-doped system depend on the competition between the ligand field splitting and the Hund coupling (Fig. 8).
 | ||
| Fig. 8 Total DOS and partial DOS for each atomic species in the all Co-doped 1H-MoS2. | ||
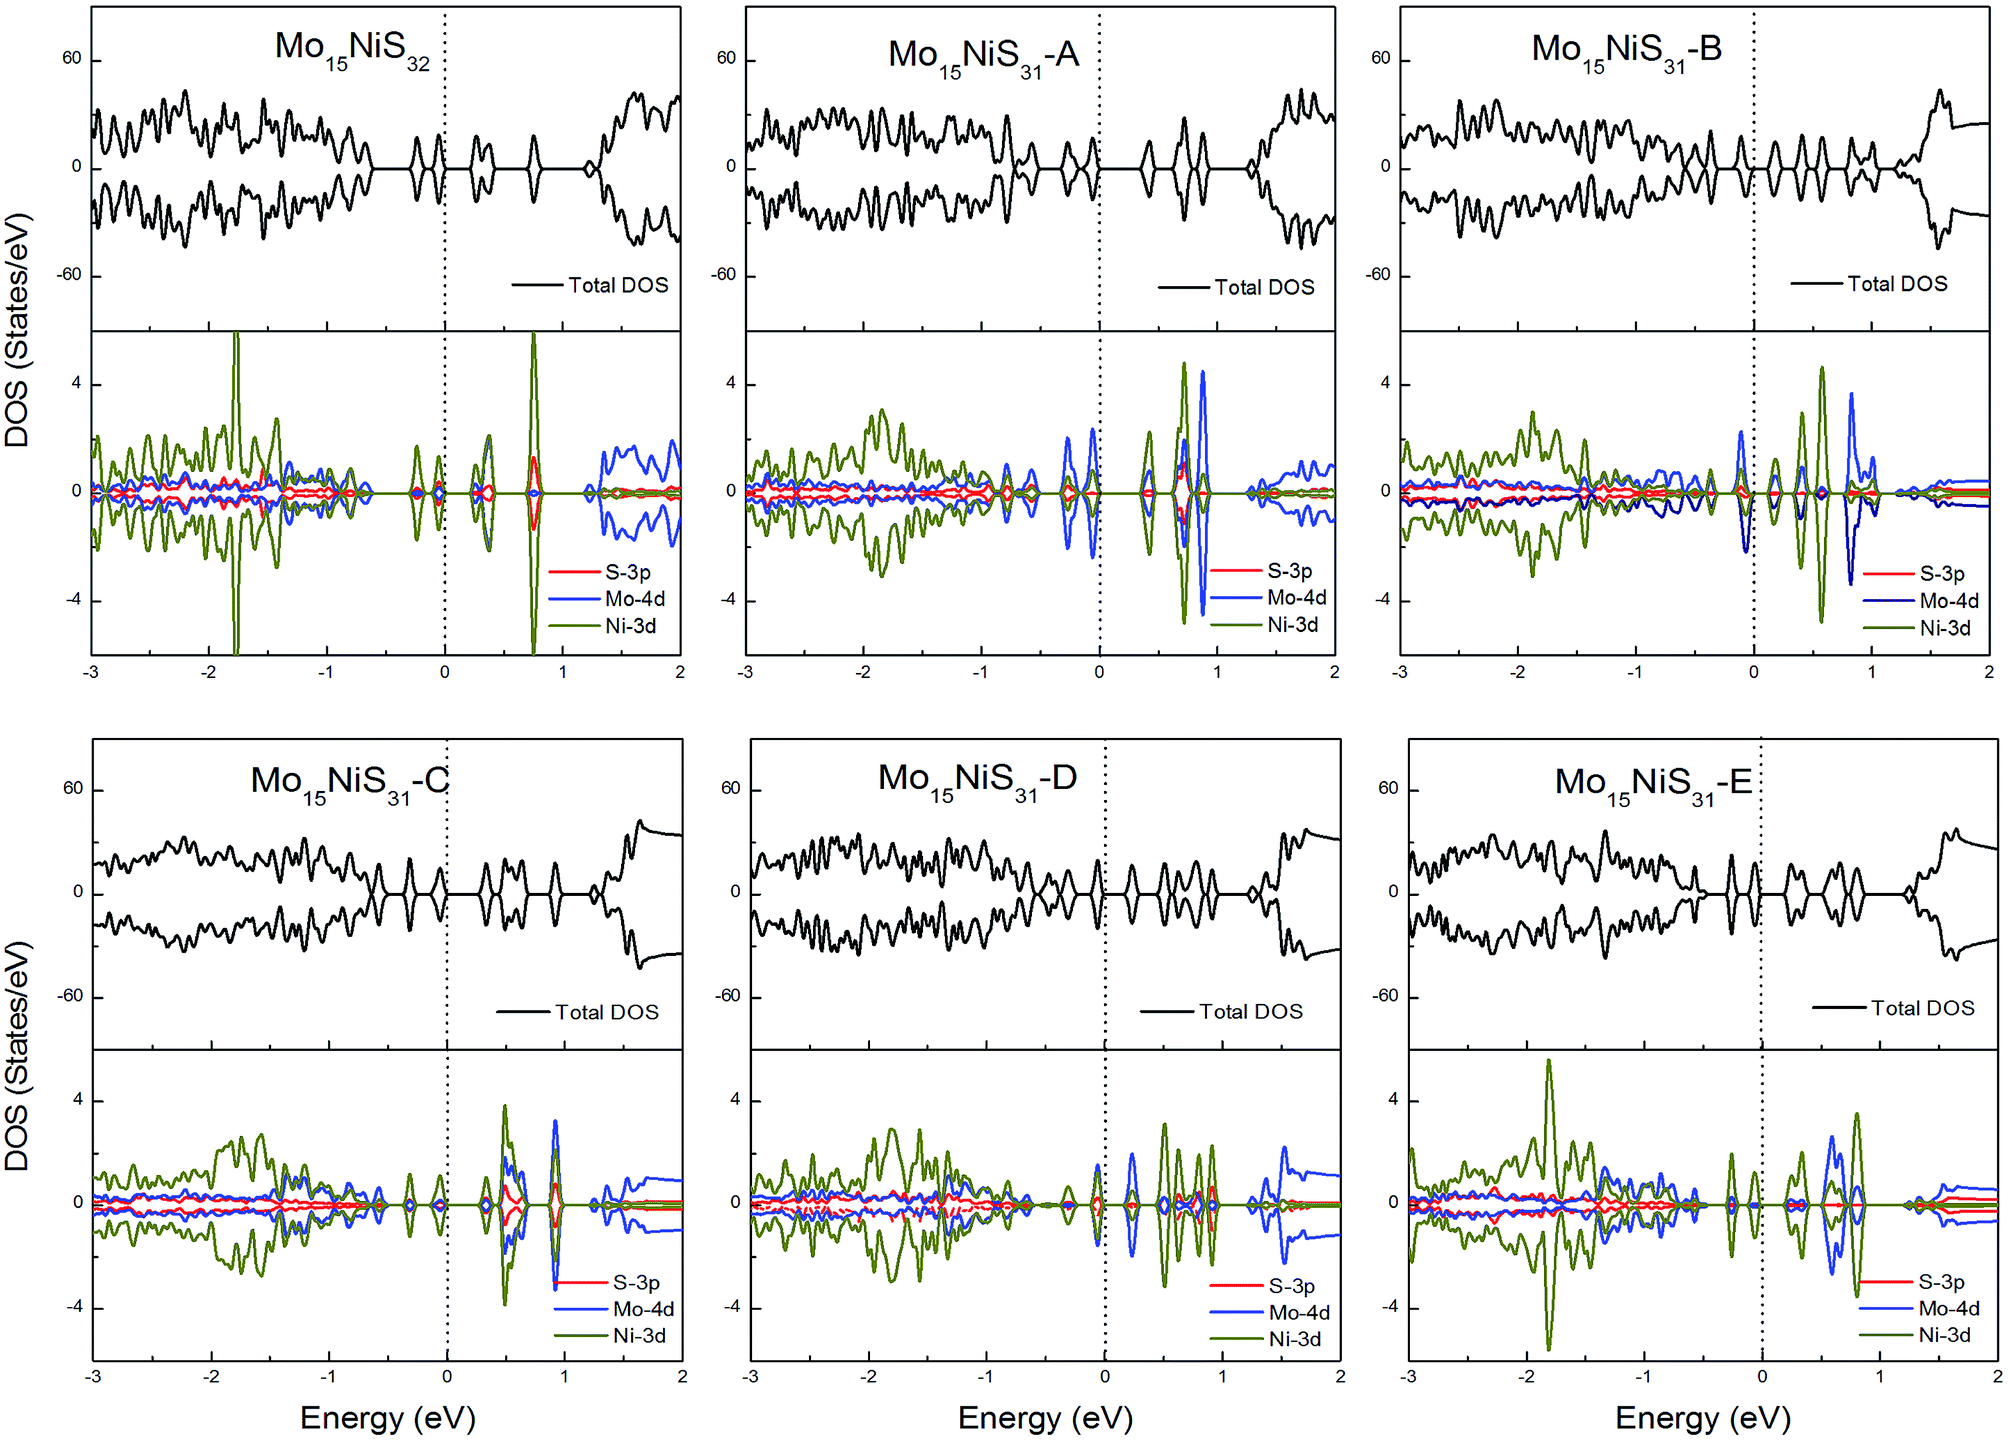
For Ni-doped 1H-MoS2 systems, there are 4 unpaired electrons remaining, which would lead to about a 4μB magnetic moment. But from our calculations, all of the ground states of the Ni-doped models are nonmagnetic semiconductors where the spin-up and spin-down channels are completely symmetrical and they possess tiny band gaps of 0.28, 0.43, 0.15, 0.30, 0.27, and 0.27 eV, respectively. The strong crystal field of neighboring Mo and S atoms leads to large energy splitting of the defective orbital. Therefore, four outer electrons form two electron pairs without the existence of isolated electrons. During our calculations, we found that the Mo15NiS32 and Mo15NiS31-B, C and E configurations would relax to transition states that have high magnetic order (net magnetic moment 4μB). These transition states are local minima which are 199, 341, 355, and 208 meV above the global minima. In a recent experimental study,9 the author reported that 4% Ni doped MoS2 has a paramagnetic phase at room temperature, and the paramagnetic phase may dominate at low temperature. Our theoretical results of the transition states with an S vacancy provide an explanation for this phenomenon (Fig. 9).
 | ||
| Fig. 9 Total DOS and partial DOS for each atomic species in the all Ni-doped 1H-MoS2. | ||
For the Ru-doped cases, substitution of Mo atoms by Ru increases the degree of p–d hybridization leading to a shift of the majority spin below the Fermi level. All configurations with the existence of S vacancies have semiconductor character with a band gap shown in Table 1, while the structure Mo15RuS32 is a magnetic semiconductor with a net magnetic moment of 2μB. The magnetism of Mo15RuS32 can be attributed to the formation of degenerated bands mainly consisting of the Ru dx2−y2 and dz2, Mo 4d and S 3p orbitals (Fig. 10).
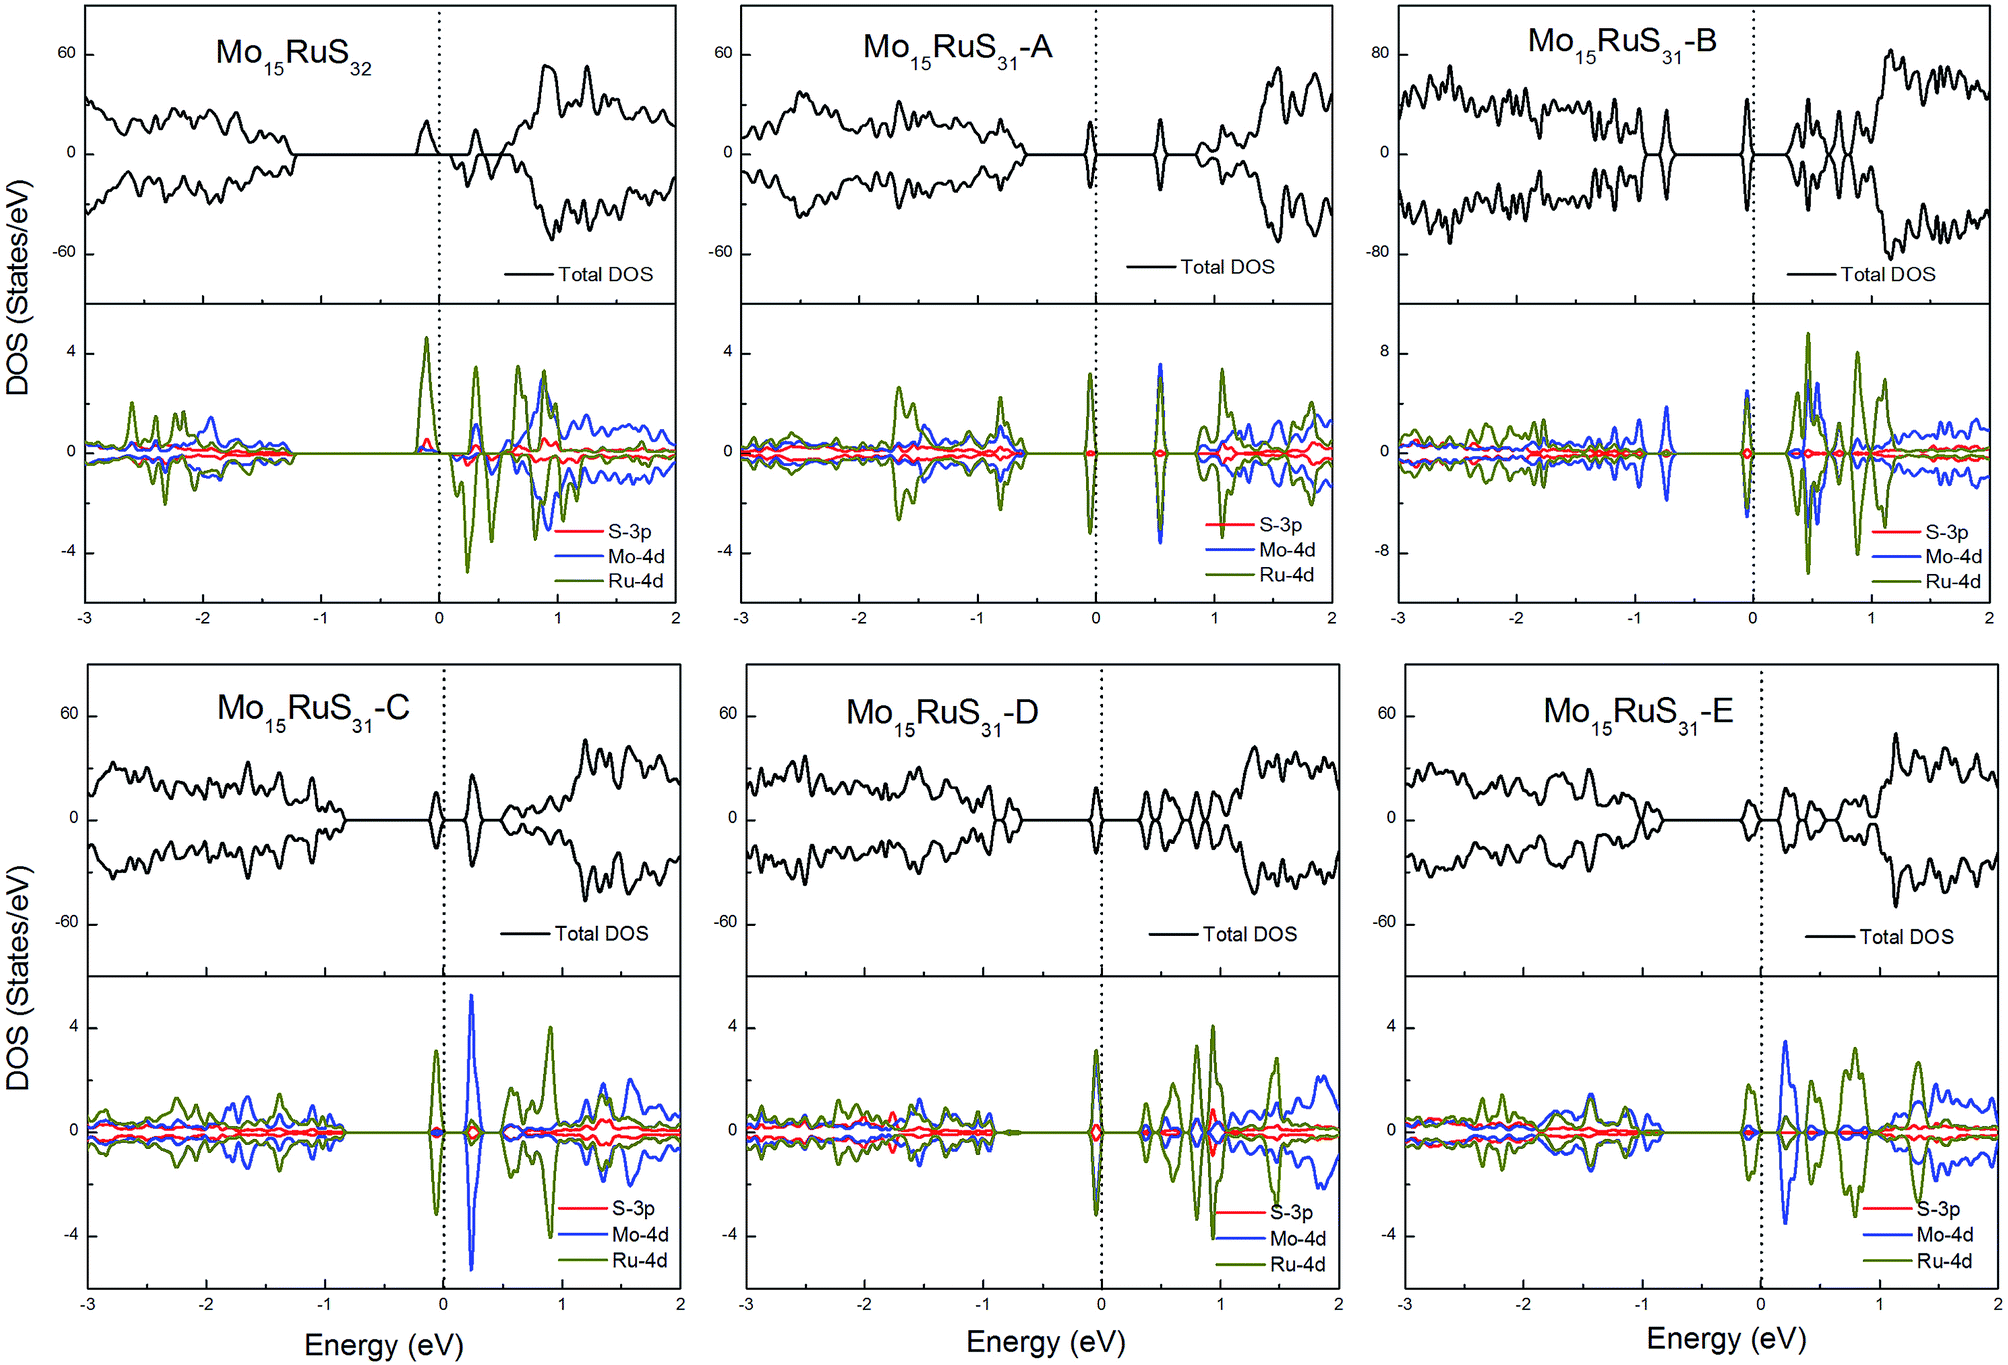 | ||
| Fig. 10 Total DOS and partial DOS for each atomic species in the all Ru-doped 1H-MoS2. | ||
Rh-doping provides 3 more valence electrons than the host Mo atom and all structures generate a 1μB magnetic moment. In addition, the mono-doped structure is a half-metal and the others are magnetic semiconductors (Fig. 11).
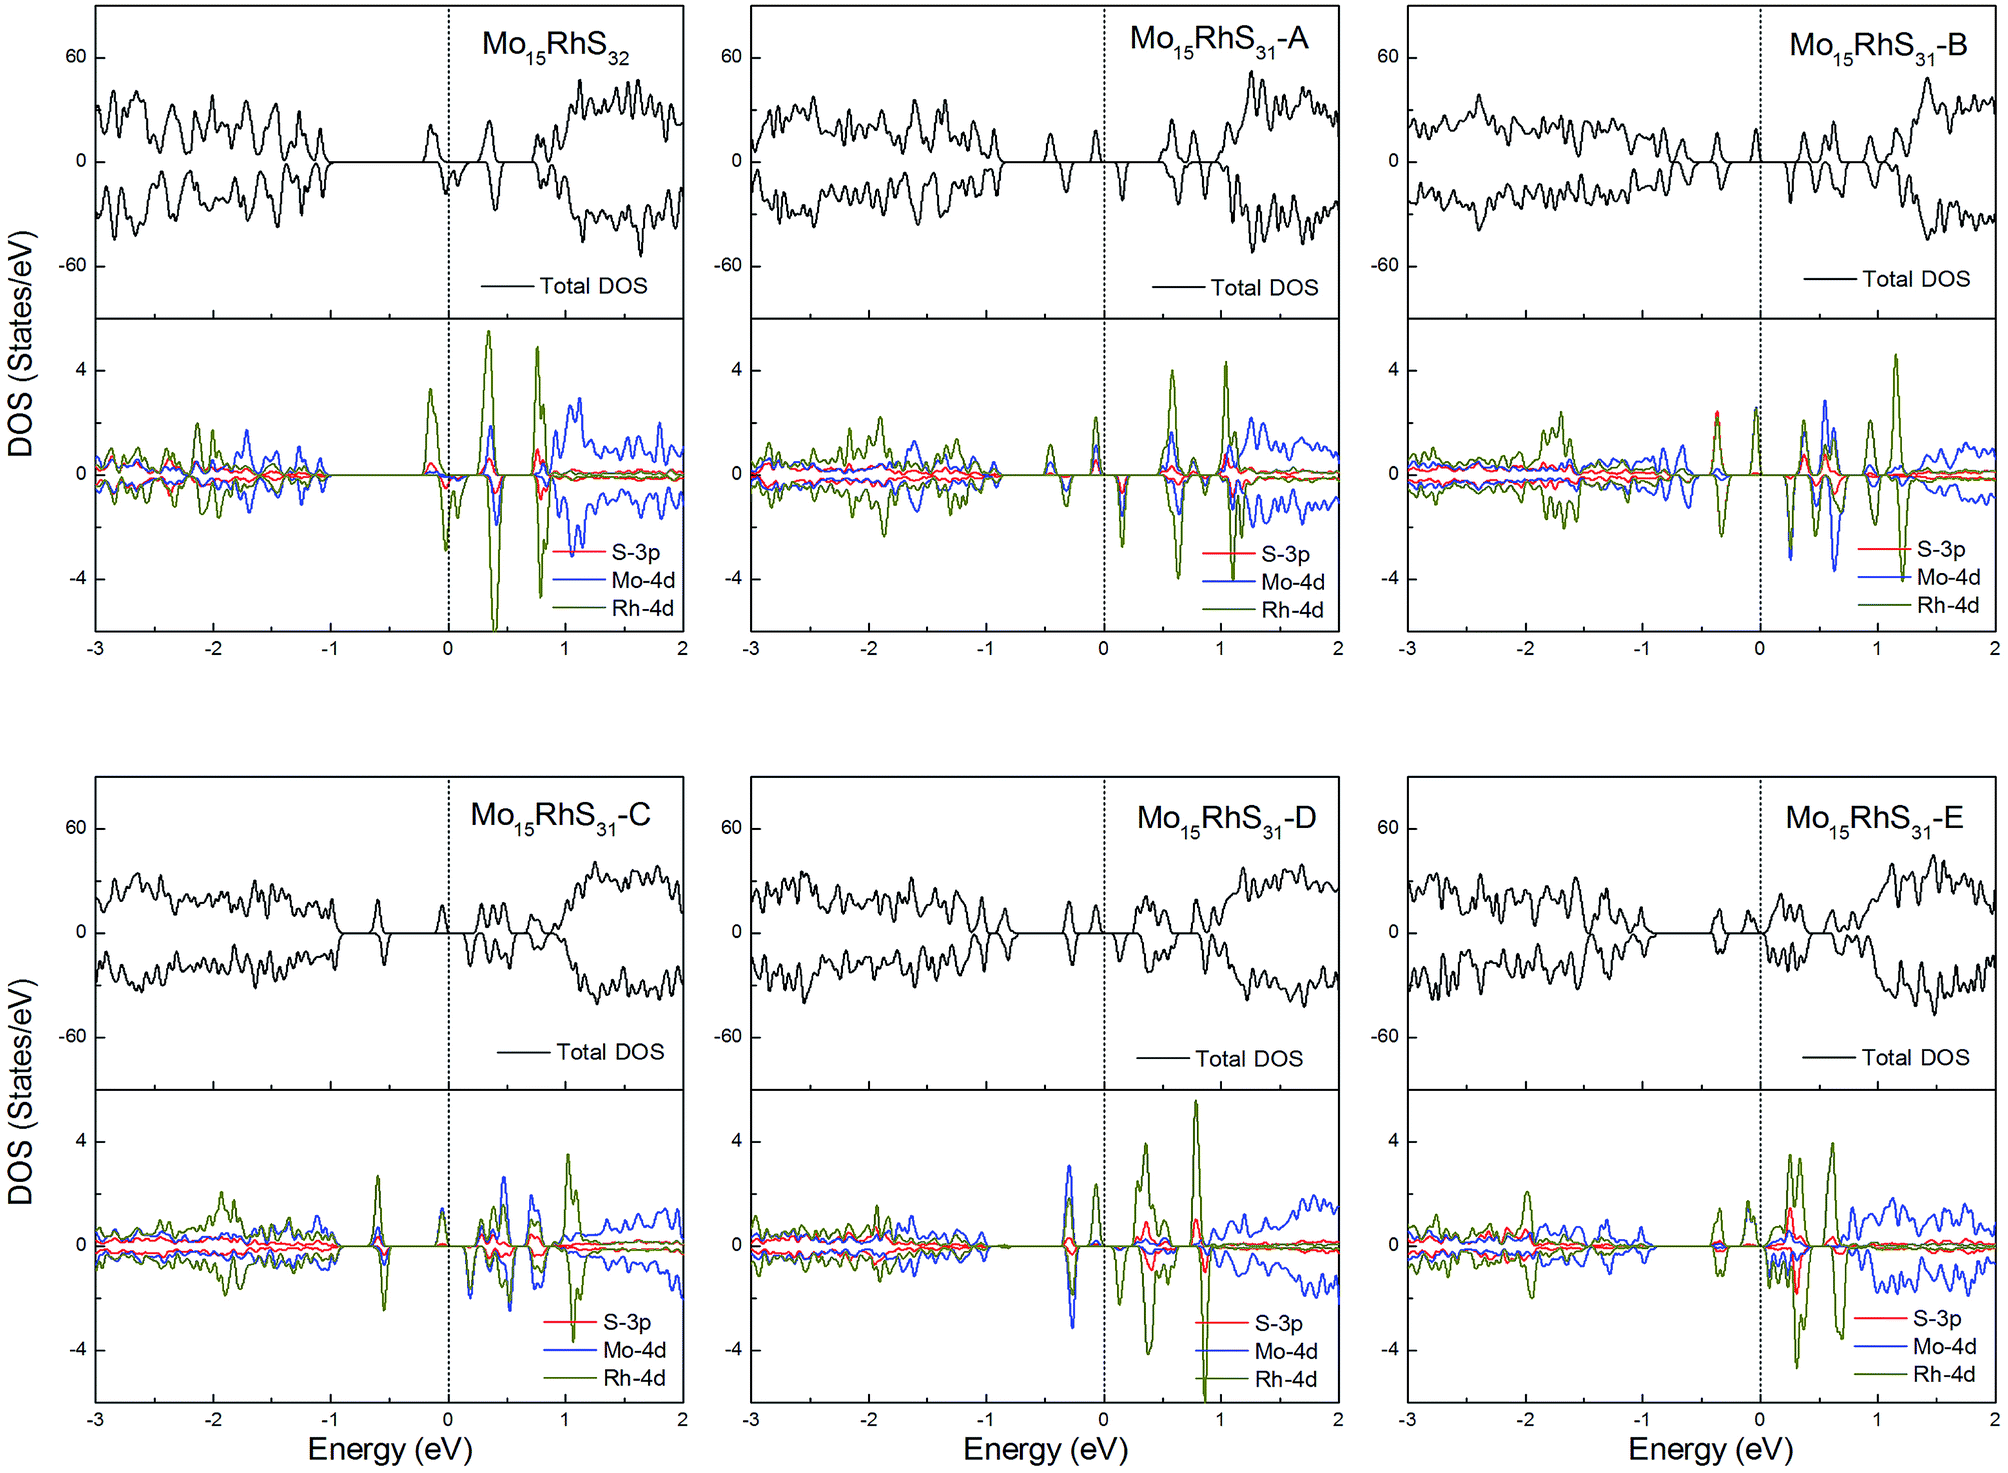 | ||
| Fig. 11 Total DOS and partial DOS for each atomic species in the all Rh-doped 1H-MoS2. | ||
For Pd-doped 1H-MoS2, the structure Mo15PdS31-B is a magnetic semiconductor with a 2μB magnetic moment, although Pd is a nonmagnetic element. The other systems are all nonmagnetic semiconductors and generate tiny band gaps of 0.30, 0.58, 0.21, 0.35, and 0.16 eV for Mo15PdS32, Mo15PdS31-A, Mo15PdS31-C, Mo15PdS31-D, and Mo15PdS31-E, respectively. The reason for the magnetism is the Hund coupling between the two hybridized states from the Mo 4d, S 3p and Pd 4d orbitals (Fig. 12).
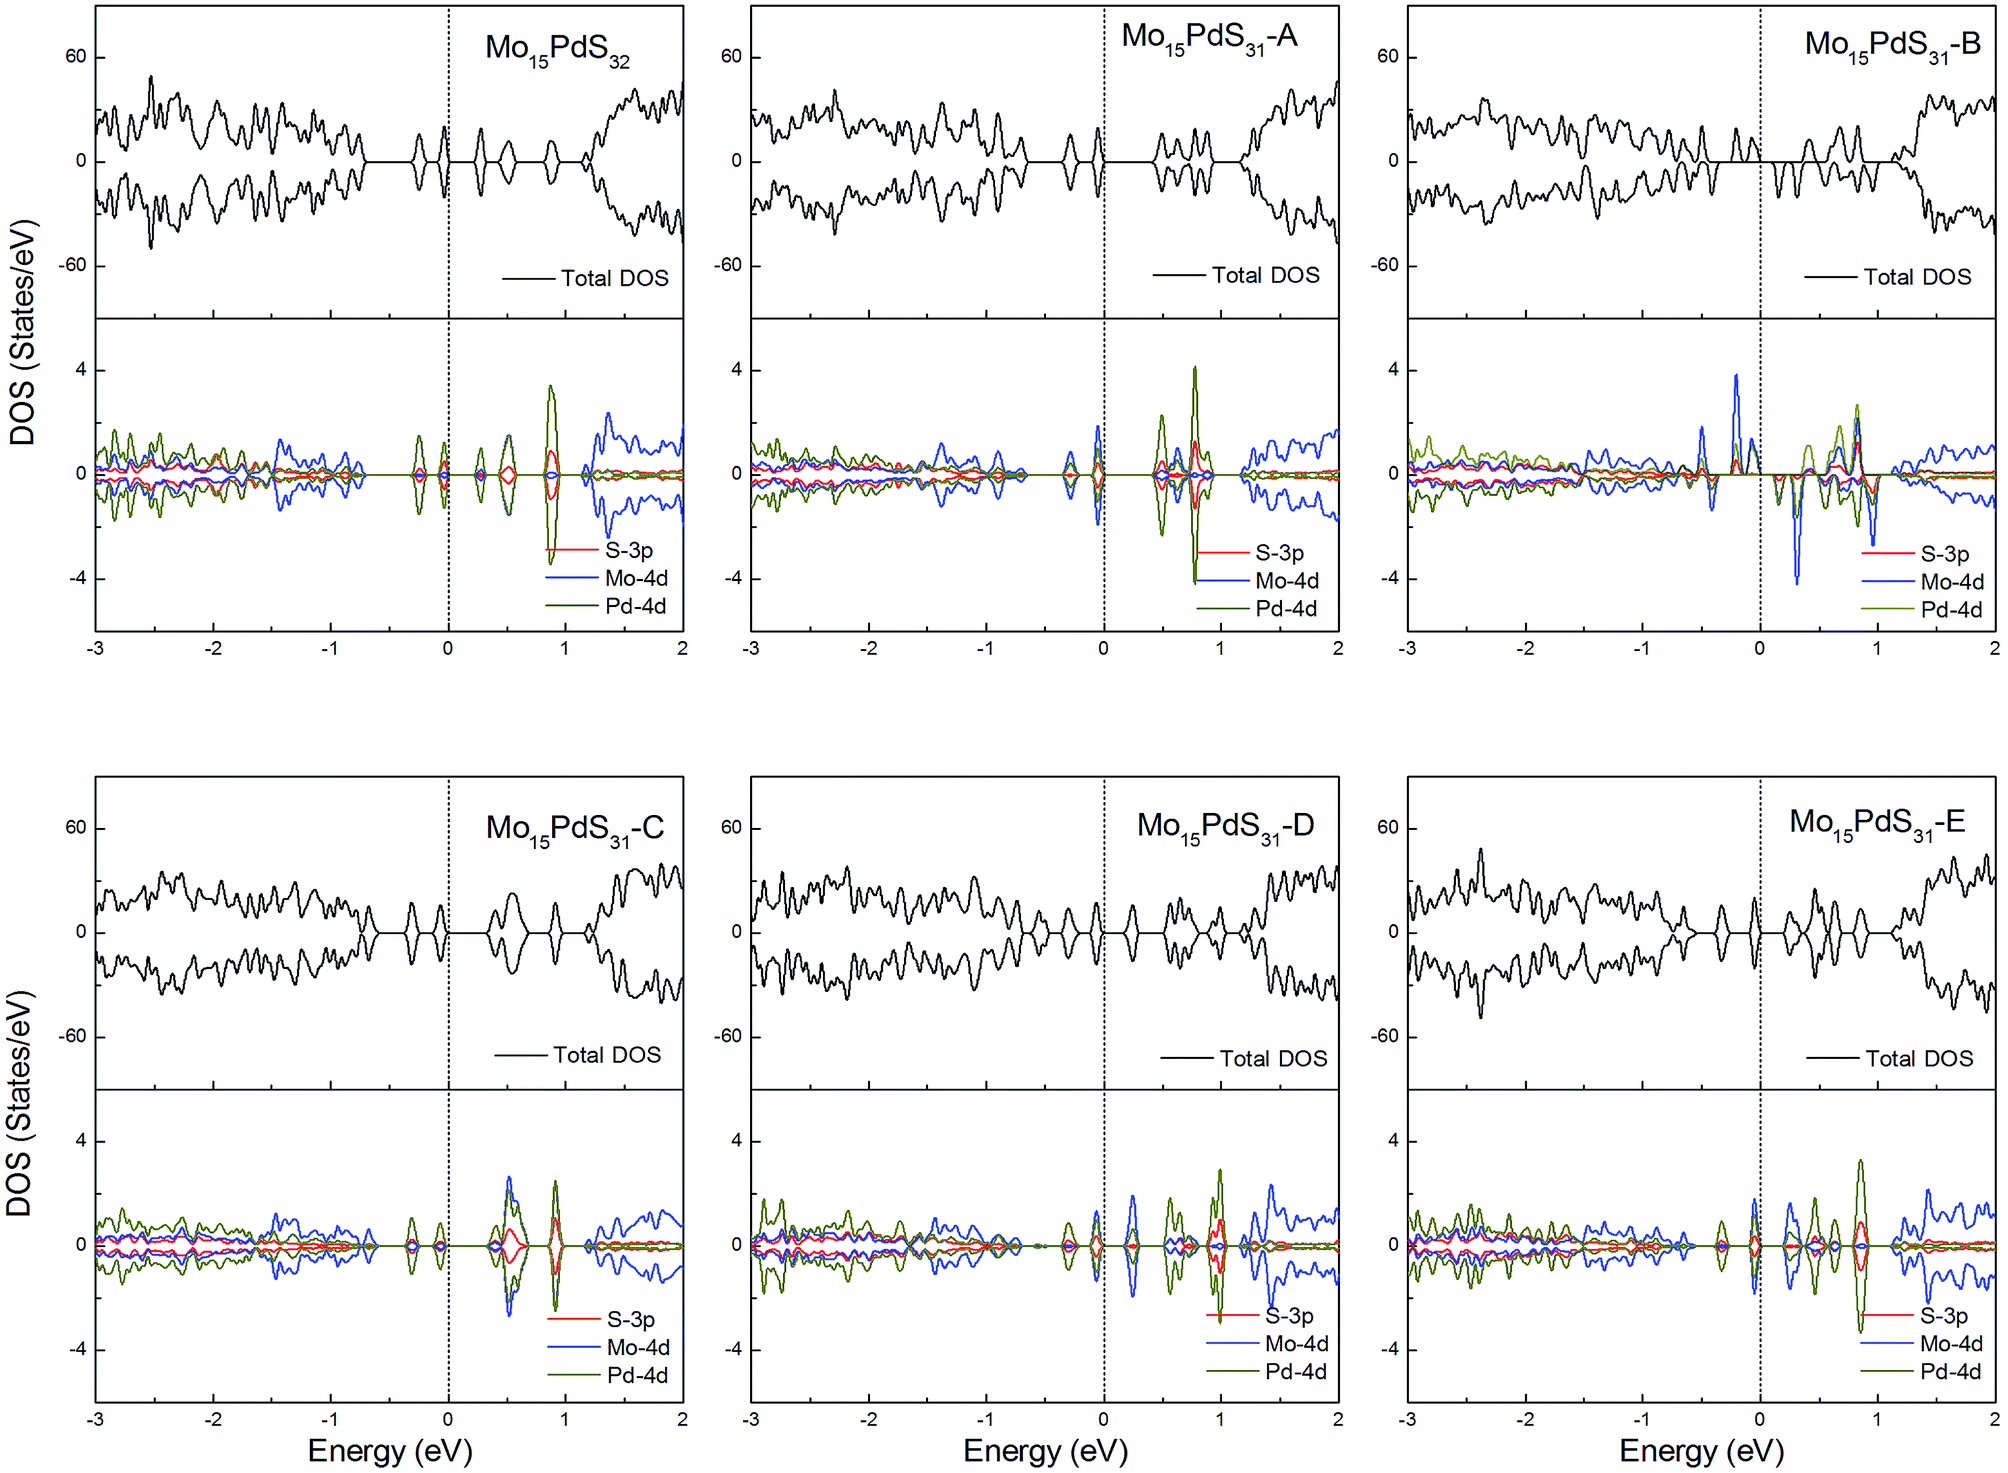 | ||
| Fig. 12 Total DOS and partial DOS for each atomic species in the all Pd-doped 1H-MoS2. | ||
Os is a 5d element with less localized d orbitals than the 3d and 4d elements discussed above. For the Os-doped 1H-MoS2, the impurity states are located near the conduction bands. The Mo15OsS32 and Mo15OsS31-C configurations are magnetic, and both have a net magnetic moment of 2 μB. In the Mo15OsS31-C configuration, the magnetism is attributed to the near degeneracy of two defective bands composed of the Co dx2−y2 and dz2 orbitals and the d orbital of the nearby Mo ions. The Mo15OsS31-A, Mo15OsS31-B, Mo15OsS31-D and Mo15OsS31-E configurations are nonmagnetic semiconductors with small band gaps of 0.57, 0.40, 0.35 and 0.16, respectively (Fig. 13).
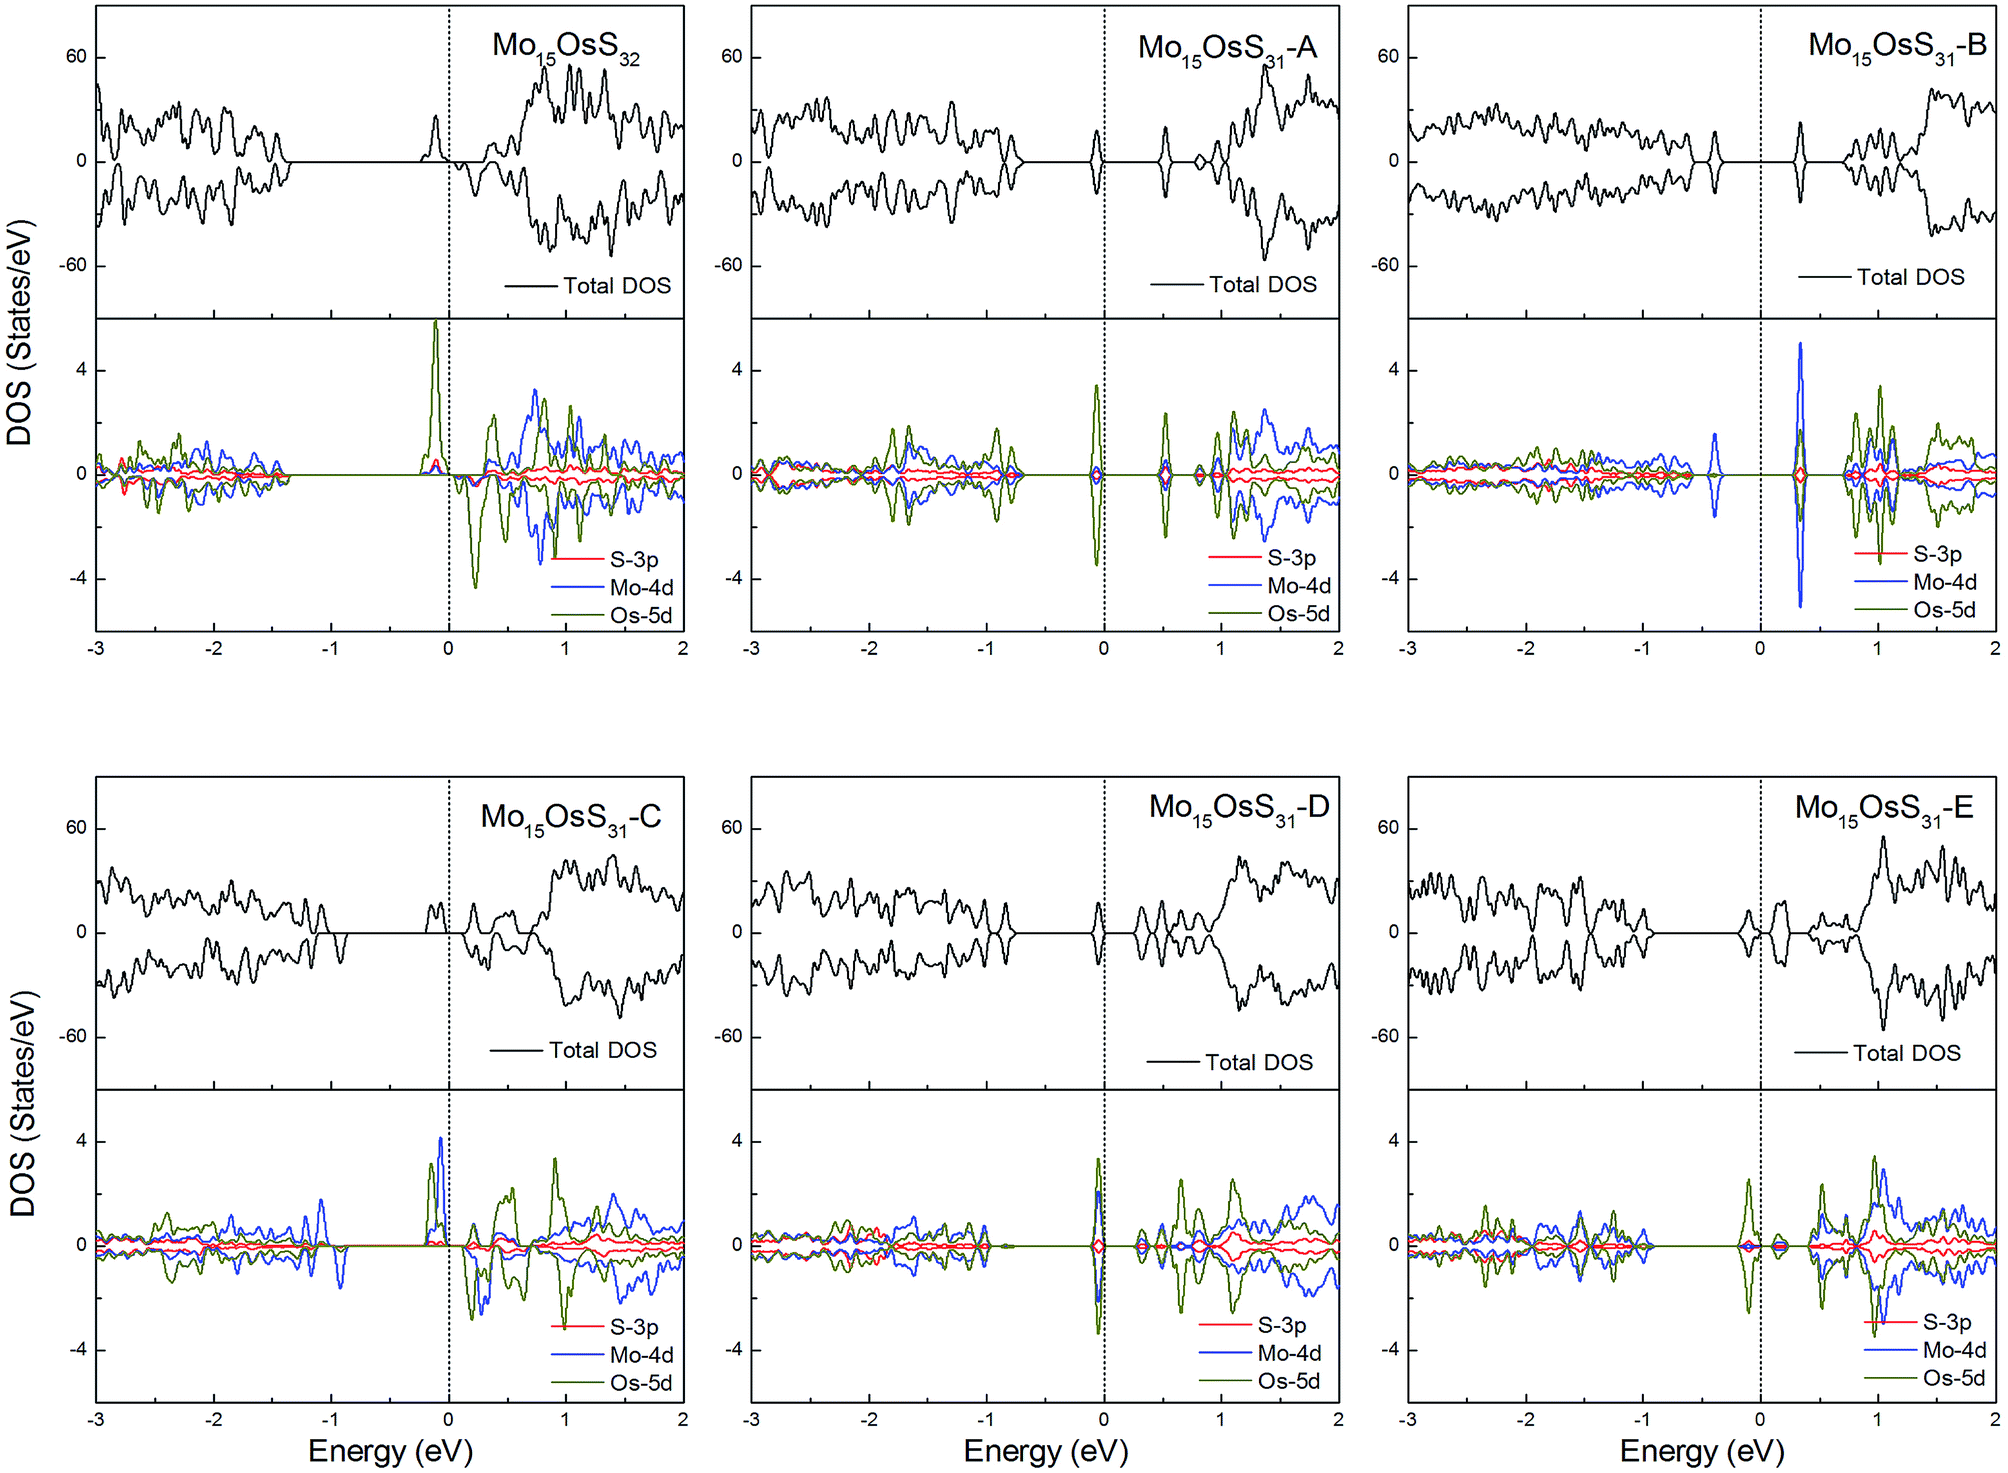 | ||
| Fig. 13 Total DOS and partial DOS for each atomic species in the all Os-doped 1H-MoS2. | ||
For Ir-doping, the DOS are very similar to the cases of Rh-doping, since the Ir atom belongs to the same column of the periodic table and has the same valence electron configuration as Rh. The difference is that the structure Mo15IrS32 is unambiguously half-metallic and can be utilized as a spin filter. Similarly, all structures possess a 1μB net magnetic moment (Fig. 14).
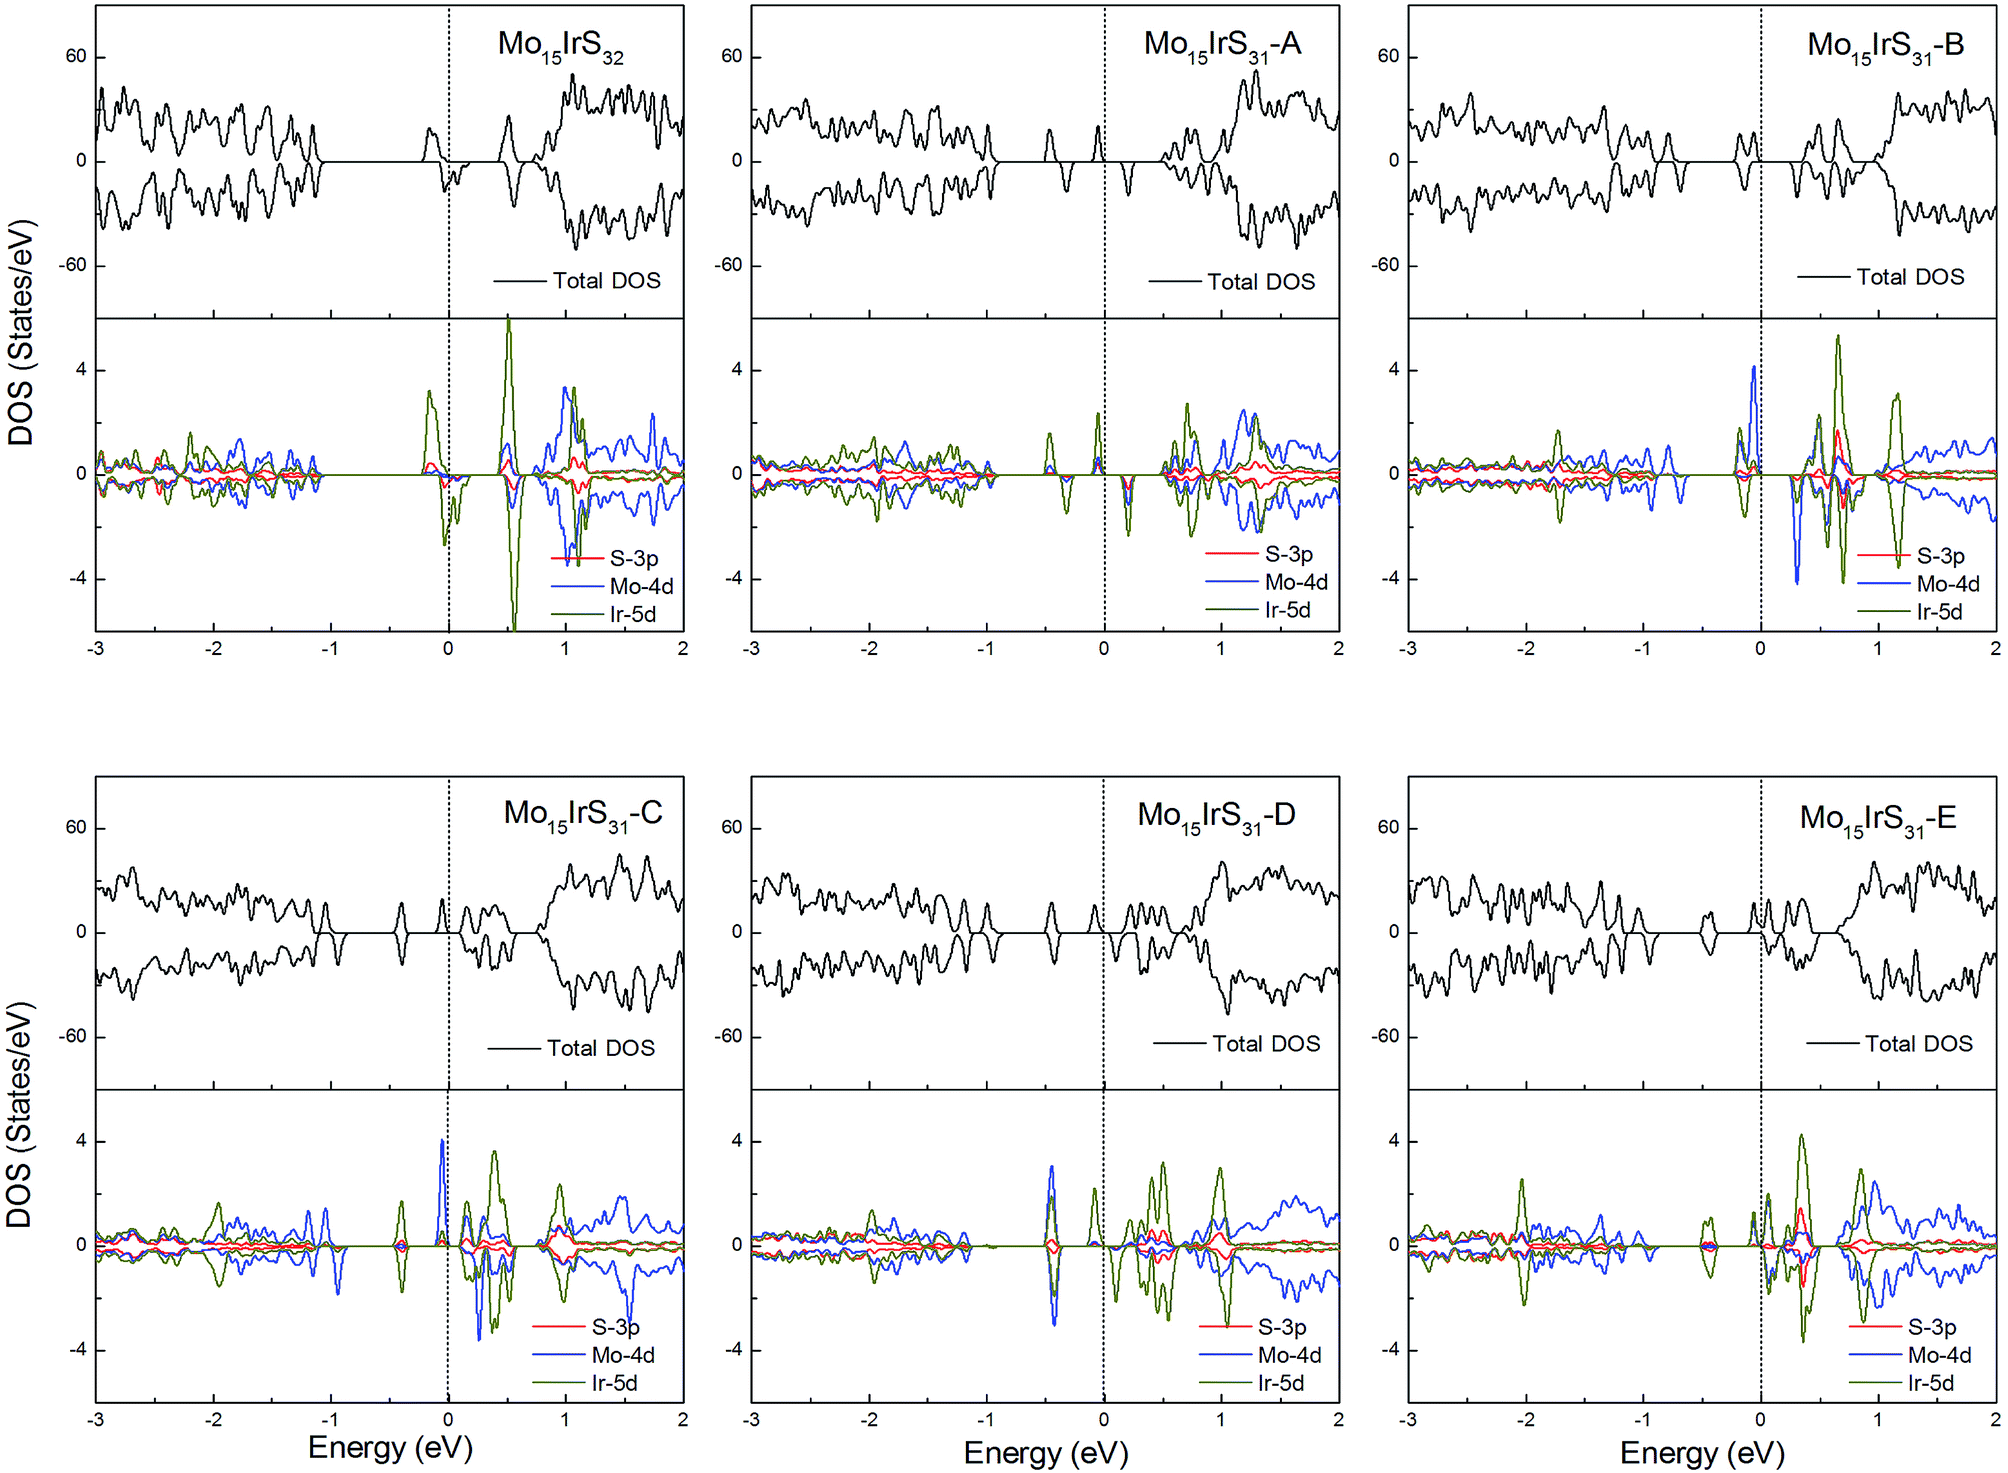 | ||
| Fig. 14 Total DOS and partial DOS for each atomic species in the all Ir-doped 1H-MoS2. | ||
For the Pt-doped cases, all of the structures are nonmagnetic semiconductors, i.e., they all have symmetrical spin-up and spin-down channels, and generate a series of energy gaps of 0.32, 0.58, 0.36, 0.45, 0.27, and 0.28 eV corresponding to Mo15PtS32, Mo15PtS31-A, Mo15PtS31-B, Mo15PtS31-C, Mo15PtS31-D, and Mo15PtS31-E, respectively. From the DOS figures, we can find that the d bands of the Pt ion mainly appear above the Fermi level and the strong hybridization of the S 3p and Pt 4d orbital, and the electrons tend to occupy the delocalized defective bands that are caused by the S vacancy (Fig. 15).
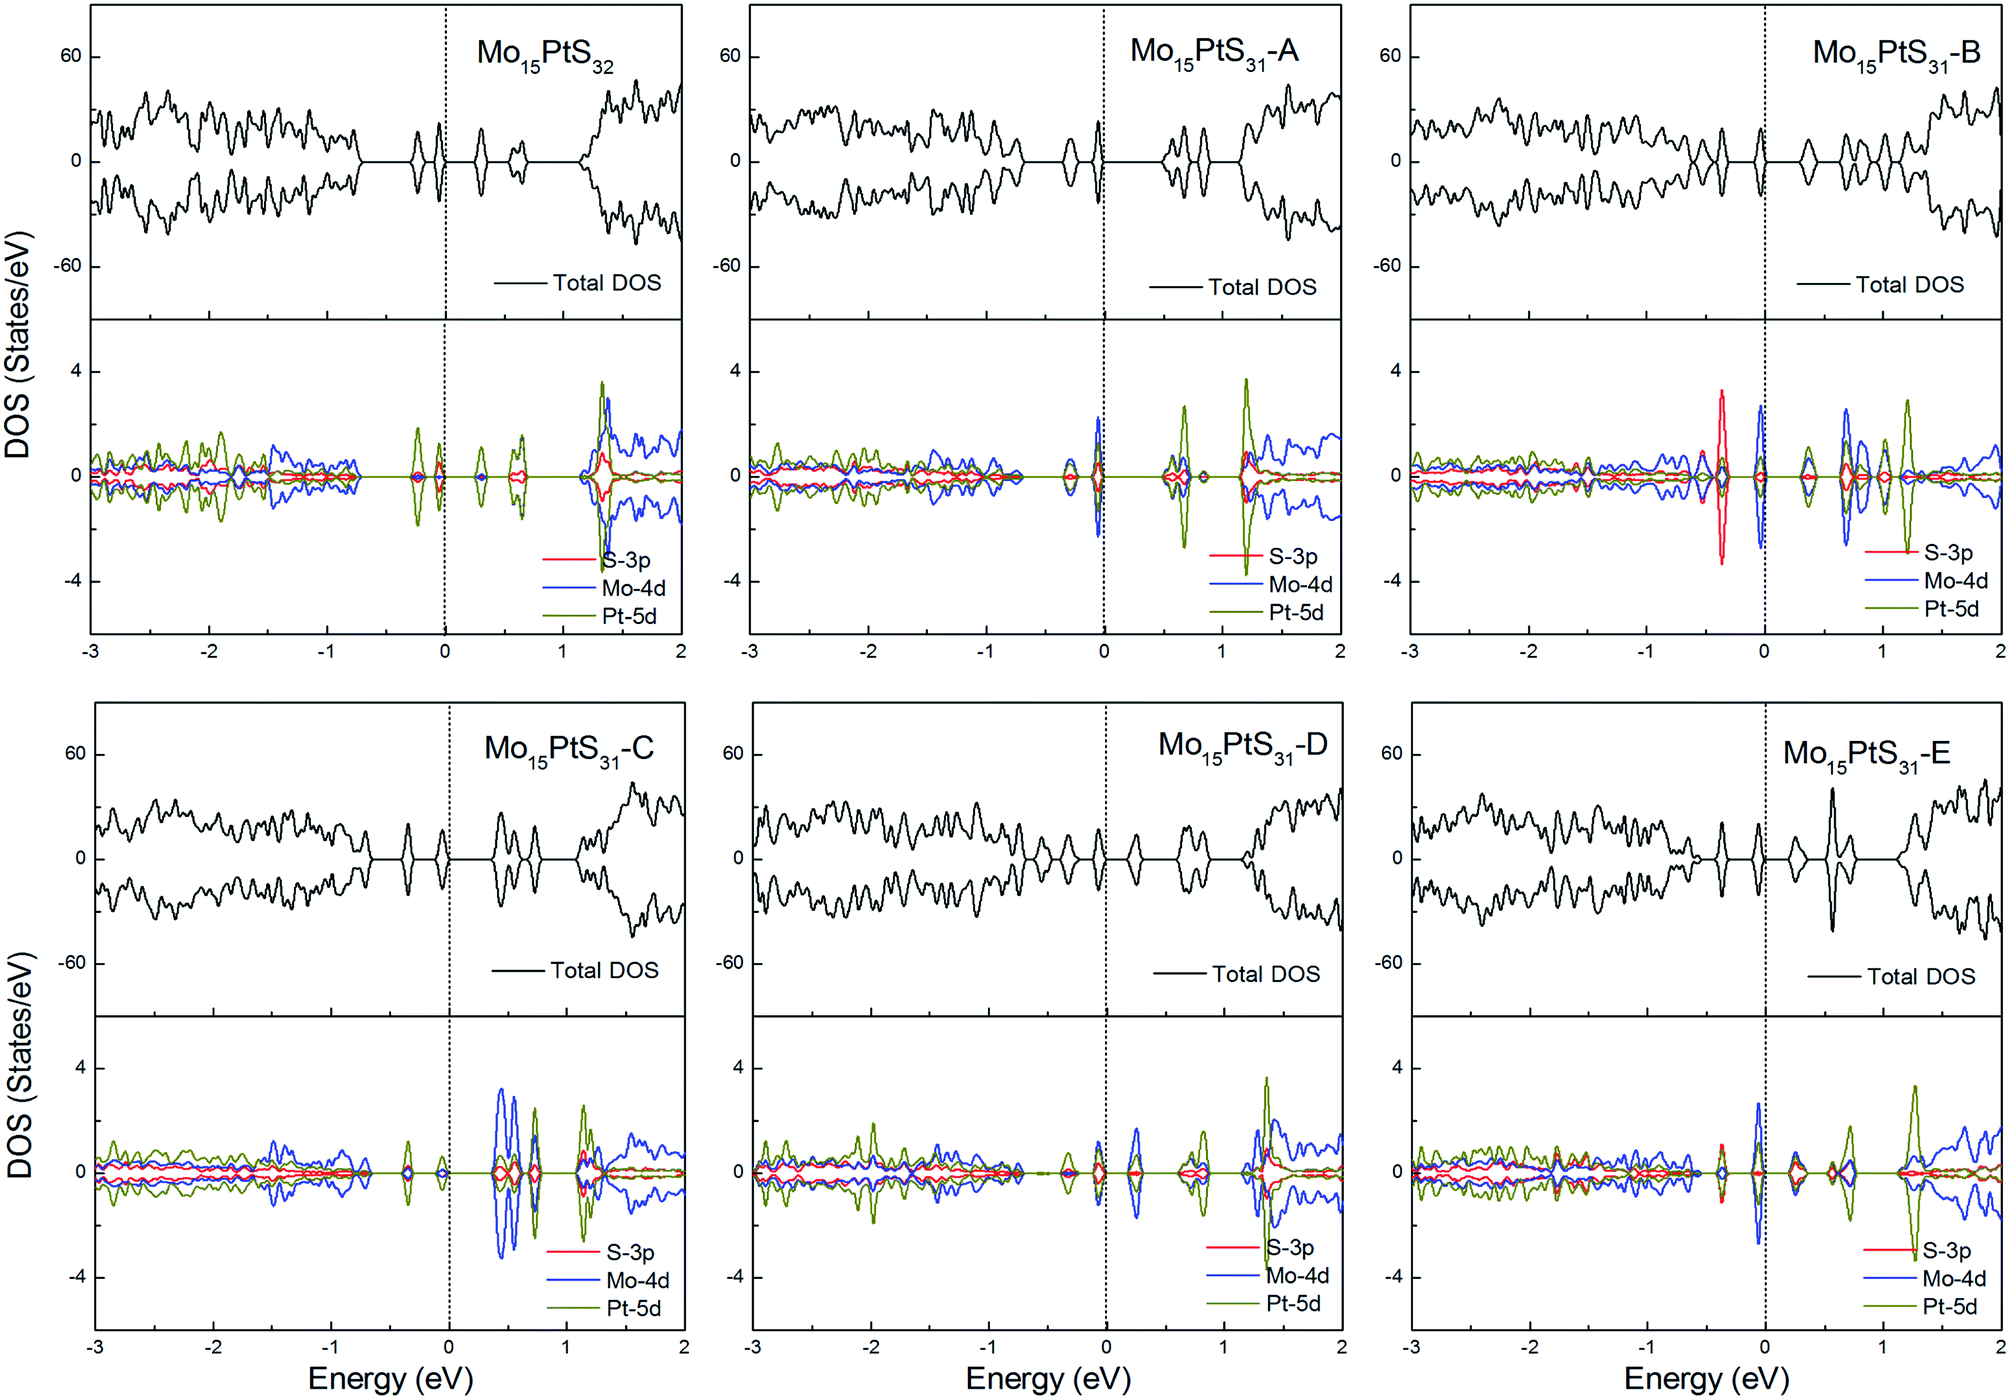 | ||
| Fig. 15 Total DOS and partial DOS for each atomic species in the all Pt-doped 1H-MoS2. | ||
Conclusion
In summary, based on first-principles calculations, we have investigated the effect of co-doping of G8 atoms and an S vacancy on the magnetic and electronic properties of monolayer MoS2. All of the mono G8-doped systems have magnetism, except for the Ni, Pd and Pt cases. According to the formation energy calculation, it is found that the nearest neighboring configurations for every doped system are preferred, and have lower formation energy (about 1.50 eV) than the remaining four configurations. Moreover, from the magnetic calculations, we find that the magnetic moment from the co-doping of Fe and an S vacancy (Fe-VS) is 2μB, except for the nearest neighboring configuration, which is a nonmagnetic semiconductor. For the Co-VS, the total magnetic moments are 1 or 3μB. Particularly for the Ni-VS case, all of the doped models are nonmagnetic semiconductors. The high magnetic order structures with a net magnetic moment of 4μB are transition states that are about 200 meV above the ground state. In the case of Ru-VS, only the structure without an S vacancy has a net magnetic moment. For Os-VS, the Mo15OsS31 and Mo15OsS31-C configurations have a net magnetic moment of 2μB. For Rh-VS and Ir-VS, all of the configurations are magnetic and the total magnetic moments are 1μB. Moreover, Ir-doped pristine 1H-MoS2 is a half-metal. In the case of Pd-VS, most configurations are nonmagnetic semiconductors except for the second-nearest neighboring configuration, which possesses a 2μB magnetic moment. For Pt-VS, all of the models are nonmagnetic semiconductors. Furthermore, the Curie temperatures (TC) are calculated within mean-field approximation. Our theoretical results show that Fe, Co, Ru, Rh, Os and Ir-doped MoS2 monolayers with particular distributions exhibit room-temperature ferromagnetism.The magnetic properties of the co-doped system depend on the competition between the Hund coupling and the ligand field splitting. Our results suggest that the co-doping of G8 atoms and S vacancies is an efficient way to modulate the magnetic properties. The main obstacle is the control of the distribution. Our further work will focus on methods to decrease the formation energy of the defects and the maintenance of the magnetic moment.
Conflicts of interest
There are no conflicts to declare.Acknowledgements
This research was supported by the Double First-class University Construction Project of Northwest University, the National Natural Science Foundation of China under Grants (No. 51572219 and 11447030), the Natural Science Foundation of Shaanxi Province of China (No. 2015JM1018), the Natural Science Foundation of Shaanxi Provincial Department of Education (No. 16JK1791) and the Graduate's Innovation Fund of Northwest University of China (No. YJG15007).References
- S. A. Wolf, D. D. Awschalom, R. A. Buhrman, J. M. Daughton, S. von Molnár, M. L. Roukes, A. Y. Chtchelkanova and D. M. Treger, Science, 2001, 294, 1488 CrossRef PubMed.
- H. Kizaki, K. Sato, A. Yanase and H. Katayamayoshida, Jpn. J. Appl. Phys., 2005, 44, 44 CrossRef.
- S. Zhou, J. Phys. D: Appl. Phys., 2015, 48, 263001 CrossRef.
- K. Sato, L. Bergqvist, J. Kudrnovský, P. H. Dederichs, O. Eriksson, I. Turek, B. Sanyal, G. Bouzerar, H. Katayama-Yoshida, V. A. Dinh, T. Fukushima, H. Kizaki and R. Zeller, Rev. Mod. Phys., 2010, 82, 1633–1690 CrossRef.
- A. Ramasubramaniam and D. Naveh, Phys. Rev. B: Condens. Matter Mater. Phys., 2013, 87, 195201 CrossRef.
- Y. C. Cheng, Z. Y. Zhu, W. B. Mi, Z. B. Guo and U. Schwingenschlogl, Phys. Rev. B: Condens. Matter Mater. Phys., 2013, 87, 100401 CrossRef.
- Q. Yue, S. Chang, S. Qin and J. Li, Phys. Lett. A, 2013, 377, 1362–1367 CrossRef.
- S. C. Lu and J. P. Leburton, Nanoscale Res. Lett., 2014, 9, 2413 Search PubMed.
- Y. Wang, L. T. Tseng, P. P. Murmu, N. Bao, J. Kennedy, M. Lonesc, J. Ding, K. Suzuki, S. Li and J. Yi, Mater. Des., 2017, 121, 77–84 CrossRef.
- H. P. Komsa, J. Kotakoski, S. Kurasch, O. Lehtinen, U. Kaiser and A. V. Krasheninnikov, Phys. Rev. Lett., 2012, 109, 035503 CrossRef PubMed.
- X. L. Fan, Y. R. An and W. J. Guo, Nanoscale Res. Lett., 2016, 11, 154 CrossRef PubMed.
- M. D. Xie, C. G. Tan, P. Zhou, J. G. Lin and L. Z. Sun, RSC Adv., 2017, 7, 20116–20122 RSC.
- F. Zou, L. Zhu, G. Gao, M. Wu and K. Yao, Phys. Chem. Chem. Phys., 2016, 18, 6053 RSC.
- H. Zheng, B. Yang, D. Wang, R. Han, X. Du and Y. Yan, Appl. Phys. Lett., 2014, 104, 132403 CrossRef.
- G. Kresse and J. Furthmuller, Phys. Rev. B: Condens. Matter Mater. Phys., 1999, 54, 169 Search PubMed.
- G. Kresse and D. Joubert, Phys. Rev. B: Condens. Matter Mater. Phys., 1999, 59, 175 Search PubMed.
- J. P. Perdew, K. Burke and M. Ernzerhof, Phys. Rev. Lett., 1996, 77, 3865 CrossRef PubMed.
- M. Cococcioni and S. De Gironcoli, Phys. Rev. B: Condens. Matter Mater. Phys., 2005, 71, 035105 CrossRef.
- A. N. Andriotis and M. Menon, Phys. Rev. B: Condens. Matter Mater. Phys., 2014, 90, 125304 CrossRef.
- R. Mishra, W. Zhou, S. J. Pennycook, S. T. Pantelides and J. C. Idrobo, Phys. Rev. B: Condens. Matter Mater. Phys., 2013, 88, 144409 CrossRef.
- T. Chanier, M. Sargolzaei, I. Opahle, F. Hayn and K. Koepernik, Phys. Rev. B: Condens. Matter Mater. Phys., 2006, 73, 134418 CrossRef.
- K. F. Mak, C. Lee, J. Hone, J. Shan and T. F. Heinz, Phys. Rev. Lett., 2010, 105, 136805 CrossRef PubMed.
- L. P. Feng, J. Su, S. Chen and Z. T. Liu, Mater. Chem. Phys., 2014, 148, 5–9 CrossRef.
- W. B. Xu, B. J. Huang, P. Li, F. Li, C. W. Zhang and P. J. Wang, Nanoscale Res. Lett., 2014, 9, 554 CrossRef PubMed.
- X. Zhao, P. Chen, C. Xia, T. Wang and X. Dai, RSC Adv., 2016, 6, 16772–16778 RSC.
- H. Wan, L. Xu, W. Q. Huang, J. H. Zhou, C. N. He, X. Li, G. F. Huang, P. Peng and Z. G. Zhou, RSC Adv., 2015, 5, 7944–7952 RSC.
- P. O. Lehtinen, A. S. Foster, Y. Ma, A. V. Krasheninnikov and R. M. Nieminen, Phys. Rev. Lett., 2004, 93, 1872021–1872024 CrossRef PubMed.
- C. Ataca and S. Ciraci, J. Phys. Chem. C, 2011, 115, 13303–13311 Search PubMed.
- R. Mishra, W. Zhou, S. J. Pennycook, S. T. Pantelides and J. Idrobo, Phys. Rev. B: Condens. Matter Mater. Phys., 2013, 88, 144409 CrossRef.
- W. Zhou, X. Zou, S. Najmaei, Z. Liu, Y. Shi, J. Kong, J. Lou, P. M. Ajayan, B. I. Yakobson and J. C. Idrobo, Nano Lett., 2013, 13, 2615–2622 CrossRef PubMed.
- Y. Wang, S. Li and J. Yi, Sci. Rep., 2016, 6, 24153 CrossRef PubMed.
- J. Bai, X. Zhong, S. Jiang, Y. Huang and X. Duan, Nat. Nanotechnol., 2010, 5, 190–194 CrossRef PubMed.
- R. Balog, B. Jørgensen, L. Nilsson, M. Andersen, E. Rienks, M. Bianchi, M. Fanetti, E. Lægsgaard, A. Baraldi, S. Lizzit, Z. Sljivancanin, F. Besenbacher, B. Hammer, T. G. Pedersen, P. Hofmann and L. Hornekær, Nat. Mater., 2010, 9, 315 CrossRef PubMed.
- K. Sato, P. H. Dederichs and H. Latayama-Yoshida, Europhys. Lett., 2003, 61, 403 CrossRef.
- J. L. Xu, M. van Schilfgaarde and G. D. Samolyuk, Phys. Rev. Lett., 2005, 94, 097201 CrossRef PubMed.
- M. Kan, J. Y. Wang, X. W. Li, S. H. Zhang, Y. W. Li, Y. Kawazoe, Q. Sun and P. Jena, J. Phys. Chem. C, 2014, 118, 1515–1522 Search PubMed.
Footnote |
| † Electronic supplementary information (ESI) available. See DOI: 10.1039/c8ra01644e |
| This journal is © The Royal Society of Chemistry 2018 |