DOI:
10.1039/C8RA01617H
(Paper)
RSC Adv., 2018,
8, 16269-16277
Switch on fluorescence probe for the selective determination of lisinopril in pharmaceutical formulations: application to content uniformity testing
Received
23rd February 2018
, Accepted 25th April 2018
First published on 1st May 2018
Abstract
Lisinopril, an ACE inhibitor, was selectively determined in pharmaceutical products using spectrofluorimetry. The method was based on the switch on fluorescamine fluorescence as a result of its interaction with the primary amino group of the drug in the presence of aqueous borate buffer (pH 9.5). The fluorescence emission was measured at 475 nm after excitation at 390 nm. The fluorescent product was suggested to be a diaryl pyrrolone cation which has a coplanar structure. Different experimental conditions affecting the reaction were optimized to give the maximum sensitivity. The fluorescence intensity was linear with the drug concentration in the range of 0.55–4.5 μg mL−1. The method was validated according to ICH guidelines and the result was acceptable. The calculated limits of detection and quantitation were 0.182 and 0.55 μg mL−1, respectively. The commercially available dosage forms containing lisinopril alone or in combination with hydrochlorothiazide were effectively analyzed by the proposed method. The obtained results were in agreement with those of the reported method in respect to accuracy and precession. Moreover, the suggested method was employed to determine the content uniformity testing of the investigated dosage forms.
1. Introduction
Lisinopril, the third ACE inhibitor approved for use in the United States, is the lysine analogue of enalaprilat. The oral dosage of lisinopril ranges from 5 to 40 mg daily (single or divided dosage), with 5 and 10 mg daily being appropriate for the initiation of therapy for heart failure and hypertension, respectively.1
Different analytical methods have been developed for determination of lisinopril including; spectrophotometric2–10 spectrofluorimetric,10–15 polarographic,7 chromatographic,4,9,16–31 capillary electrophoretic32–35 flow injection36 and immunoassay37 methods.
The chromatographic and electrophoretic methods require expensive instruments and consume a large volume of expensive organic solvents.4,17–35 In addition, the spectrophotometric methods are less sensitive.2–10 On the other hand spectrofluorimetry is a simple and inexpensive technique although it has high sensitivity, selectivity and reliable accuracy. However, most of the reported spectrofluorimetric methods include heating, which is a time consuming step.10–15
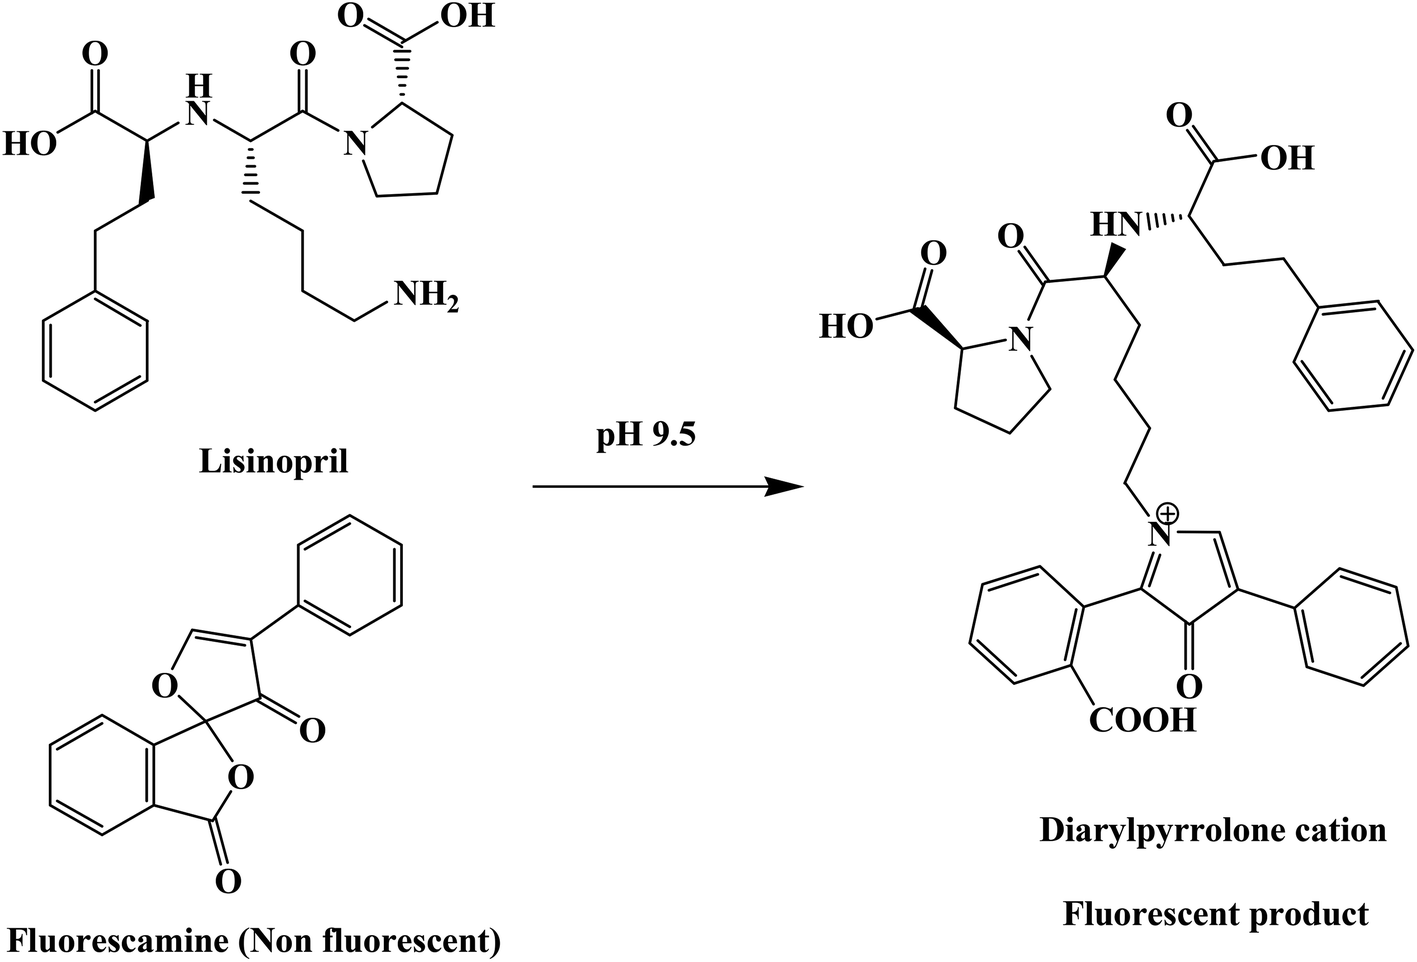
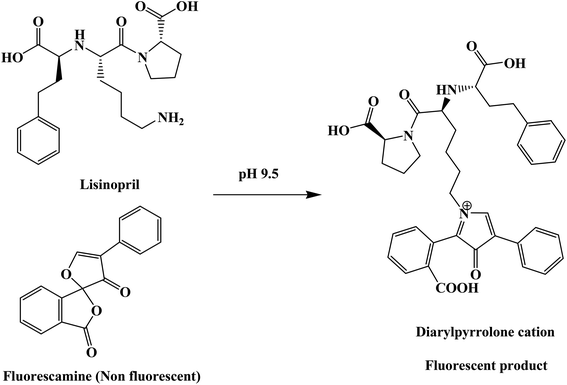
Fluorescamine reacts readily with primary amino groups to form highly fluorescent compounds, even though fluorescamine itself is nonfluorescent. These properties make fluorescamine ideal for detecting amino groups, especially in proteins, peptides, and amino acids.
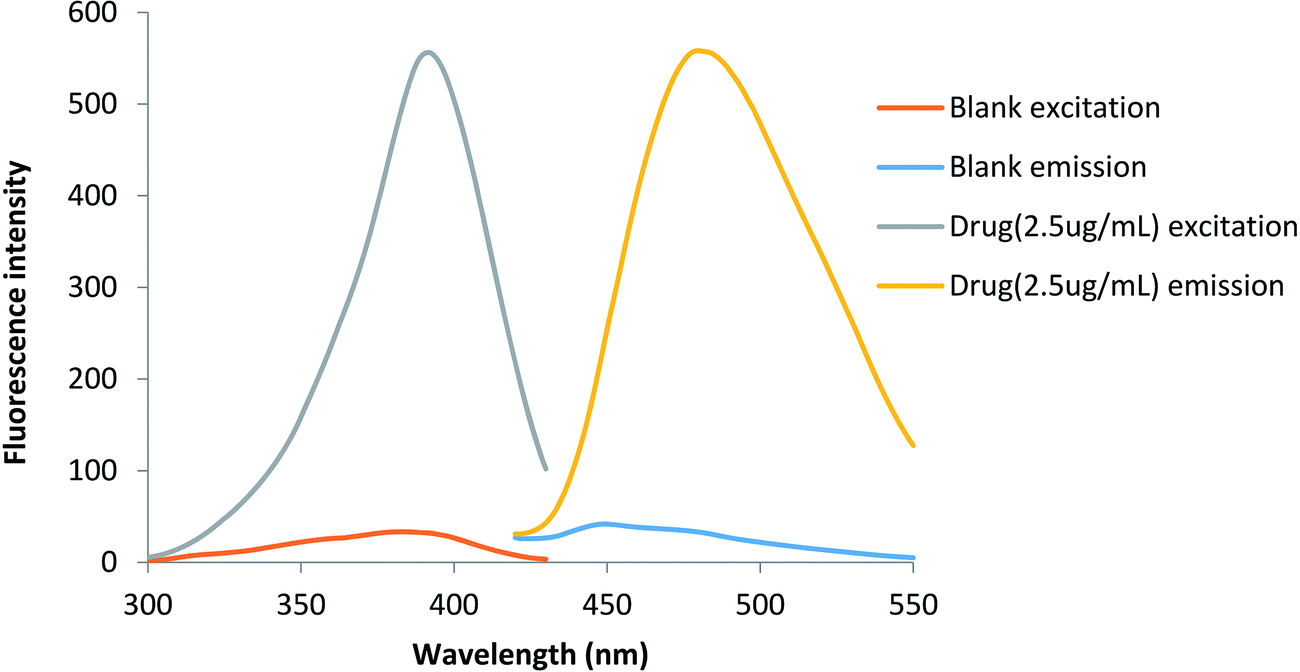
The purpose of this study was to develop a fast, simple, sensitive, selective and applicable method for analysis of lisinopril in pure form, pharmaceutical preparations and in mixtures with hydrochlorothiazide. The existence of the primary amino group in the studied drug give it the ability to switch on the fluorescence of fluorescamine. In buffered alkaline medium pH 9.5, the fluorescent product have an excitation maximum at 390 nm and an emission maximum at 475 nm (Fig. 1).
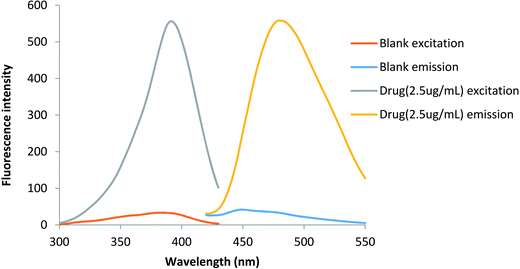 |
| | Fig. 1 The excitation and emission spectra of the blank and the reaction product between lisinopril and fluorescamine. | |
2. Experimental
2.1. Apparatus
The instrument used was Perkin Elmer LS 45 Luminescence spectrometer (UK) that is connected to a PC computer loaded with the FL WINLAB™ software and MLW Milwaukee SM 101 pH meter (Portugal).
2.2. Materials and reagents
Lisinopril was obtained as a gift from Sedico Company For Pharmaceutical Industries (Cairo, Egypt) and it was used without further treatment. Fluorescamine (Sigma-Aldrich Chemie GmbH, Germany) and (Alfaaesar, ThermoFisher, Germany) was prepared as 0.2 mg mL−1 in acetone. Other chemicals such as ethanol, methanol, acetone, acetonitrile, dimethylformamide, sodium hydroxide, hydrochloric acid and boric acid were obtained from El Nasr chemical Co, Cairo, Egypt. Borate buffer was prepared by mixing 0.1 M boric acid and 0.1 M sodium hydroxide in amounts that are sufficient to produce pH 9.5. All of the materials were of analytical grade.
2.3. Pharmaceutical formulations
Different commercially available tablets were obtained from the local market. Maxipril® tablets (Rameda, 6th October City, Cairo, Egypt) were labelled to contain 20 mg of lisinopril per tablet. Sinopril Co® tablets (Global Nabi pharmaceutical Co., Egypt) were labelled to contain 20 mg of lisinopril and 12.5 mg of hydrochlorothiazide per tablet.
2.4. Standard drug solutions
A stock solution (0.1 mg mL−1) of lisinopril was prepared by dissolving 10 mg of lisinopril in 100 mL volumetric flask using distilled water. Working solutions were prepared by further dilution of the stock solution with the same solvent. Different volumes of the working solution were applied in the general procedure to obtain the required final concentrations (0.5–4.5 μg mL−1).
2.5. Procedures
2.5.1. General analytical procedure. Into a series of calibrated 10 mL volumetric flasks, different volumes of lisinopril solution (0.05 mg mL−1) were transferred followed by 0.5 mL of borate buffer pH 9.5 and 1.0 mL fluorescamine solution (0.2 mg mL−1). The volume was completed to the mark with ethanol and allowed to stand for 7 min. The fluorescence intensity of the resulting solution was measured at 475 nm after excitation at 390 nm. A blank experiment was prepared simultaneously using the same procedure omitting the drug solution.
2.5.2. Preparation of sample solution. Ten tablets of the studied dosage form were weighed, finely powdered and mixed well. An amount of the finely powdered tablet equivalent to 10 mg of lisinopril was weighed and dissolved in distilled water by sonication for 5 min. The solution was filtered into a 100 mL volumetric flask and the volume was completed with distilled water to obtain a stock solution (0.1 mg mL−1). Further dilution of the stock solution was performed to prepare solution in the required range (0.05 mg mL−1). The general procedure was applied on the final solution.
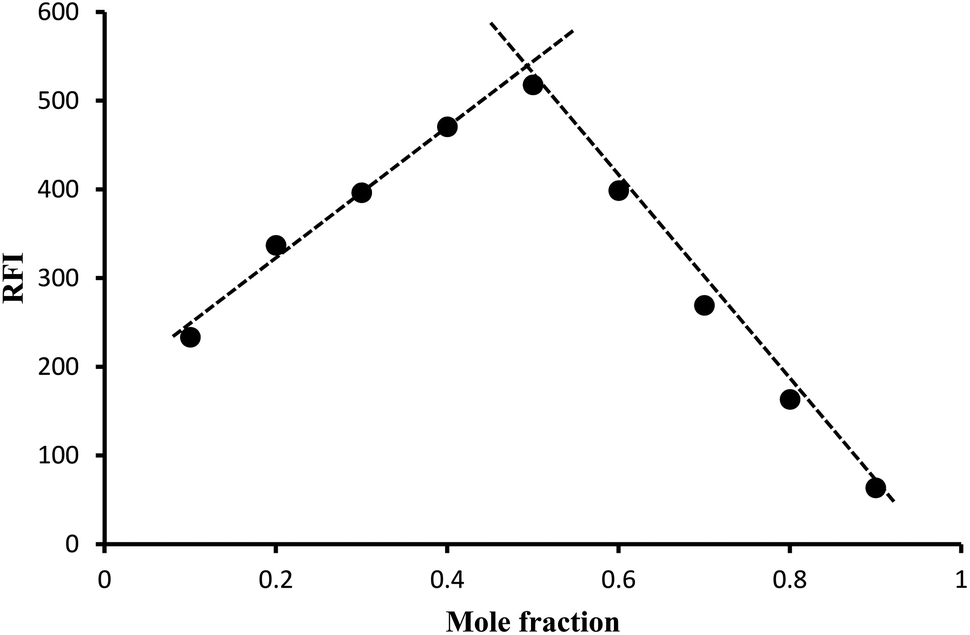
2.5.3. Determination of reaction stoichiometry. Job's method of continuous variation was applied to find out the ratio between drug and the reagent. Equimolar solutions of both lisinopril and fluorescamine (1.2 × 10⁻⁴ M) were prepared. Different solutions containing complementary volumes of the drug and the reagent solutions were prepared. The general analytical procedure was applied on each of these solutions. The fluorescence intensity was measured and Job's plot was constructed by plotting RFIs versus the corresponding mole fractions of lisinopril.
2.5.4. Procedure for content uniformity testing. The general analytical procedure was applied for the analysis of ten tablets of the studied dosage forms individually Both Sinopril® and Sinopril Co® were tested for content uniformity by the proposed method. The content uniformity was performed according to the USP procedures.38 After analysing ten tablets individually the acceptance value (AV) was calculated.
3. Results and discussion
Fluorescamine has been widely used as a fluorigenic reagent for determination of primary and secondary amines containing drugs. It should be noted that, the reagent itself and its hydrolysis products are non-fluorescent. Upon reaction with the amino group a highly fluorescent reaction product is formed. The reaction of lisinopril through its primary aliphatic amino group turn on the fluorescence of the reagent. The reaction should be carried out in a buffered aqueous solution and the formed product has a yellow color. The fluorescence intensity of the reaction product can be measured at 475 nm after excitation at 390 nm (Fig. 1).
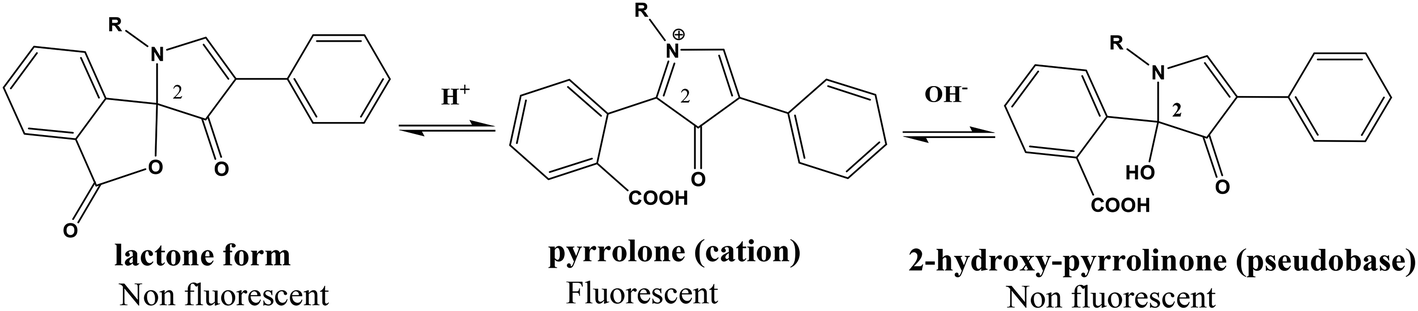
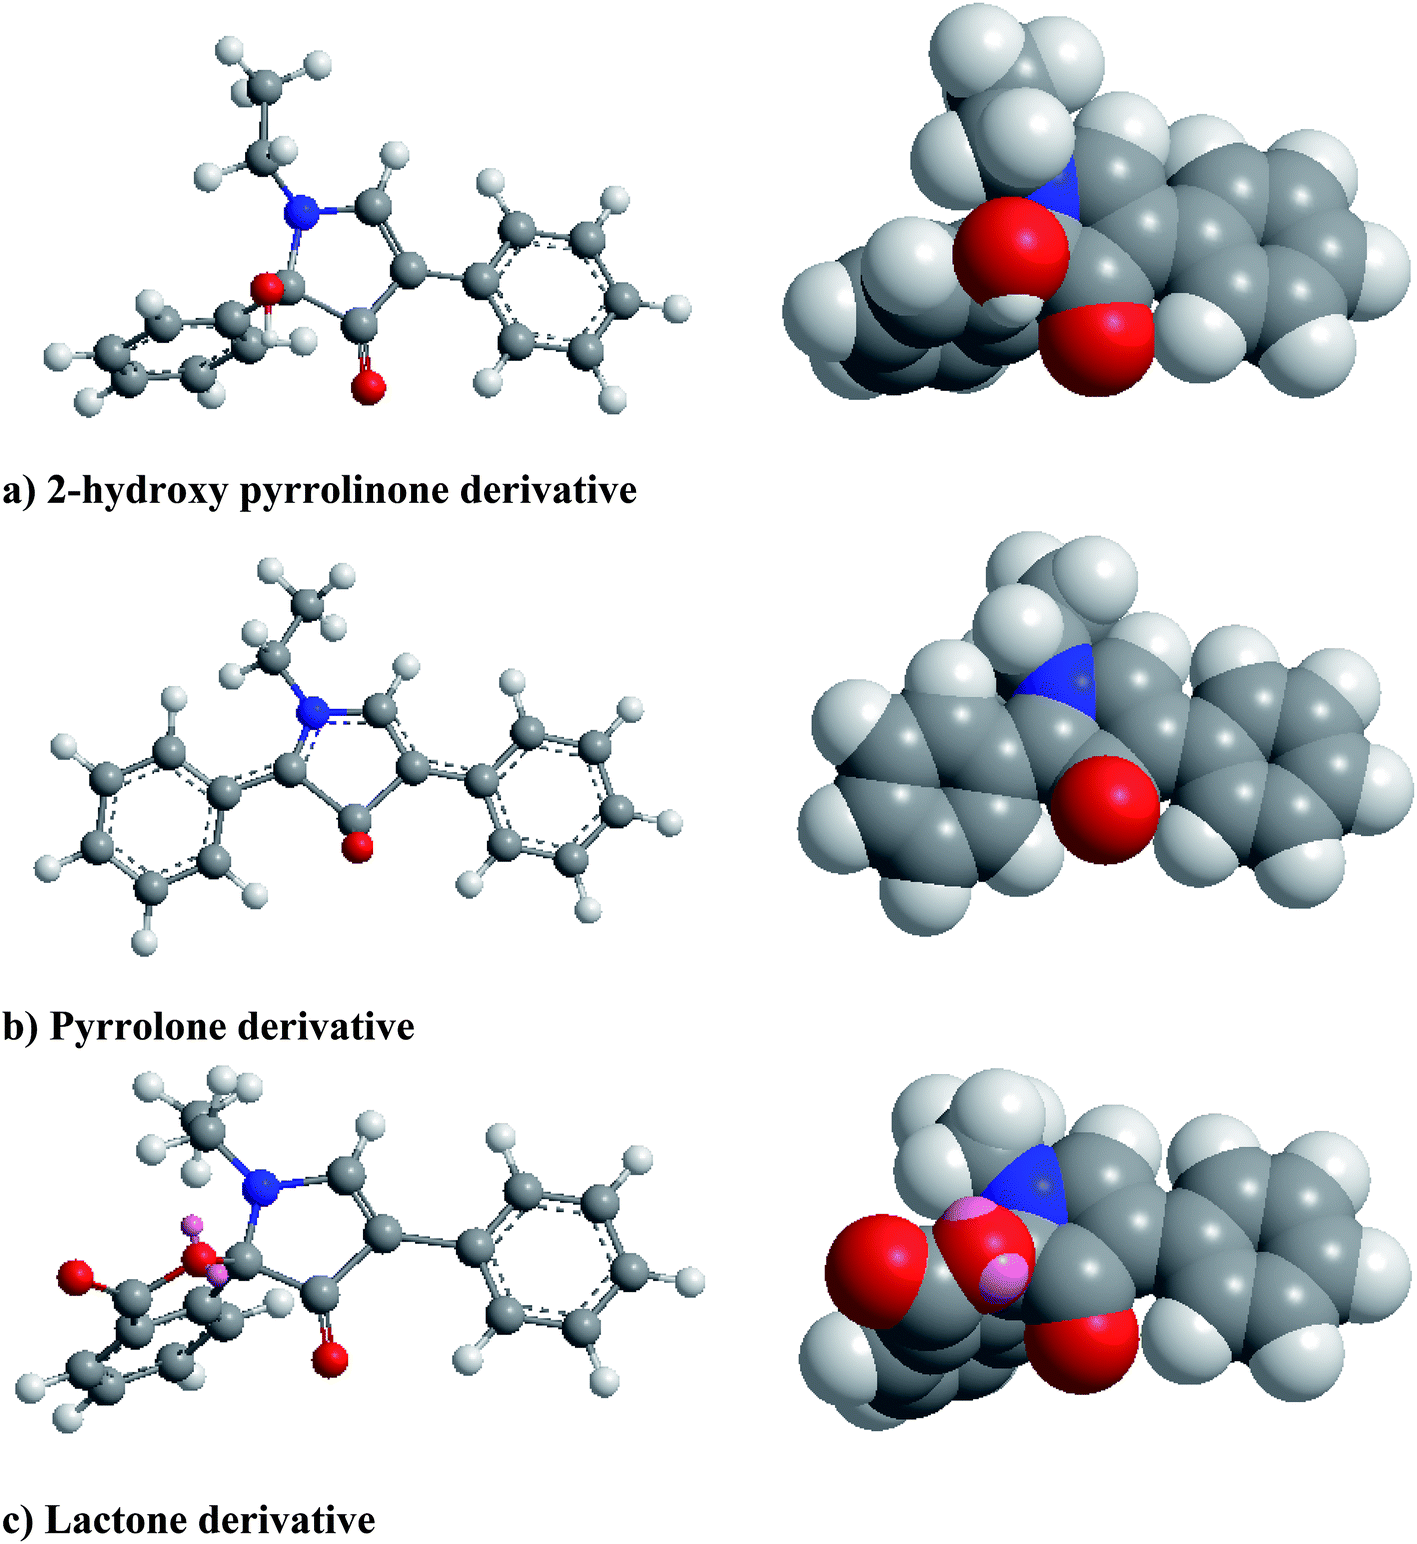
From the first time when fluorescamine was used as a fluorescent reagent, it has been claimed and routinely accepted that the diaryl-2-hydroxy-pyrrolinone derivative was the fluorescent product (Fig. 2).39 However, the presence of carbon 2 of the 2-hydroxy pyrrolinone molecule in the tetrahedral configuration interrupts the full conjugation of the three ring system and prevents its existence in the coplanar form (Fig. 3). As a result, the claimed reaction product which has high structural similarity to fluorescamine was expected to be deficient in any fluorescence activity. Nevertheless, it is well established that the quaternary hydroxide of N-heterocycle could be converted into the corresponding N-quaternary heterocyclic cation.40 The inter-conversion between the 2-hydroxy pyrrolinone and the pyrrolone cation is reversible and pH dependent being the hydroxylated form is predominant in the highly basic medium (Fig. 2). While the hydroxyl pyrrolinone has buckled and non-planar structure, the pyrrolone cation is unsaturated, fully conjugated, completely planar molecule with rigid structure and hence highly fluorescent (Fig. 3). In conclusion, the planar and highly conjugated pyrrolone structure is supposed to be responsible for the fluorescence activity of the reaction product rather than the routinely reported 2-hydroxy pyrrolinone structure. A suggested reaction mechanism was presented in Fig. 4 in which the chemical derivatization proceed through the primary aromatic amino group of the drug.
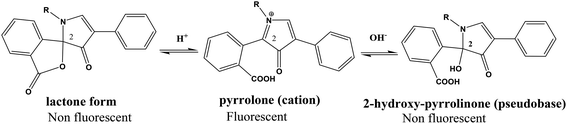 |
| | Fig. 2 pH dependent chemical structure change of fluorescamine derivative; lactone, iminium and alkanolamine forms (R represent the lisinopril residue). | |
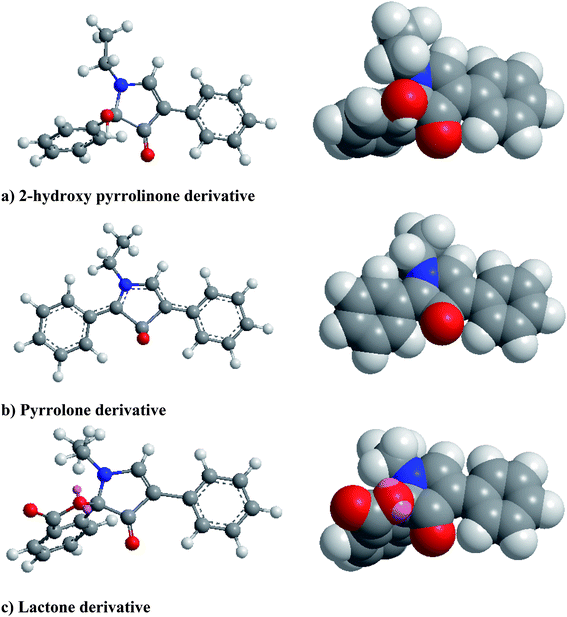 |
| | Fig. 3 Molecular structures (ball and sticks on the left and space filling on the right) of the possible fluorescamine derivatives showing their geometric features. Structures were create with the CS Chem3D 8 ultra software (CambridgeSoft corporation, Cambridge, MA, USA). The geometry of the structures were optimized using MM2 force field method. To simplify the structures, the nitrogen atom was linked to ethyl group instead of lisinopril residue. | |
 |
| | Fig. 4 The suggested chemical reaction for the fluorescence switch of the reagent by the primary amino group of lisinopril. | |
3.1. Optimization of the experimental factors
Different experimental parameters (pH, fluorescamine concentration, reaction time, volume of buffer and the diluting solvent) were optimized. Each variable was changed, while keeping the other constant. In all experiments the final concentration of lisinopril was 2 μg mL−1.
3.1.1. Effect of pH. The procedure for chemical derivatization was carried out using different types of buffers and at different pH. It was observed that the preferred reaction medium was the faint alkaline (pH 9.2–9.8). A distinct decrease in the fluorescence intensity was observed at pH lower or higher pH than this range (Fig. 5).
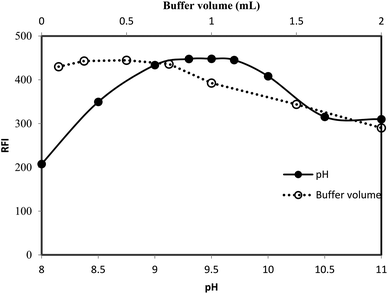 |
| | Fig. 5 Effect of pH (-●-) and volume of borate buffer (-○-) on the RFI of the reaction product between lisinopril (2 μg mL−1) and fluorescamine reagent. | |
The loss of the emission of fluorescamine derivative in the highly acid or alkaline media could be attributed to the structural changes of that derivative (Fig. 2). At highly basic pH, the electron-deficiency at carbon 2 of the fluorescamine product render the compound susceptible to nucleophilic substitution by the electron-rich group, hydroxide ions. Accordingly, the 2-hydroxy-pyrrolinone derivative was formed. On the other hand, the loss of fluorescence at acidic pH may be due to the conversion of the pyrrolone derivative into the non-planar lactone.41 This lactone has a similar structure to fluorescamine itself. In addition, the carbon 2 in both the 2-hydroxy-pyrrolinone and lactone derivatives become tetrahedral. Consequently, the compound would be in the non-planner form with the loss of the fluorescence activity.
3.1.2. Effect of buffer type and strength. The effect of the chemical composition of the buffer was investigated using different type of buffer (pH 9.5). It was found that borate buffer gave the highest reading compared with acetate, phosphate or Teorell and Stenhang buffers. Finally the influence of the buffer strength on the fluorescence intensity was studied using different volumes of borate buffer solution (pH 9.5). As shown in Fig. 5, the highest reading was attained using 0.5 ± 0.2 mL of the buffer. Therefore, 0.5 mL of borate buffer of pH 9.5 was use throughout the work.
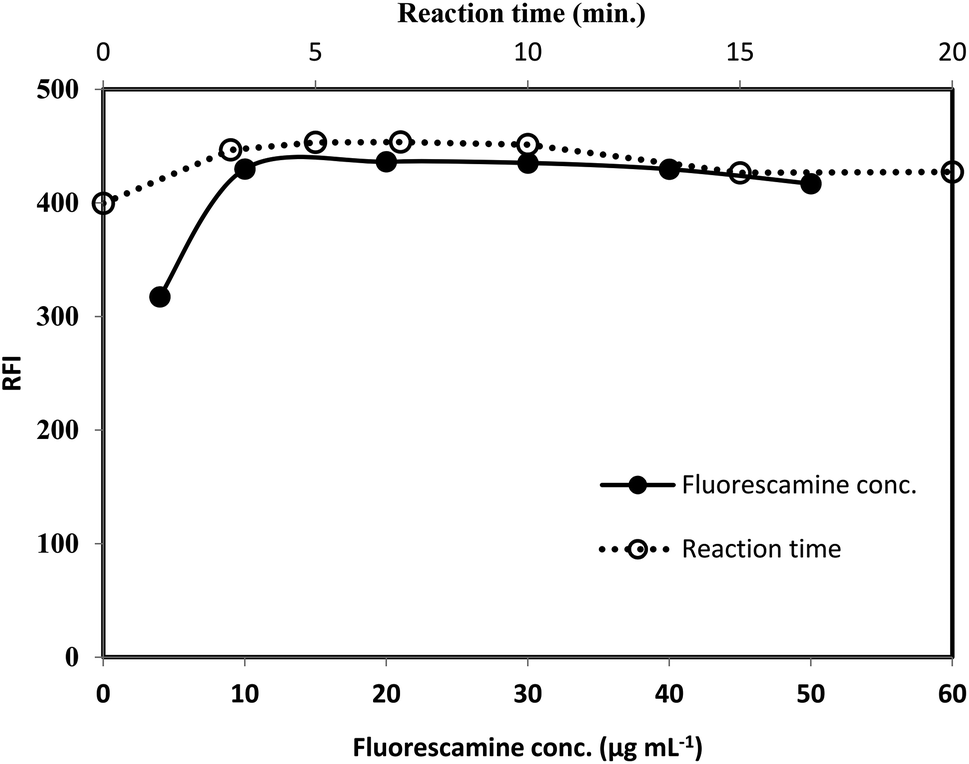
3.1.3. Effect of fluorescamine concentration. The effect of the reagent concentration was examined using fixed volume (1 mL) of fluorescamine solutions having different concentrations (50–500 μg mL−1). By increasing the reagent concentration, the fluorescence intensity was gradually increased. Maximum fluorescence intensity was achieved upon using 100 μg mL−1 of fluorescamine solution. Further increase in the reagent have a negligible effect on the reading (Fig. 6). Therefore, 1 mL of 200 μg mL−1 of fluorescamine solution was selected for the recommended analytical procedure.
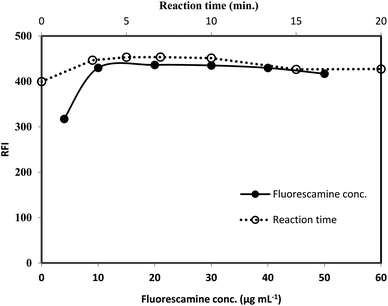 |
| | Fig. 6 Effect of fluorescamine concentration (-●-) and reaction time (-○-) on the RFI of the product of reaction between lisinopril (2 μg mL−1) and fluorescamine reagent. | |
3.1.4. Formation and stability of the reaction product. The formation of the reaction product was monitored by measuring the fluorescence intensity at interval of times. It was observed that, the reaction between the drug and the reagent was very fast and completed within very short time as the maximum fluorescence intensity was reached within 5 min. The intensity was remained stable for at least 20 min at room temperature, Fig. 6. The reaction was carried out at temperature higher than room temperature (25 °C), but, a significant decrease in the fluorescence intensity was observed. The reduction in the intensity may be due to the high internal conversion process that occur at the elevated temperature, stimulating the non radiative deactivation of the excited singlet state. Consequently, the recommended procedure were performed at room temperature and the fluorescence intensity was measured after 7 min.
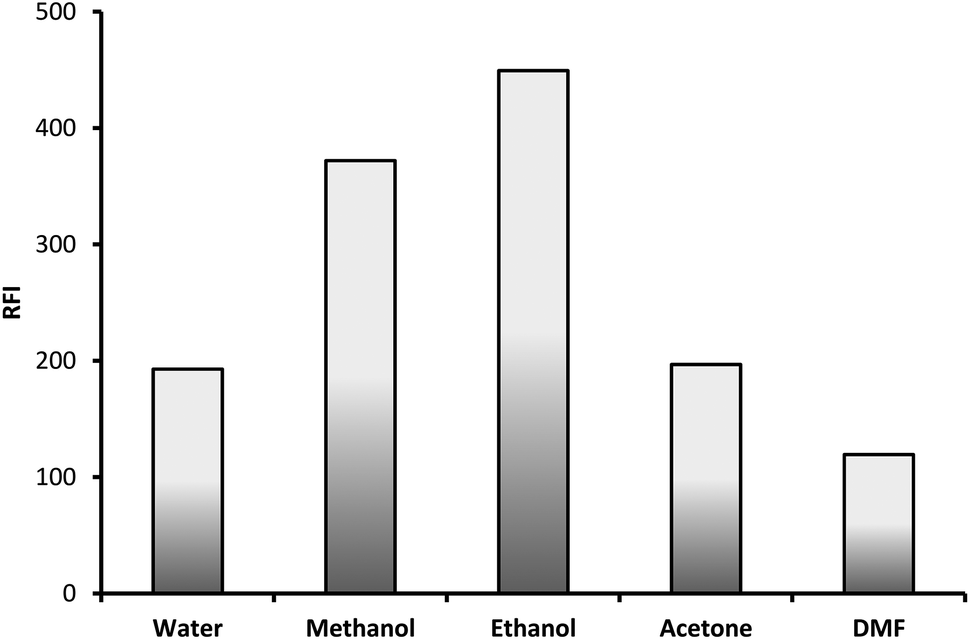
3.1.5. Effect of diluting solvent. The formed fluorescent product was diluted with different solvent in order to select the most appropriate one. The examined solvents were water, methanol, ethanol, acetone and dimethyl formamide. Ethanol was found to be the best solvent as it gave the highest fluorescence intensity and therefore was selected for the subsequent experiments (Fig. 7).
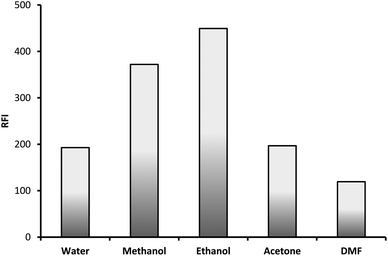 |
| | Fig. 7 Effect of diluting solvent on the RFI of the product of reaction between lisinopril (2 μg mL−1) and fluorescamine reagent. | |
3.2. Determination of the reaction stoichiometry
Job's method of continuous variation was applied to find out the ratio between the drug and the reagent. The reaction stoichiometry was investigated using equimolar solutions (1.2 × 10⁻⁴ M) of both lisinopril and fluorescamine. The study revealed that the molar ratio between lisinopril and fluorescamine is 1![[thin space (1/6-em)]](https://www.rsc.org/images/entities/char_2009.gif) :1 (Fig. 8). This ratio is in agreement with the suggested reaction mechanism presented in Fig. 4.
:1 (Fig. 8). This ratio is in agreement with the suggested reaction mechanism presented in Fig. 4.
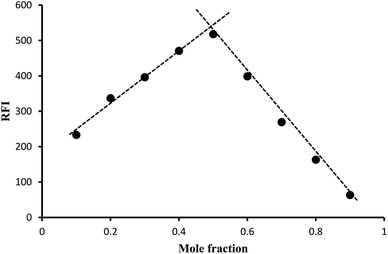 |
| | Fig. 8 Job's method for determination of the stoichiometry of the reaction by using 1.2 × 10⁻⁴ M concentration of both lisinopril and fluorescamine. | |
3.3. Validation of the proposed method
After optimization of the method parameters, the proposed method was validated by application of ICH guidelines42 to find out the accuracy, precision, selectivity, limit of detection and limit of quantitation.
3.3.1. Linearity and range. A series of the standard solutions containing different concentrations of lisinopril were analyzed by applying the general analytical procedure. The calibration curve was constructed by plotting the obtained RFI versus the corresponding drug concentration. Linear regression analysis was performed on the obtained data and the statistical parameters are calculated (Table 1). It was found that the drug concentration is linear with RFI in the range 0.55–4.5 μg mL−1 with high linearity (r2 = 0.9986).
Table 1 The statistical parameters of the proposed method for analysis of LIS
| Parameter |
Value |
| Number of determinations is 8. |
| Linear range (μg mL−1) |
0.55–4.5 |
| Slope |
185.66 |
| Standard deviation of slope (Sb) |
3.75 |
| Intercept |
72.15 |
| Standard deviation of the intercept (Sa) |
10.26 |
| Correlation coefficienta |
0.9986 |
| Standard deviation of residuals (Sy,x) |
16.56 |
| Limit of detection (LOD, μg mL−1) |
0.182 |
| Limit of quantitation (LOQ, μg mL−1) |
0.552 |
3.3.2. Detection and quantitation limits. The sensitivity of the method was evaluated by calculating the limits of detection (LOD) and quantitation (LOQ). The calculation was performed according to the equations; LOD = 3.3 σ/S and LOQ = 10 σ/S, where S is the slope of the calibration curve and σ is the standard deviation of intercept. The calculated LOD and LOQ are 0.18 and 0.55 μg mL−1, respectively. These limits indicate the high sensitivity of the developed method compared with the reported spectrophotometric methods,2–10 and spectrofluorimetric method based on condensation with naphthylamine13 (Table 2). Although the reported spectrofluorimetric methods applying Hantzsch reaction10 or nucleophilic substitution with NBD-Cl11 had higher sensitivity than the proposed method, both were time consuming and tedious. In addition, all the reported spectroflourimetric methods were carried out at elevated temperatures. On the other hand, the developed procedure is fast, involves single step reaction, utilizes a single reagent and is carried out at room temperature. Despite the fact that fluorescamine is not the cheapest reagent on the shelf, the sensitivity of the method may result in a much lower price per sample. A comparison of the proposed method with the previously reported spectrophotometric and spectrofluorimetric methods is summarized in Table 2.
Table 2 Comparison of the proposed spectrofluorimetric method with the reported spectrophotometric and spectrofluorimetric methods for the determination of lisinopril
| Reagent(s) |
Reaction temperature |
Reaction time |
LOQ μg mL−1 |
LOD μg mL−1 |
Ref. |
| NBD-Cl is 7-chloro-4-nitrobenzofurazan and NQS is 1,2-naphthoquinone-4-sulphonate sodium. 25 °C mean room temperature and ∼100 °C was obtained by heating on a boiling water bath. |
| I. Spectrophotometry |
| Ninhydrin and sodium molybdate |
90 °C |
10 min |
1.30 |
0.39 |
2 |
| NQSa |
25 °Cb |
5 min |
5.0 |
1.16 |
3 |
| Derivative spectrophotometry |
25 °Cb |
0 min |
1.5 |
0.6 |
4 |
| o-Phenylenediamine |
80 °C |
25 min |
2.0 |
— |
5 |
| Ninhydrin in DMF |
80 °C |
5 min |
18.4 |
5.59 |
6 |
| 2,4-Dinitrofluoro-benzene |
60 °C |
20 min |
2.98 |
0.87 |
7 |
| 1-Fluoro-2,4-dinitrobenzene |
60 °C |
45 min |
14 |
4.6 |
8 |
| Sodium hypochlorite and phenylhydrazine |
85 °C |
20 min |
20 |
5 |
9 |
| Chloranil |
60 °C |
40 min |
4.0 |
— |
10 |
|
| II. Spectrofluorimetry |
| Acetylacetone and formaldehyde |
∼100 °C |
10 min |
0.03 |
— |
10 |
| NBD-Cla |
60 °C |
70 min |
0.05 |
0.02 |
11 |
| Fluorescein |
60 °C |
5 min |
0.03 |
0.01 |
12 |
| 1-Naphthylamine |
50 °C |
5 min |
2.5 |
1.0 |
13 |
| Ninhydrin and phenylacetaldehyde |
80 °C |
10 min |
0.12 |
0.04 |
14 |
| Ethylacetoacetate and formaldehyde |
∼100 °C |
25 min |
0.48 |
0.16 |
15 |
| Fluorescamine |
25 °Cb |
7 min |
0.55 |
0.18 |
This work |
3.3.3. Accuracy and precision. Standard addition method was applied to evaluate the accuracy of the method. Three different concentrations of the standard drug solution were added to the tablet solution of known concentration. The total drug concentration in the final solutions were determined by applying the general analytical procedure. The high precision of the method was revealed from the closeness of the % recovery to 100% (Table 3). In addition, it was concluded that the presence of tablets excipients did not affect the obtained results and the high selectivity of the suggested procedure.
Table 3 Standard addition method for determination of lisinopril in different tablets
| No. |
Conc. taken (μg mL−1) |
Standard added (μg mL−1) |
Total conc. (μg mL−1) |
% recovery |
| Maxipril® 20 mg tablets |
Sinopril Co® tablets |
| 1 |
1.0 |
0.5 |
1.5 |
100.73 |
101.44 |
| 2 |
1.0 |
1.0 |
2.0 |
99.35 |
100.64 |
| 3 |
1.0 |
1.5 |
2.5 |
99.36 |
98.90 |
| Mean |
|
|
|
99.82 |
100.33 |
| SD |
|
|
|
0.796 |
1.29 |
| RSD |
|
|
|
0.798 |
1.29 |
Two levels of precision were evaluated for the developed method; intra- and inter-day precisions. Three different concentrations (1.0, 1.5 and 2.0 μg mL−1) of lisinopril were analysed in three replicates within the same day in case of inter-day precision or at three successive days for intra-day precision. The relative standard deviation were calculated in each case. It was shown (Table 4) that RSD did not exceed 2% which gives a prove for the high precision of the proposed method.
Table 4 Intraday and interday precision of the proposed method
| Precision level |
Conc. level (μg mL−1) |
% recoverya ± RSD |
| The value is the average of three determinations. |
| Intra-day precision |
1.0 |
101.19 ± 1.01 |
| 1.5 |
97.13 ± 1.47 |
| 2.0 |
100.55 ± 1.39 |
| Inter-day precision |
1.0 |
100.63 ± 1.83 |
| 1.5 |
98.75 ± 0.68 |
| 2.0 |
102.11 ± 1.18 |
3.3.4. Robustness. The robustness of the developed method was examined by changing some experimental parameters (pH, buffer volume, fluorescamine concentration and reaction time) during performing the general analytical procedure. The % recovery and relative standard deviation (RSD) were calculated for each parameters. As shown in Table 5, it is clear that analytical performance of the method did not affected significantly by these variations as good % recoveries and low RSD were obtained. This gave an indication for the robustness of the proposed method.
Table 5 Robustness of the proposed method for analysis of lisinopril (2 μg mL−1)
| Optimization factor |
Value |
% recoverya |
Mean ± SD |
% RSD |
| The value is the average of three determinations. |
| Borate buffer pH |
9.3 |
101.19 |
102.34 ± 1.04 |
1.01 |
| 9.5 |
102.60 |
| 9.7 |
103.22 |
| Borate buffer volume (mL) |
0.2 |
99.91 |
99.44 ± 1.23 |
1.23 |
| 0.5 |
100.37 |
| 0.8 |
98.05 |
| Reaction time (min) |
5 |
102.68 |
102.54 ± 0.32 |
0.32 |
| 7 |
102.77 |
| 10 |
102.17 |
| Fluorescamine volume (mL) |
0.5 |
96.34 |
97.40 ± 0.93 |
0.96 |
| 1 |
98.09 |
| 1.5 |
97.78 |
3.3.5. Selectivity. To study the selectivity of the method, different tablet excipients that are commonly incorporated in lisinopril dosage forms, in addition to hydrochlorothiazide were added separately to the drug standard solution. The general analytical procedure was applied to find out the drug concentration and the results are expressed in % recovery ± SD. As shown in Table 6, it is clear that none of these excipients and hydrochlorothiazide produced any significant interference with the results of the proposed method which give a prove for its selectivity for determination of lisinopril.
Table 6 Analysis of lisinopril (2 μg mL−1) in presence of the common excipients that are present in its commercially available dosage forms
| Excipients |
Amount added (mg) |
% recoverya ± SD |
| The value is the average of three determinations. |
| Maize starch |
10 |
102.10 ± 1.76 |
| Mannitol |
10 |
103.59 ± 0.61 |
| Magnesium stearate |
10 |
101.01 ± 0.48 |
| Dibasic calcium phosphate |
10 |
99.85 ± 1.74 |
| Hydrochlorothiazide |
0.012 |
101.46 ± 1.29 |
3.4. Applications of the proposed method
3.4.1. Application to pharmaceutical dosage forms. After development and full validation of the proposed analytical procedure, it was successfully applied for analysis of pharmaceutical formulations containing lisinopril either alone or in the presence of hydrochlorothiazide. In the same time the dosage forms were analyzed by a reported method10 and the results of both methods were statistically compared regarding the accuracy and precision using Student's t-test and F-test. It was found that, the calculated values of both parameters did not exceed the theoretical values at 95% confidence level. This gives an indication about the acceptable level of the reliability of the proposed method Table 7. The good recoveries obtained gives an evidence for the absence of any significant interference from either tablet excipients or the co-formulated drug, hydrochlorothiazide. It was expected that hydrochlorothiazide could not react with fluorescamine because it do not contain any basic amino group in its structure. As a result it did not interfere with the analysis of lisinopril. Therefore, the method can be a good alternative for the quality control of drug products containing lisinopril.
Table 7 Application of the proposed method on different commercial tablets by both the proposed and the reported10 methods
| Dosage forms |
% recoverya ± SD |
F-value |
t-valueb |
| Proposed method |
Reported method |
| The value is the mean of five determinations for both the proposed and reported method. Tabulated values at 95% confidence limit are t = 2.306, F = 6.338. |
| Maxipiril® tablets |
101.15 ± 1.71 |
103.08 ± 1.96 |
1.46 |
1.62 |
| Sinopril Co® tablets |
99.57 ± 1.42 |
101.57 ± 1.49 |
1.10 |
2.19 |
3.4.2. Content uniformity testing. The content uniformity testing is carried out to guarantee the consistency of pharmaceutical dosage units. Accordingly, each unit in a batch should have a drug substance content within a narrow range around the label claim.38 This procedure is a time-consuming process when using conventional assay techniques. However, the proposed method was preferably suitable for testing the content uniformity of lisinopril due to its high sensitivity and fast measurement of the fluorescence intensity of a single tablet extract with sufficient accuracy. The proposed method was successfully adopted to estimate the content uniformity according to the USP procedures38 for tablets extracts of both Sinopril® and Sinopril Co® tablets. The acceptance value (AV) was calculated was found to be less than the maximum allowed acceptance value (L1) which indicates excellent uniformity of the tested dosage forms (Table 8).
Table 8 Results for the content uniformity testing using the proposed method
| Tablet number |
% recovery of the claimed content of tablets |
| Sinopril® 10 mg tablets |
Sinopril Co® tablets |
| 1 |
100.44 |
97.82 |
| 2 |
100.65 |
101.89 |
| 3 |
98.42 |
100.33 |
| 4 |
103.79 |
101.07 |
| 5 |
101.58 |
101.25 |
| 6 |
101.71 |
101.89 |
| 7 |
100.48 |
101.87 |
| 8 |
102.12 |
102.93 |
| 9 |
102.99 |
100.38 |
| 10 |
97.01 |
96.84 |
| Mean |
100.92 |
100.62 |
| SD |
2.03 |
1.911 |
| RSD |
2.01 |
1.90 |
| Acceptance value (AV) |
4.87 |
4.59 |
| Maximum allowed AV (L1) |
15 |
15 |
4. Conclusion
The current work illustrates the development and validation of a simple, rapid, and reliable spectrofluorimetric method for the analysis of dosage forms containing lisinopril. The method overcomes the drawbacks that were found in the previously reported methods and was applied successfully for content uniformity testing of dosage forms containing the cited drug. In addition, the proposed method is highly selective since it could determine lisinopril in the presence of the co-formulated drug, hydrochlorothiazide, without any possible interference. Consequently, the suggested method can be applied in quality control analysis of lisinopril owing to its improved simplicity, sensitivity and their independence on expensive instruments.
Conflicts of interest
There are no conflicts to declare.
References
- L. L. Brunton, J. S. Lazo and K. S. Parker, Goodman & Gilman's the Pharmacological Basis of Therapeutics, 11th edn, 2006 Search PubMed.
- P. Nagaraja, A. K. Hrestha, A. Shivakumar and N. G. S. Al-Tayar, J. Food Drug Anal., 2011, 19, 85–93 CAS.
- A. A. A. Ali and A. A. Elbashir, Am. Acad. Sch. Res. J., 2013, 5, 106 Search PubMed.
- A. El-Gindy, A. Ashour, L. Abdel-Fattah and M. M. Shabana, J. Pharm. Biomed. Anal., 2001, 25, 923–931 CrossRef CAS PubMed.
- C. Jamakhandi, C. Javali, J. Disouza, U. Chougule and A. Mullani, Int. J. Pharm. Pharm. Sci., 2011, 3, 185–187 CAS.
- A. Raza, T. M. Ansari and R. Atta-ur, J. Chin. Chem. Soc., 2005, 52, 1055–1059 CrossRef CAS.
- O. A. Razak, S. Belal, M. Bedair, N. Barakat and R. Haggag, J. Pharm. Biomed. Anal., 2003, 31, 701–711 CrossRef PubMed.
- G. Paraskevas, J. Atta-Politou and M. Koupparis, J. Pharm. Biomed. Anal., 2002, 29, 865–872 CrossRef CAS PubMed.
- A. El-Gindy, A. Ashour, L. Abdel-Fattah and M. M. Shabana, J. Pharm. Biomed. Anal., 2001, 25, 913–922 CrossRef CAS PubMed.
- F. A. El-Yazbi, H. H. Abdine and R. A. Shaalan, J. Pharm. Biomed. Anal., 1999, 19, 819–827 CrossRef CAS PubMed.
- E. S. Aktas, L. Ersoy and O. Sagırlı, Il Farmaco, 2003, 58, 165–168 CrossRef CAS PubMed.
- C. Jamakhandi, C. Javali, S. Kumar, S. Kumar and D. S. Sanjay-Kumar, Int. J. Pharm. Sci. Drug Res., 2010, 2, 182–187 CAS.
- C. Jamkhandi, C. Javali, S. Kumar and D. Kadadevar, Int. J. Pharmacol. Pharm. Sci., 2010, 2, 209–211 Search PubMed.
- S. M. Derayea, K. M. Badr El-Din and F. F. Mohammed, Luminescence, 2017, 32, 1482–1487 CrossRef CAS PubMed.
- S. M. Derayea, K. M. B. El-din and F. F. Mohammed, Spectrochim. Acta, Part A, 2018, 188, 318–323 CrossRef CAS PubMed.
- F. Elsebaei and Y. Zhu, Talanta, 2011, 85, 123–129 CrossRef CAS PubMed.
- C. A. Beasley, J. Shaw, Z. Zhao and R. A. Reed, J. Pharm. Biomed. Anal., 2005, 37, 559–567 CrossRef CAS PubMed.
- D. Bonazzi, R. Gotti, V. Andrisano and V. Cavrini, J. Pharm. Biomed. Anal., 1997, 16, 431–438 CrossRef CAS PubMed.
- S. Bouabdallah, H. Trabelsi, K. Bouzouita and S. Sabbah, J. Biochem. Biophys. Methods, 2002, 54, 391–405 CrossRef CAS PubMed.
- E. R. Dawud and A. K. Shakya, Arabian J. Chem., 2014 DOI:10.1016/j.arabjc.2014.10.052.
- A. A. El-Emam, S. H. Hansen, M. A. Moustafa, S. M. El-Ashry and D. T. El-Sherbiny, J. Pharm. Biomed. Anal., 2004, 34, 35–44 CrossRef CAS PubMed.
- C. Kousoulos, G. Tsatsou, Y. Dotsikas and Y. L. Loukas, Anal. Chim. Acta, 2005, 551, 177–183 CrossRef CAS.
- V. Kumar, R. P. Shah and S. Singh, J. Pharm. Biomed. Anal., 2008, 47, 508–515 CrossRef CAS PubMed.
- Y. X. Liu, D. Shou, M. L. Chen, Z. D. Chen, P. M. Zhang and Y. Zhu, Chin. Chem. Lett., 2012, 23, 335–338 CrossRef CAS.
- V. Maslarska and J. Tencheva, Int. J. Pharm. Biol. Sci., 2013, 4, 163–167 CAS.
- P. G. Nagaraju, A. Bilal and V. Siddhartha, Int. J. Chem. Pharm. Sci., 2014, 2, 635–641 CAS.
- J. V. Odovic, B. D. Markovic, R. D. Injac, S. M. Vladimirov and K. D. Karljikovic-Rajic, J. Chromatogr. A, 2012, 1258, 94–100 CrossRef CAS PubMed.
- O. Sagirli and L. Ersoy, J. Chromatogr. B, 2004, 809, 159–165 CrossRef CAS PubMed.
- V. M. Sarma, Int. J. Curr. Res. Acad. Rev., 2015, 3, 226–233 Search PubMed.
- Y.-c. Wong and B. G. Charles, J. Chromatogr. B: Biomed. Sci. Appl., 1995, 673, 306–310 CrossRef CAS PubMed.
- A. A. Padua, R. E. Barrientos-Astigarraga, V. M. Rezende, G. D. Mendes and G. De Nucci, J. Chromatogr. B, 2004, 809, 211–216 CrossRef CAS PubMed.
- S. Hillaert and W. Van den Bossche, J. Chromatogr. A, 2000, 895, 33–42 CrossRef CAS PubMed.
- S. Hillaert and W. Van den Bossche, J. Pharm. Biomed. Anal., 2001, 25, 775–783 CrossRef CAS PubMed.
- S. Hillaert, Y. Vander Heyden and W. Van den Bossche, J. Chromatogr. A, 2002, 978, 231–242 CrossRef CAS PubMed.
- R. Gotti, V. Andrisano, V. Cavrini, C. Bertucci and S. Furlanetto, J. Pharm. Biomed. Anal., 2000, 22, 423–431 CrossRef CAS PubMed.
- C. K. Zacharis, P. D. Tzanavaras, D. G. Themelis, G. A. Theodoridis, A. Economou and P. G. Rigas, Anal. Bioanal. Chem., 2004, 379, 759–763 CrossRef CAS PubMed.
- A. Yuan and J. Gilbert, J. Pharm. Biomed. Anal., 1996, 14, 773–781 CrossRef CAS PubMed.
- M. Rockville, The United States Pharmacopoeia 30, The National Formulary 25 US Pharmacopeial Convention, Electronic version, 2007 Search PubMed.
- M. Weigele, S. L. DeBernardo, J. P. Tengi and W. Leimgruber, J. Am. Chem. Soc., 1972, 94, 5927–5928 CrossRef CAS.
- A. A. Savina, O. N. Tolkachev, V. I. Sheichenko and V. V. Proskudina, Pharm. Chem. J., 1999, 33, 25–28 Search PubMed.
- S. De Bernardo, M. Weigele, V. Toome, K. Manhart, W. Leimgruber, P. Böhlen, S. Stein and S. Udenfriend, Arch. Biochem. Biophys., 1974, 163, 390–399 CrossRef CAS PubMed.
- ICH Harmonized Tripartite Guideline, Validation of analytical procedures: text and methodology Q2 (R1), Geneva, 2005, available at: http://www.ich.org/fileadmin/Public_Web_Site/ICH_Products/Guidelines/Quality/Q2_R1/Step4/Q2_R1__Guideline.pdf, [accessed 27 April, 2018] Search PubMed.
|
| This journal is © The Royal Society of Chemistry 2018 |
Click here to see how this site uses Cookies. View our privacy policy here. 
 Open Access Article
 This Open Access Article is licensed under a Creative Commons Attribution-Non Commercial 3.0 Unported Licence
 *a
*a