 Open Access Article
Sorption of tetracycline on biochar derived from rice straw and swine manure†
Hua Wangab,
Chengran Fang *ab,
Qun Wangab,
Yixuan Chuab,
Yali Songab,
Yongmin Chenab and
Xiangdong Xueab
aKey Laboratory of Recycling and Eco-treatment of Waste Biomass of Zhejiang Province, Zhejiang University of Science and Technology, Hangzhou 310023, Zhejiang, China. E-mail: fangchengr@163.com
bSchool of Civil Engineering and Architecture, Zhejiang University of Science and Technology, Hangzhou 310023, Zhejiang, China
First published on 1st May 2018
Abstract
Biochar is an efficient and cost-effective sorbent for removing contaminants from aqueous environments. In this study, biochar samples derived from rice straw (R) and swine manure (M) pyrolyzed at 400 °C (R400 and M400) and 600 °C (R600 and M600) were used to adsorb tetracycline from an aqueous solution. The adsorption of tetracycline on both types of biochar included multi-step adsorption processes that were well described by the pseudo-second-order kinetics model (R2 > 0.99). The adsorption equilibrium of tetracycline on rice straw and swine manure derived biochar was reached after 24 h and 36 h respectively. The solution pH affected the adsorption processes by changing the surface charges of tetracycline and biochar. Adsorption isotherms fitted both the Langmuir and Freundlich models well. The adsorption capacity was higher in biochar derived from rice straw than in biochar derived from swine manure, and increased with increasing pyrolysis temperature. Thermodynamic analysis revealed a spontaneous and endothermic tetracycline adsorption process. The values of the adsorption coefficient (Kd) were on the order of 103 for R600 and 102–103 for the other three types of biochar. These experiments indicate that R600 can be used as an inexpensive adsorbent to remove tetracycline from aqueous solutions, but swine manure derived biochar needs more improvement to be a suitable adsorbent.
1. Introduction
Tetracyclines are some of the most commonly used veterinary antibiotics and growth promoters in the livestock industry.1 However, the majority of tetracyclines cannot be absorbed by the animals to which they are applied. It has been reported that up to 50–80% of tetracyclines are excreted into the environment with feces and urine in an unchanged form.2 These residual tetracyclines accumulate in the aquatic and soil environment through domestic wastewater effluent and agricultural use of the feces of livestock animals.3,4 Once in the environment, antibiotics exert adverse effects such as the promotion of antibiotic resistance via gene transfer within pathogenic bacteria, as well as the development of multi-resistant bacterial strains.5 Therefore, it is important to develop efficient and cost-effective treatment technologies for the removal of tetracycline.Adsorption has been confirmed to be a practically feasible and efficient means of controlling tetracycline transport in the environment.6 Recent studies have focused on the adsorption of tetracycline by various adsorbents, including natural or engineered ones such as soils,7 activated carbons,8 carbon nanotubes9 and graphene oxide.10 For example, Ji et al.9 found that the adsorption coefficient (Kd) of single-walled carbon nanotubes for tetracycline adsorption was 103–104 L kg−1. However, these materials are expensive. It has been reported that the cost of carbon nanotubes is $120–180 per kilogram.11 Therefore, it is necessary to identify lower cost alternatives, especially for use in large scale water treatment facilities.12
Biochar, which is a carbon rich solid that is pyrolyzed from various types of waste biomass, is considered to be a promising resource for soil amendments and the treatment of contaminated water.6,13 Biochar acts as a kind of efficient and cost-effective sorbent which is capable of removing contaminants including organic or inorganic pollutants from aqueous environments.14 Previous studies have revealed the effects of a variety of factors on the adsorption of tetracycline by biochar, including pyrolysis temperature,15 pH and metal concentration of the solution16 and modifications of the biochar using various methods.17 For example, Zhang et al.15 studied the adsorption capacities of biochar derived from corn straw pyrolyzed at different temperatures (100–600 °C) and found that biochar pyrolyzed at 600 °C had the highest adsorption affinity. The biomass feedstock of biochar may influence the adsorption capacity of tetracycline because of different biochar characteristics;18 however, few studies have been conducted to assess the effects of biochar feedstock on tetracycline adsorption.
Rice straw and swine manure are two of the most abundant agricultural wastes in China.19,20 These residuals have received widespread environmental concern, especially swine manure that contains various antibiotics and antibiotic resistance genes.21,22 Converting these low cost, high carbon and abundant residuals into biochar can reduce the adverse environmental effects and produce renewable energy.23 There are many reports regarding the adsorption of tetracycline by biochar, but these studies mainly focus on biochar derived from the residue of plants. Until now, little research has involved the adsorption process of biochar from livestock manure, including swine manure. The mechanisms involved in the adsorption process of tetracycline on biochar from swine manure are still not clear. Therefore, our objectives in this study were to: (1) compare the characteristics of biochar derived from rice straw and swine manure; (2) investigate the adsorption capacities of tetracycline on both types of biochar and analyze the mechanisms by which tetracycline and the biochar interact.
2. Methods and materials
2.1 Materials
The rice straw and fresh swine manure were obtained from cropland and an intensive swine production unit, respectively, in Hangzhou, Zhejiang province, China. Biochar was produced by pyrolyzing air-dried samples at 400 °C or 600 °C under oxygen-limited conditions in a muffle furnace. The sample temperature was increased to the target pyrolysis temperature, where it was held for 2 h. The four biochar samples are denoted R400, R600, M400 and M600, where R and M are rice straw and swine manure, and 400 and 600 are pyrolysis temperatures of 400 °C and 600 °C, respectively. Once cool, the biochar samples were ground and passed through a 0.15 mm sieve.The sorbate tetracycline (>97.7%, w/w) was obtained from Dr Ehrenstorfer (Ausberg, Germany) while all other chemicals were analytical grade or better.
2.2 Biochar characteristics
Elemental (C, H, O and N) analysis was conducted using an elemental analyzer (Vario MICRO, Elementar, Germany). The Brunauer–Emmett–Teller surface area (SBET) and pore structure parameters of the biochar samples were obtained using an Autosorb-IQC gas analyzer (Quantachrome, USA) with N2 physical adsorption at 77 K. Fourier transform infrared (FTIR) spectroscopy (VERTEX 70, BRUKER, Germany) was used to identify functional groups on the biochar surfaces.2.3 Adsorption experiments
The tetracycline adsorption experiments were performed in batch adsorption mode. Methanol was used to prepare a stock solution of tetracycline (100 mg L−1) where the volume percentage of methanol was <0.1% to minimize possible co-solvent effects on sorption.9 Experiments to investigate the adsorption kinetics of tetracycline onto biochar were performed in a series of 40 mL brown glass vials by mixing 60 mg of biochar with 20 mL tetracycline solution. The tetracycline solution contained 0.01 mol L−1 NaNO3 and 32 mg L−1 tetracycline. The samples were then shaken on a horizontal shaker at 150 rpm at 25 °C for 0.5, 1, 1.5, 2, 5, 8, 12, 18, 24, 36, 48, or 60 h. The samples were subsequently centrifuged at 5000 rpm for 10 min. Next, the supernatant was passed through a 0.45 μm filter and the concentrations of residual tetracycline were measured using high performance liquid chromatography (e2695, Waters, USA) using a C-18 column and a UV-vis spectrometer (2489, Waters, USA) operating at 355 nm.The adsorption isotherm experiments were conducted with various initial tetracycline concentrations of 0.5 to 32 mg L−1 at 25 °C. A 20 mL aqueous solution of 0.01 mol L−1 NaNO3 containing tetracycline and 60 mg biochar was added to a 40 mL brown glass vial that was fitted with a plastic cap. The mixture was shaken at 150 rpm until sorption equilibrium was attained according to adsorption kinetics. The tetracycline concentration of the aqueous solution was determined using the same method as above.
The effect of solution pH on the adsorption of tetracycline by biochar was investigated in another series of batch experiments using a concentration of tetracycline of 16 mg L−1. The pH of the tetracycline solution was varied from 2.0 to 11.0. The influence of the adsorption temperature was determined at 15, 25 and 35 °C with a concentration of tetracycline of 16 mg L−1. The ratio of biochar and tetracycline solution was 60 mg![[thin space (1/6-em)]](https://www.rsc.org/images/entities/char_2009.gif) :
:![[thin space (1/6-em)]](https://www.rsc.org/images/entities/char_2009.gif) 20 mL.
20 mL.
In each experiment, control samples (without biochar or without tetracycline) were simultaneously prepared. However, no measurable change was observed for the tetracycline concentrations during the control experiment. All of the adsorption experiments were performed in triplicate.
2.4 Data analysis
The amount of tetracycline adsorbed on the biochar at time t (qt, mg g−1) was calculated using eqn (1):
 | (1) |
In the adsorption kinetics experiment, the data were fitted using a pseudo-first-order model (eqn (2)), a pseudo-second-order model (eqn (3)), and an intra-particle diffusion model (eqn (4)).
| qt = qe(1 − e−k1t) | (2) |
 | (3) |
| qt = kit1/2 + I | (4) |
The Langmuir (eqn (5)), Freundlich (eqn (6)) and Tempkin (eqn (7)) adsorption models were fitted to the data of the adsorption isotherms.
| qe = qmaxKLCe/(1 + KLCe) | (5) |
| qe = KfCen | (6) |
 | (7) |
3. Results and discussion
3.1 Biochar characteristics
The chemical compositions of the biochar are shown in Table 1. The carbon (C), oxygen (O) and hydrogen (H) content of rice straw biochar was higher than that of swine manure biochar. As the pyrolysis temperature increased, the content of C increased in rice straw biochar, while it decreased in swine manure biochar, which was consistent with the available literature.25 The O and H content of biochar showed a decreasing trend in both types of biochar with increasing pyrolysis temperature. At the same time, the H/C, O/C and (O + N)/C ratios of the two kinds of biochar decreased with increasing pyrolysis temperature, indicating that high pyrolysis temperature results in more aromatic carbon and less hydrophilicity and polarity.26| BC | Ca (%) | N (%) | O (%) | H (%) | O/C | H/C | (O + N)/C | SBET (m2 g−1) | Vtot (cm3 g−1) | Pore width (nm) |
|---|---|---|---|---|---|---|---|---|---|---|
| a The content of C, N, O and H elements in the biochar. | ||||||||||
| R400 | 50.02 | 1.62 | 17.36 | 3.52 | 0.35 | 0.07 | 0.40 | 6.74 | 0.019 | 20.63 |
| R600 | 55.33 | 1.15 | 11.21 | 1.67 | 0.20 | 0.03 | 0.22 | 21.69 | 0.054 | 17.04 |
| M400 | 35.68 | 2.56 | 10.94 | 2.26 | 0.31 | 0.06 | 0.37 | 5.17 | 0.013 | 16.38 |
| M600 | 31.27 | 1.84 | 7.85 | 1.70 | 0.25 | 0.05 | 0.31 | 10.56 | 0.044 | 12.36 |
As the pyrolysis temperature increased, the surface area of the two kinds of biochar increased, especially that of the rice straw biochar which increased from 6.74 to 21.69 m2 g−1 (Table 1). The high pyrolysis temperature causes the precipitation of volatile matter, which subsequently increases the number of micropores, causing an increase in specific surface area and pore volume.27 At the same pyrolysis temperature, the surface area of rice straw biochar was 2.05 times that of swine manure biochar at 600 °C (Table 1). At the same time, the micropore volume and average pore size of rice straw biochar were also higher than those of swine manure biochar. This might be related to the structure of the raw material. This indicates that the pore structure of rice straw biochar is more developed than that of swine manure biochar.
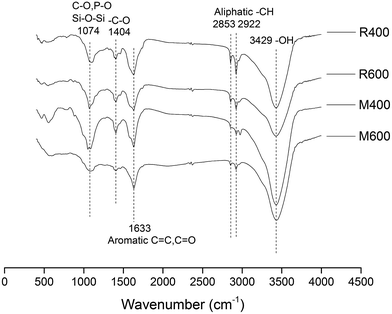
The FTIR fingerprints are shown in Fig. 1. The absorption between 3200 and 3500 cm−1 corresponded to the stretching vibrations of –OH,25 while the peaks at 2922 and 2853 cm−1 indicated an aliphatic –CH stretching vibration.17 A loss of intensity in these peaks was observed in M600 and R600 compared to M400 and R400, respectively, suggesting that O-containing hydroxyl and aliphatic carbon functional groups were transformed at the increased pyrolysis temperature. At the same time, the feedstock influenced the functional groups of the biochar. The swine manure biochar contained more –OH, but less aliphatic –CH than the rice straw biochar at each pyrolysis temperature. The peak intensities at 1633 cm−1 decreased as pyrolysis temperature increased and were designated as C![[double bond, length as m-dash]](https://www.rsc.org/images/entities/char_e001.gif) O and C
O and C![[double bond, length as m-dash]](https://www.rsc.org/images/entities/char_e001.gif) C stretching.28 The bands around 1000 to 1100 cm−1 were associated with Si–O–Si groups, the P–O bond of phosphate and the C–O bond of carbonate.29
C stretching.28 The bands around 1000 to 1100 cm−1 were associated with Si–O–Si groups, the P–O bond of phosphate and the C–O bond of carbonate.29
3.2 Adsorption kinetics
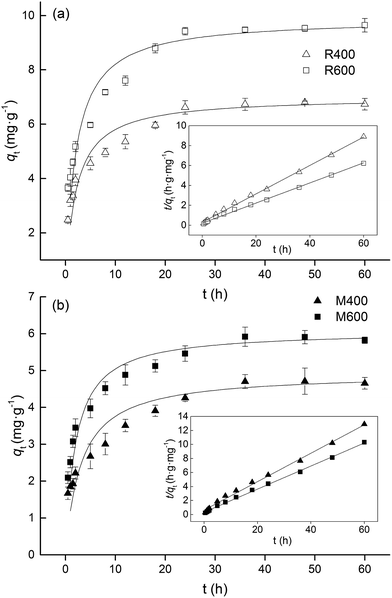
The adsorption kinetics of tetracycline on biochar are shown in Fig. 2. The shapes of the kinetics curves exhibited three stages in the adsorption process, a fast initial adsorption, a slow adsorption and a stable stage. In the fast adsorption process, about 70% of the adsorption capacity occurred within the first 8 h. A possible reason is that the high concentration of tetracycline at the interface between the biochar and the solution facilitates a great mass transfer driving force12 which causes tetracycline to rapidly occupy the adsorption sites of the biochar surface. For rice straw biochar, no significant change was found in qt from 24 h to 60 h (Tukey test, p > 0.05), indicating that adsorption equilibrium was reached after 24 h. Jia et al.16 showed that the adsorption equilibrium time of oxytetracycline was 24 h, which is consistent with the result of our study. However, adsorption equilibrium was reached after 36 h for swine manure biochar.Pseudo-first-order and pseudo-second-order models were used to analyze the experimental data. The adsorption kinetics parameters are shown in Table 2. The experimental data fitted well with the pseudo-second-order kinetics model (R2 > 0.99) (Fig. 2, Table 2), which indicated that the adsorption of tetracycline by all biochar involved chemical adsorption processes.16 This is in line with the results of many other studies.17,30,31 At the same time, the values of qe calculated based on the pseudo-second-order model were similar to the experimental values. The values of qe of the rice straw biochar were higher than those of the swine manure biochar, and increased with increasing pyrolysis temperature.
| Biochar | Pseudo-first-order | Pseudo-second-order | ||||
|---|---|---|---|---|---|---|
| k1 (h−1) | qe (mg g−1) | R2 | k2 (g mg−1 h−1) | qe (mg g−1) | R2 | |
| R400 | 0.081 | 3.266 | 0.877 | 0.069 | 7.001 | 0.998 |
| R600 | 0.069 | 4.441 | 0.847 | 0.049 | 9.898 | 0.998 |
| M400 | 0.110 | 3.507 | 0.789 | 0.065 | 4.930 | 0.995 |
| M600 | 0.092 | 3.485 | 0.959 | 0.080 | 6.077 | 0.998 |
An intra-particle diffusion model was applied to determine the diffusion mechanisms and identify the possible rate-limiting step of the adsorption process.32 As shown in Fig. 3, the plots of qt against t1/2 exhibited multi-linearity including three linear portions for both types of biochar (with the exception of M400), indicating that there were multiple steps in the adsorption process. Previous studies have shown that the tetracycline adsorption processes on biochar or activated carbon consisted of three stages, external diffusion or film diffusion, gradual adsorption and final equilibrium.33,34 In this study, the first stage of the plots with a relatively high slope was attributed to external diffusion, in which the tetracycline migrated from the bulk solution to the external surface of the biochar. The second stage presented a relatively high adsorption rate and indicated the gradual adsorption stage. In this stage, tetracycline underwent molecular diffusion from the external surface to the adsorption sites of the biochar, and was adsorbed at the active sites. The last stage was a final equilibrium stage in which the adsorption rate was equal to the desorption rate. This might be due to the decrease in available surface area of the biochar, the enhanced electrostatic repulsion between tetracycline molecules adsorbed on the surface of the biochar and those in the solution or the extremely low concentration of adsorbate remaining in the solution.
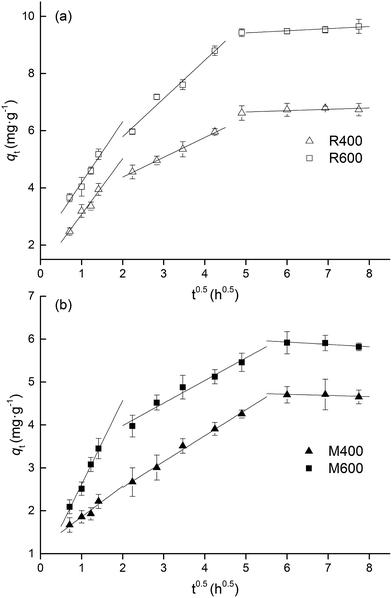 | ||
| Fig. 3 Intra-particle diffusion model for adsorption of tetracycline on (a) rice straw derived biochar and (b) swine manure derived biochar. Error bars indicate the SD. | ||
It has been reported that, if the fitted plots of the intra-particle diffusion model were linear and passed through the origin, the rate-limiting step of the adsorption processes is intra-particle diffusion.35 However, no linear fitted plots passed through the origin in this study, which is inconsistent with the results of previous studies.31,33,34 Intra-particle diffusion was not the exclusive rate determining step of the tetracycline adsorption processes on biochar.24 There might be other processes involved in adsorption, including initial external mass transfer or chemical reactions.36
3.3 The impact of pH
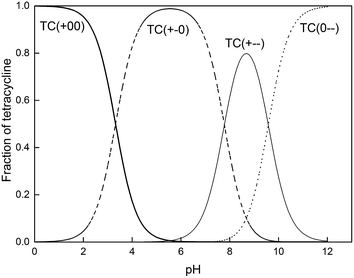
As shown in Fig. 4, the solution pH greatly affected the adsorption capacities of the biochar. As pH increased, adsorption capacity initially increased but then fell, with the maximum observed around pH 5.0. The pH of the solution changes the surface charges of tetracycline and biochar, and thus has an influence on the adsorption processes.16,17 As an amphoteric molecule, tetracycline has three values of pKa (3.32, 7.78, and 9.58) and presents four kinds of species under different pH conditions.37 The dominant one is cationic tetracycline (TC+00) with pH < 3.32, zwitterionic tetracycline (TC+−0) when the pH ranged from 3.32 to 7.78 and amination anionic tetracycline (TC+−−) or bivalent anionic tetracycline (TC0−−) with pH > 7.78 (Fig. 5). It has been reported that the isoelectric points of all the biochar in this study were between 3 and 4.25,38 When the pH was outside of the range of 3.32–7.78, electrostatic repulsion occurred because the charge on the biochar surface and the tetracycline molecules was the same. Thus, relatively higher adsorption capacities were observed when the solution pH was in a range of 3.5–8.0. In addition, the biochar surface was electron deficient because the biochar was positively charged when the pH was 2. There were relatively weak π–π EDA interactions between biochar and tetracycline, which resulted in decreased adsorption capacity.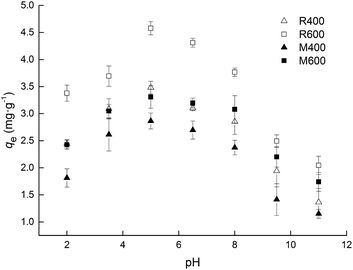 | ||
| Fig. 4 Effect of pH on adsorption capacity for tetracycline sorption on biochar. Error bars indicate the SD. | ||
To study the contribution of different tetracycline species to the adsorption process, the adsorption coefficient Kd (eqn (8)) and empirical model39 (eqn (9)) were employed in this study.
| Kd = qe/Ce | (8) |
| Kd = K+00d × f+00 + K+−0d × f+−0 + K+−−d × f+−− + K0−−d × f0−− | (9) |
The Kd values calculated based on eqn (8) are shown in Fig. S1 (ESI),† and exhibited similar trends to the adsorption capacities under different pH conditions. The Kd data showed a good fit to eqn (9) as the R2 coefficients were higher than 0.920 (Table 3). In general, the order of the respective adsorption coefficients of the four tetracycline species was as follows: K+−0d > K+00d > K+−−d > K0−−d. This indicates that the zwitterionic species has the highest adsorption affinity of all of the biochar. The contribution of each tetracycline species to the adsorption capacity was calculated by weighting the fraction with the corresponding adsorption coefficients (Fig. S2, ESI†). It was found that the zwitterionic tetracycline contributed more than 60% to the tetracycline adsorption when the pH ranged from 3.5 to 8.0, and even higher than 85% in the pH range of 5.0–6.5. For zwitterionic species, the electrostatic interaction may have limited influence on the adsorption. Zwitterionic species can easily interact with the negatively charged biochar surface because of the π–π EDA interactions. The negative tetracycline species also contributed more than 50% to the tetracycline adsorption on negatively charged biochar when the pH was above 8.0. This may be attributed to a negative charge assisted H bond (–(CAHB)) between the negative tetracycline species and surface carboxylate on the biochar.40
| Biochar | K+00d (L kg−1) | K+−0d (L kg−1) | K+−−d (L kg−1) | K0−−d (L kg−1) | radj2 |
|---|---|---|---|---|---|
| R400 | 285.64 | 568.37 | 236.95 | 110.25 | 0.971 |
| R600 | 435.49 | 1700.02 | 209.14 | 231.14 | 0.924 |
| M400 | 182.41 | 384.22 | 161.45 | 83.85 | 0.986 |
| M600 | 285.63 | 537.79 | 274.01 | 159.87 | 0.996 |
3.4 Adsorption isotherms
The adsorption equilibrium isotherms were evaluated using adsorption isotherm models such as the Freundlich, Langmuir and Tempkin models. As shown in Fig. 6, the experimental data were highly correlated with both the Freundlich and Langmuir models with coefficients (R2) higher than 0.966 (Table 4). However, the equilibrium data deviated from the Temkin model, with low correlation coefficients (R2) that ranged from 0.755 to 0.877. The values of n were Freundlich constants representing the adsorption intensity. The n values were less than 1, implying that the adsorption was a favorable and concentration-dependent process. The trend shown by the qmax values in the Langmuir model was an increase with pyrolysis temperature, which is consistent with the results of previous studies.15,31 At the same time, the values of qmax were higher in rice-straw biochar than swine manure biochar, which reflected the relatively high adsorption capacity of rice straw biochar. Based on the Langmuir model, the maximum adsorption capacities of biochar from rice straw and swine manure were 13.27 and 8.14 mg g−1 respectively.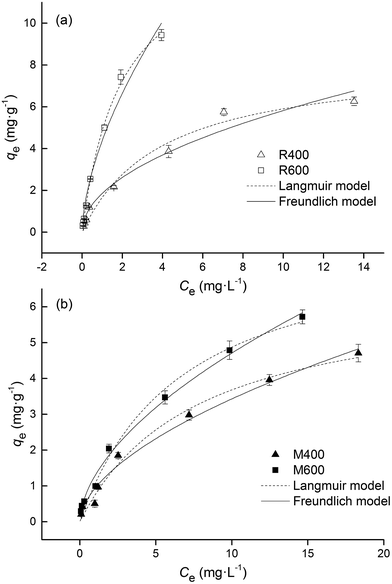 | ||
| Fig. 6 Adsorption isotherms for the adsorption of tetracycline on (a) rice straw derived biochar and (b) swine manure derived biochar. Error bars indicate the SD. | ||
| Biochar | Freundlich model | Langmuir model | Temkin model | ||||||
|---|---|---|---|---|---|---|---|---|---|
| Kf (mg1−n Ln g−1) | n | R2 | qmax (mg g−1) | KL (L mg−1) | R2 | KT (L g−1) | bT (×103) | R2 | |
| R400 | 1.857 | 0.496 | 0.966 | 8.246 | 0.252 | 0.977 | 9.445 | 2.081 | 0.877 |
| R600 | 4.376 | 0.602 | 0.976 | 14.185 | 0.521 | 0.997 | 15.806 | 1.234 | 0.854 |
| M400 | 0.936 | 0.564 | 0.984 | 6.513 | 0.130 | 0.985 | 5.886 | 2.952 | 0.837 |
| M600 | 1.288 | 0.563 | 0.994 | 8.125 | 0.150 | 0.988 | 8.619 | 2.519 | 0.755 |
The Freundlich model is an empirical model that represents multilayer adsorption on heterogeneous surfaces. The Langmuir model is an ideal model that is based on a perfect adsorbent surface and assumes a monomolecular layer adsorption. In this study, both the Freundlich and the Langmuir models fitted the adsorption data well, indicating the sorption of tetracycline on both types of biochar was affected by multiple mechanisms. Similar results were also found in other relevant studies.17,30
The adsorption of tetracycline from the solution onto the biochar involved physical and chemical adsorption processes. The biochar surface area is an important factor.17,41,42 In this study, the surface areas (SBET) of the biochar samples were significantly positively correlated with the qmax values in the Langmuir model (Table 5). The relatively higher adsorption capacity of rice straw biochar resulted from its relatively high surface area compared to swine manure biochar.
| Cb | N | O | H | O/C | H/C | (O + N)/C | SBETc | Vtot | Pore width | |
|---|---|---|---|---|---|---|---|---|---|---|
| a Correlation is significant at the 0.05 level (2-tailed).b The content of C, N, O and H elements in the biochar.c The SBET and Vtot represent the Brunauer–Emmett–Teller surface area and total pore volume respectively. | ||||||||||
| qmax | 0.752 | −0.867 | −0.042 | −0.405 | −0.768 | −0.847 | −0.871 | 0.975a | 0.806 | 0.102 |
Moreover, several adsorption mechanisms such as π–π EDA interactions, hydrogen bonding and electrostatic interactions (cation and anion attractions) may be involved in the adsorption of tetracycline onto various adsorbents. Electrostatic interactions (cation and anion attractions) is one of the main mechanisms controlling tetracycline adsorption onto soil.7 The Temkin model indicates chemical adsorption mediated by strong electrostatic interactions,43 but the adsorption data was poorly correlated with the Temkin model (Table 4) in this study. Therefore, it is unlikely that electrostatic interactions play a dominant role in tetracycline adsorption on biochar. Based on FTIR analysis, more O-containing functional groups which could serve as H-bond acceptors were detected on swine manure biochar and on biochar generated at a lower pyrolysis temperature. However, the adsorption capacities of the swine manure biochar were lower than those of the rice straw biochar. Therefore, the hydrogen bond interaction also might not be a dominant mechanism. π–π EDA interactions contribute to the adsorption on biochar.16,44 The conjugated enone structure of the tetracycline molecule acts as a π-electron-acceptor because of the strong electron-withdrawing ability of the ketone group.9 The graphite-like structure of biochar acts as a π-electron-donor.17
3.5 Thermodynamic analysis
To gain insight into the impact of temperature on the adsorption processes, eqn (10)–(12) were used to calculate three thermodynamic parameters including the standard Gibbs free energy (ΔG), enthalpy (ΔH) and entropy (ΔS):
ΔG = −RT![[thin space (1/6-em)]](https://www.rsc.org/images/entities/char_2009.gif) ln ln![[thin space (1/6-em)]](https://www.rsc.org/images/entities/char_2009.gif) Kd Kd
| (10) |
| ΔG = ΔH − TΔS | (11) |
ln![[thin space (1/6-em)]](https://www.rsc.org/images/entities/char_2009.gif) Kd = −ΔH/RT + ΔS/R Kd = −ΔH/RT + ΔS/R
| (12) |
Fig. S3 (ESI)† showed the relationship between ln![[thin space (1/6-em)]](https://www.rsc.org/images/entities/char_2009.gif) Kd and 1/T. The ΔG values were calculated from ln
Kd and 1/T. The ΔG values were calculated from ln![[thin space (1/6-em)]](https://www.rsc.org/images/entities/char_2009.gif) Kd. Negative ΔG values were found for all samples (Table 6), which implied, in agreement with previous studies,12,24 that the sorption of tetracycline on biochar was thermodynamically favorable and spontaneous. At the same time, the ΔG values increased with adsorption temperature, which implied that the adsorption process was less thermodynamically favorable at lower temperatures.
Kd. Negative ΔG values were found for all samples (Table 6), which implied, in agreement with previous studies,12,24 that the sorption of tetracycline on biochar was thermodynamically favorable and spontaneous. At the same time, the ΔG values increased with adsorption temperature, which implied that the adsorption process was less thermodynamically favorable at lower temperatures.
| Biochar | ΔH (kJ mol−1) | ΔS (J mol−1 K−1) | ΔG (kJ mol−1) | R2 | ||
|---|---|---|---|---|---|---|
| 15 °C | 25 °C | 35 °C | ||||
| R400 | 35.30 | 176.02 | −15.46 | −17.02 | −18.93 | 0.995 |
| R600 | 67.89 | 297.70 | −17.84 | −20.84 | −23.68 | 0.998 |
| M400 | 10.94 | 87.00 | −14.14 | −14.94 | −15.86 | 0.992 |
| M600 | 19.66 | 120.26 | −15.09 | −15.93 | −17.47 | 0.919 |
The values of ΔH for the biochar ranged from 10.94 to 67.89 kJ mol−1 (Table 6), which implied that the adsorption process was endothermic and more favorable at higher temperatures. At the same time, the values of ΔH for the rice straw biochar were higher than those for the swine manure biochar. The more energy the tetracycline molecules acquire, the larger the number of them that interact with the active sites on the surface of the biochar, which might result in the relatively high adsorption capacities of the rice straw biochar. The positive ΔS values revealed an increase in randomness at the biochar/tetracycline interface during the adsorption process, which suggested that the adsorption process favors sorption stability.45 The net positive entropy of tetracycline adsorption may be caused by the positive entropy change induced by the changes of biochar surface numerically exceeding the negative entropy change due to a loss of freedom of the tetracycline.46
3.6 Adsorption affinity
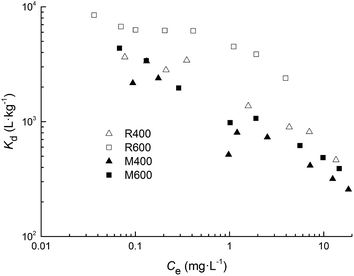
The Kd values for both types of biochar at experimental tetracycline concentrations are shown in Fig. 7. Larger Kd values were found for rice straw biochar at both pyrolysis temperatures and for biochar pyrolyzed at high temperature, which was consistent with the results calculated from the Langmuir model. Meanwhile, the adsorption coefficients tended to decrease with increasing tetracycline concentration. These findings indicated that the adsorption affinity between tetracycline and biochar was concentration dependent, and was higher at lower concentrations.Kd is a suitable index for comparing the adsorption capacity of different adsorbents to ensure a consistent comparison.47 In this study, the Kd values were in the order of 103 for R600, while they ranged from 102 to 103 for the other three types of biochar. When compared with previous studies, the Kd values of other carbon-based materials including SWNT, MWNT, AC and graphite surpassed 103 L kg−1, and reached 104–106 L kg−1 for SWNT.9 However, for various natural adsorbents, the Kd values were 102–103 L kg−1 for soils and clay minerals,48,49 which were lower than that of R600 and similar to that of the other three types of biochar investigated in this study. Previous studies showed that biochar could efficiently remove tetracycline from aqueous solutions.17,42 Wang et al.42 found that rice straw biochar pyrolyzed at 700 °C exhibited relatively high removal efficiencies (92.8–96.7%) at a range of initial tetracycline concentrations (0.5–32 mg L−1). In this study, we also found that R600 presented a relatively high adsorption affinity for tetracycline compared to the natural adsorbents, especially at low initial tetracycline concentrations. Therefore, R600 can be used as an attractive adsorbent to remove tetracycline from aqueous solutions because of its low cost.
4. Conclusions
The adsorption equilibrium of tetracycline on rice straw and swine manure biochar was reached after 24 h and 36 h, respectively. The solution pH had an influence on the adsorption processes. Relatively higher adsorption capacity could be observed and the zwitterionic tetracycline species contributed more than 60% to the tetracycline adsorption when the solution pH ranged from 3.5 to 7.5. The thermodynamic analysis showed that the tetracycline adsorption process was spontaneous and endothermic. The adsorption capacity was higher for biochar from rice straw than for that from swine manure, and increased with increasing pyrolysis temperature. The value of Kd also showed a similar trend. Overall, R600 can be used as an attractive adsorbent to remove tetracycline from aqueous solutions.Conflicts of interest
There are no conflicts of interest to declare.Acknowledgements
We are grateful to the Innovative Team Foundation of Zhejiang Province (No. 2013TD12), the Public Welfare Technology Application Research Project of Zhejiang Province (No. 2016C33102, No. 2016C33101, No. 2015C33301) and the Zhejiang Provincial Natural Science Foundation of China (No. LY16E080007).References
- Q.-Q. Zhang, G.-G. Ying, C.-G. Pan, Y.-S. Liu and J.-L. Zhao, Environ. Sci. Technol., 2015, 49, 6772–6782 CrossRef CAS PubMed.
- A. K. Sarmah, M. T. Meyer and A. B. Boxall, Chemosphere, 2006, 65, 725–759 CrossRef CAS PubMed.
- Y. Luo, L. Xu, M. Rysz, Y. Wang, H. Zhang and P. J. Alvarez, Environ. Sci. Technol., 2011, 45, 1827–1833 CrossRef CAS PubMed.
- X. Huang, C. Liu, K. Li, F. Liu, D. Liao, L. Liu, G. Zhu and J. Liao, Environ. Sci. Pollut. Res., 2013, 20, 9066–9074 CrossRef CAS PubMed.
- C. W. Knapp, J. Dolfing, P. A. Ehlert and D. W. Graham, Environ. Sci. Technol., 2009, 44, 580–587 CrossRef PubMed.
- M. Ahmad, A. U. Rajapaksha, J. E. Lim, M. Zhang, N. Bolan, D. Mohan, M. Vithanage, S. S. Lee and Y. S. Ok, Chemosphere, 2014, 99, 19–33 CrossRef CAS PubMed.
- S. A. Sassman and L. S. Lee, Environ. Sci. Technol., 2005, 39, 7452–7459 CrossRef CAS PubMed.
- H. Sayğılı and F. Güzel, Ecotoxicol. Environ. Saf., 2016, 131, 22–29 CrossRef PubMed.
- L. Ji, W. Chen, L. Duan and D. Zhu, Environ. Sci. Technol., 2009, 43, 2322–2327 CrossRef CAS PubMed.
- E. E. Ghadim, F. Manouchehri, G. Soleimani, H. Hosseini, S. Kimiagar and S. Nafisi, PLoS One, 2013, 8, e79254 Search PubMed.
- P. Liao, Z. Zhan, J. Dai, X. Wu, W. Zhang, K. Wang and S. Yuan, Chem. Eng. J., 2013, 228, 496–505 CrossRef CAS.
- Y. Chen, F. Wang, L. Duan, H. Yang and J. Gao, J. Mol. Liq., 2016, 222, 487–494 CrossRef CAS.
- B. Singh, B. P. Singh and A. L. Cowie, Soil Res., 2010, 48, 516–525 CrossRef CAS.
- X. Tan, Y. Liu, G. Zeng, X. Wang, X. Hu, Y. Gu and Z. Yang, Chemosphere, 2015, 125, 70–85 CrossRef CAS PubMed.
- G. Zhang, X. Liu, K. Sun, F. He, Y. Zhao and C. Lin, J. Environ. Qual., 2012, 41, 1906–1915 CrossRef CAS PubMed.
- M. Jia, F. Wang, Y. Bian, X. Jin, Y. Song, F. O. Kengara, R. Xu and X. Jiang, Bioresour. Technol., 2013, 136, 87–93 CrossRef CAS PubMed.
- P. Liu, W.-J. Liu, H. Jiang, J.-J. Chen, W.-W. Li and H.-Q. Yu, Bioresour. Technol., 2012, 121, 235–240 CrossRef CAS PubMed.
- L. Zhao, X. Cao, O. Mašek and A. Zimmerman, J. Hazard. Mater., 2013, 256, 1–9 Search PubMed.
- J. Wu, Y.-y. Hu, S.-f. Wang, Z.-p. Cao, H.-z. Li, X.-M. Fu, K.-j. Wang and J.-e. Zuo, Waste Manag., 2017, 62, 69–75 CrossRef CAS PubMed.
- Z. Lei, J. Chen, Z. Zhang and N. Sugiura, Bioresour. Technol., 2010, 101, 4343–4348 CrossRef CAS PubMed.
- Y.-G. Zhu, T. A. Johnson, J.-Q. Su, M. Qiao, G.-X. Guo, R. D. Stedtfeld, S. A. Hashsham and J. M. Tiedje, Proc. Natl. Acad. Sci. U. S. A., 2013, 110, 3435–3440 CrossRef CAS PubMed.
- L. Zhao, Y. H. Dong and H. Wang, Sci. Total Environ., 2010, 408, 1069–1075 CrossRef CAS PubMed.
- K. S. Ro, K. B. Cantrell and P. G. Hunt, Ind. Eng. Chem. Res., 2010, 49, 10125–10131 CrossRef CAS.
- Y. Chao, W. Zhu, B. Yan, Y. Lin, S. Xun, H. Ji, X. Wu, H. Li and C. Han, J. Appl. Polym. Sci., 2014, 131, 1–8 CrossRef.
- J. Meng, X. Feng, Z. Dai, X. Liu, J. Wu and J. Xu, Environ. Sci. Pollut. Res., 2014, 21, 7035–7046 CrossRef CAS PubMed.
- Y. Chun, G. Sheng, C. T. Chiou and B. Xing, Environ. Sci. Technol., 2004, 38, 4649–4655 CrossRef CAS PubMed.
- J. W. Lee, M. Kidder, B. R. Evans, S. Paik, A. Buchanan III, C. T. Garten and R. C. Brown, Environ. Sci. Technol., 2010, 44, 7970–7974 CrossRef CAS PubMed.
- M. Keiluweit, P. S. Nico, M. G. Johnson and M. Kleber, Environ. Sci. Technol., 2010, 44, 1247–1253 CrossRef CAS PubMed.
- Z. Dai, J. Meng, Q. Shi, B. Xu, Z. Lian, P. Brookes and J. M. Xu, Eur. J. Soil Sci., 2016, 67, 40–50 CrossRef CAS.
- X. Tan, S. Liu, Y. Liu, Y. Gu, G. Zeng, X. Cai, Z. Yan, C. Yang, X. Hu and B. Chen, Sci. Rep., 2016, 6, 39691 CrossRef CAS PubMed.
- B. Fu, C. Ge, L. Yue, J. Luo, D. Feng, H. Deng and H. Yu, BioResources, 2016, 11, 9017–9035 CAS.
- Q. Zhou, Z. Li, C. Shuang, A. Li, M. Zhang and M. Wang, Chem. Eng. J., 2012, 210, 350–356 CrossRef CAS.
- J. He, J. Dai, T. Zhang, J. Sun, A. Xie, S. Tian, Y. Yan and P. Huo, RSC Adv., 2016, 6, 28023–28033 RSC.
- X. Yang, G. Xu, H. Yu and Z. Zhang, Bioresour. Technol., 2016, 211, 566–573 CrossRef CAS PubMed.
- A. W. Ip, J. P. Barford and G. McKay, Chem. Eng. J., 2010, 157, 434–442 CrossRef CAS.
- M. J. Ahmed and S. K. Theydan, Chem. Eng. J., 2012, 211, 200–207 CrossRef.
- J. Rivera-Utrilla, C. V. Gómez-Pacheco, M. Sánchez-Polo, J. J. López-Peñalver and R. Ocampo-Pérez, J. Environ. Manage., 2013, 131, 16–24 CrossRef CAS PubMed.
- L. Qian and B. Chen, J. Agric. Food Chem., 2014, 62, 373–380 CrossRef CAS PubMed.
- B. Li and T. Zhang, Environ. Sci. Pollut. Res., 2013, 20, 3024–3033 CrossRef CAS PubMed.
- H. Zheng, Z. Y. Wang, J. Zhao, S. Herbert and B. S. Xing, Environ. Pollut., 2013, 181, 60–67 CrossRef CAS PubMed.
- X. Zhu, Y. Liu, C. Zhou, G. Luo, S. Zhang and J. Chen, Carbon, 2014, 77, 627–636 CrossRef CAS.
- H. Wang, Y. Chu, C. Fang, F. Huang, Y. Song and X. Xue, PLoS One, 2017, 12, e0182776 Search PubMed.
- X. Song, D. Liu, G. Zhang, M. Frigon, X. Meng and K. Li, Bioresour. Technol., 2014, 151, 428–431 CrossRef CAS PubMed.
- W. Chen, L. Duan and D. Zhu, Environ. Sci. Technol., 2007, 41, 8295–8300 CrossRef CAS PubMed.
- X. Zhu, Y. Liu, F. Qian, C. Zhou, S. Zhang and J. Chen, Bioresour. Technol., 2014, 154, 209–214 CrossRef CAS PubMed.
- X. Yuan, Z. Wu, H. Zhong, H. Wang, X. Chen, L. Leng, L. Jiang, Z. Xiao and G. Zeng, Environ. Sci. Pollut. Res., 2016, 23, 18657–18671 CrossRef CAS PubMed.
- M. B. Ahmed, J. L. Zhou, H. H. Ngo and W. Guo, Sci. Total Environ., 2015, 532, 112–126 CrossRef CAS PubMed.
- J. Tolls, Environ. Sci. Technol., 2001, 35, 3397–3406 CrossRef CAS PubMed.
- R. A. Figueroa, A. Leonard and A. A. MacKay, Environ. Sci. Technol., 2004, 38, 476–483 CrossRef CAS PubMed.
Footnote |
| † Electronic supplementary information (ESI) available. See DOI: 10.1039/c8ra01454j |
| This journal is © The Royal Society of Chemistry 2018 |

