
 Open Access Article
 This Open Access Article is licensed under a Creative Commons Attribution-Non Commercial 3.0 Unported Licence
Advances in mass spectrometry-based metabolomics for investigation of metabolites
Jun-Ling Rena,
Ai-Hua Zhanga,
Ling Konga and
Xi-Jun Wang *abc
*abc
aSino-America Chinmedomics Technology Collaboration Center, National TCM Key Laboratory of Serum Pharmacochemistry, Chinmedomics Research Center of State Administration of TCM, Laboratory of Metabolomics, Department of Pharmaceutical Analysis, Heilongjiang University of Chinese Medicine, Heping Road 24, Harbin, China. E-mail: xijunwangls@126.com
bState Key Laboratory of Quality Research in Chinese Medicine, Macau University of Science and Technology, Avenida Wai Long, Taipa, Macau
cNational Engineering Laboratory for the Development of Southwestern Endangered Medicinal Materials, Guangxi Botanical Garden of Medicinal Plant, Nanning, Guangxi, China
First published on 19th June 2018
Abstract
Metabolomics is the systematic study of all the metabolites present within a biological system, which consists of a mass of molecules, having a variety of physical and chemical properties and existing over an extensive dynamic range in biological samples. Diverse analytical techniques are needed to achieve higher coverage of metabolites. The application of mass spectrometry (MS) in metabolomics has increased exponentially since the discovery and development of electrospray ionization and matrix-assisted laser desorption ionization techniques. Significant advances have also occurred in separation-based MS techniques (gas chromatography-mass spectrometry, liquid chromatography-mass spectrometry, capillary electrophoresis-mass spectrometry, and ion mobility-mass spectrometry), as well as separation-free MS techniques (direct infusion-mass spectrometry, matrix-assisted laser desorption ionization-mass spectrometry, mass spectrometry imaging, and direct analysis in real time mass spectrometry) in the past decades. This review presents a brief overview of the recent advanced MS techniques and their latest applications in metabolomics. The software/websites for MS result analyses are also reviewed.
1 Introduction
Metabolomics is a booming omics field arising after genomics, transcriptomics, and proteomics, and it is a vital part of systems biology. Biological fluids (e.g., serum, plasma, urine, saliva, cerebrospinal fluid, bile, amniotic fluid, tears, pancreatic juice, intestinal fluid, and breast milk), human tissues, and cells are the common analysis objects in metabolomics. Metabolites are the end products of complex cellular regulation networks,1 and they can also influence or even alter regulation via feedback loops.2 Through the overall analysis of metabolites, the insightful knowledge of physiological, pathological, and biochemical status can be directly understood, which can then be combined with chemical and informatics methods. Further, endogenous small-molecule metabolic changes can also be determined, and the corresponding biomarkers can be obtained, which can be used to characterize or reveal the functional states for a particular time or environment.3 Thus, metabolomics may provide the “fingerprint” of metabolic systems that can reveal the clinical phenotype in the best possible manner.4 The studies of metabolomics can help us to enhance the understanding of disease mechanisms and drug effects, as well as improve the ability to predict personal disease progression or variation in drug response phenotypes.5–8Metabolomics refers to a large number of compounds that belong to multiple categories, such as amino acids, lipids, nucleotides, carbohydrates, and organic acids. The physical and chemical properties of metabolites are diverse and are often distributed over a wide range of concentrations.9 Consequently, metabolomics research is a challenge in analytical chemistry. The most common analytical techniques used in metabolomics are nuclear magnetic resonance spectroscopy and mass spectrometry (MS).10 Due to the evident superiorities of speed, sensitivity, and wide dynamic range over other techniques, MS has provided new dimensionality to medical research. The applications of MS are rapidly broadening, encompassing molecular and cellular biology. MS-based metabolomics technologies (Fig. 1) aid the analysis of in vivo metabolite changes, understanding of the possible pathogenesis and mechanism of diseases, and identification of potential biomarkers that may improve the diagnosis and treatment of diseases.11
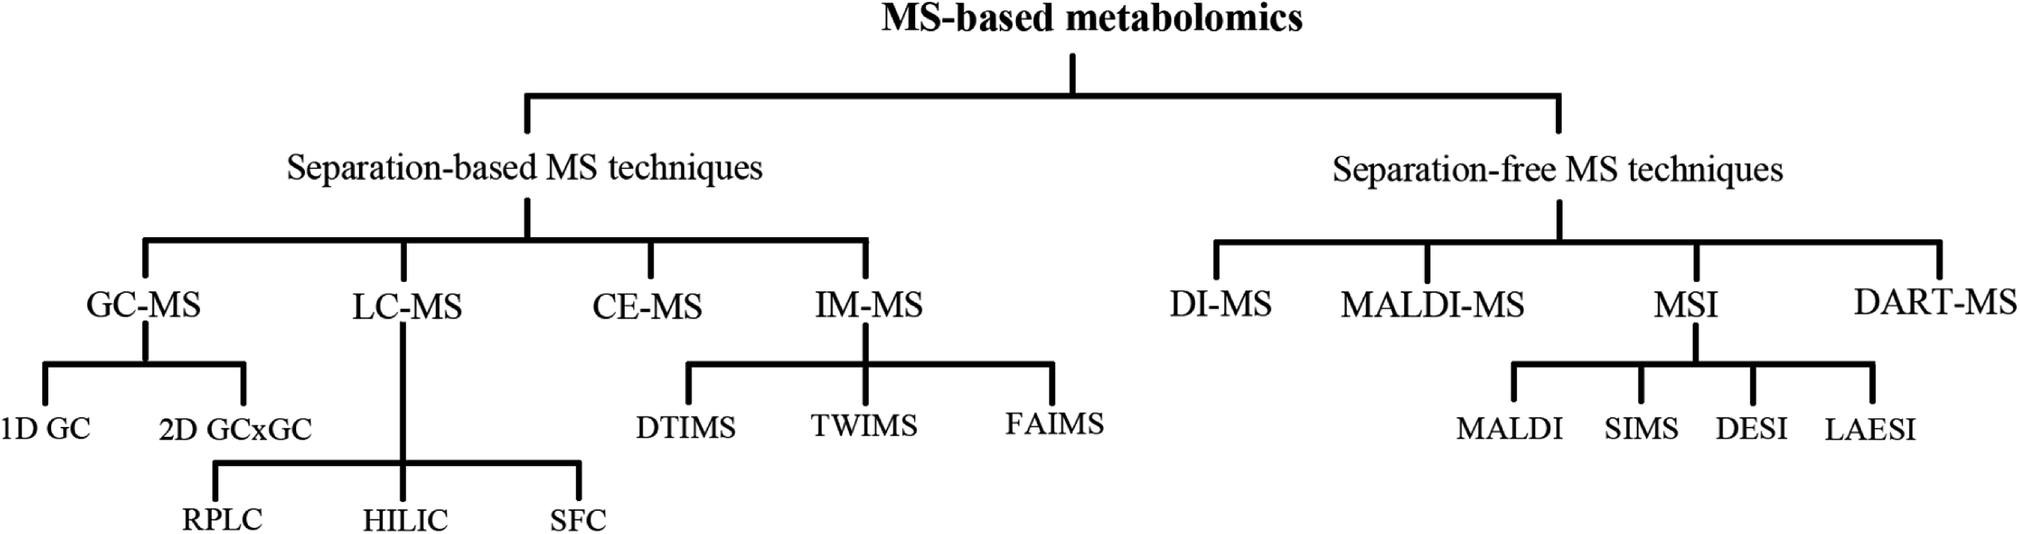 | ||
| Fig. 1 MS-based technologies currently used for metabolomics. CE: capillary electrophoresis; DART: direct analysis in real time; DESI: desorption electrospray ionization; DI: direct infusion; DTIMS: drift-time ion mobility-mass spectrometry; FAIMS: field asymmetric ion mobility-mass spectrometry; GC: gas chromatography; HILIC: hydrophilic interaction chromatography; IM-MS: ion mobility-mass spectrometry; LAESI: laser ablation electrospray ionization; LC: liquid chromatography; MALDI: matrix-assisted laser desorption ionization; MSI: mass spectrometry imaging; RPLC: reversed-phase liquid chromatography; SFC: supercritical fluid chromatography; SIMS: secondary ion mass spectrometry; TWIMS: traveling-wave ion mobility-mass spectrometry. | ||
The large-scale commercialization of two soft ionization techniques, electrospray ionization (ESI) and matrix-assisted laser desorption ionization (MALDI), has made MS the dominant analytical technique in metabolomics research, and has proven to be particularly helpful in large-scale omics studies.12,13 The development of an ESI source extends the applications of MS, as it offers a conventional method by generating gas-phase solute ions from the solution droplets by solution evaporation.14,15 MALDI is widely used primarily because of the rise of proteomics; in the last decade, MALDI has been extensively used in the detection and quantification of small molecular metabolites.16–18 Mass spectrometry imaging (MSI) opened a new chapter in the intuitive presentation of the metabolites distribution in tissues or cells. Herein, we categorically review the MS-based technologies employed in metabolomics and the corresponding analysis using software/website. Table 1 summarizes the advantages and disadvantages of these MS techniques in order to facilitate research applications.
| Advantages | Disadvantages | |
|---|---|---|
| GC-MS | Suitable for the detection of volatile metabolites | Unsuitable for non-volatile and thermally unstable metabolites |
| Highly repeated retention times | Sample pre-processing process is tedious and often requires derivatization | |
| Universal database facilitates the identification of the structure | ||
| LC-MS | Simple sample preparation | Ion suppression |
| Can be matched with multiple MS detectors | Metabolites can not be detected without form adduct ions | |
| Wide coverage of detectable metabolites | ||
| CE-MS | Low sample volume required for the detection, especially suitable for precious samples | System stability is less stable than LC-MS, GC-MS |
| Affected by salt in the sample | ||
| IM-MS | Isomers can be distinguished | Determination structural information indirectly from CCS values |
| Fast detection speed | ||
| The three-dimensional structure of metabolites can be determined in dynamic motion | ||
| DI-MS | High-throughput detection of samples | Ion suppression |
| The data processing process is relatively simple | Isomers cannot be distinguished | |
| MALDI-MS | Short sample analysis time | Reproducibility is greatly affected by the matrix and sample processing |
| Low sample consumption | Quantitative analysis is difficult to achieve | |
| High salt tolerance | ||
| MSI | Enables in situ detection and presentated in situ metabolites information | Imaging effect is affected by resolution |
| It takes longer time to complete the detection under the high resolution | ||
| DART-MS | Samples can be analyzed directly without the extraction process | Polar compounds are difficult to ionize |
| Low sample consumption | Ion suppression | |
| Sample analysis cycle was sharply shortened |
2 Separation-based MS techniques
2.1 Gas chromatography-mass spectrometry
Gas chromatography-mass spectrometry (GC-MS) is the preferred instrument for volatile metabolites analysis, which yields high sensitivity and resolution, prominent reproducibility, and highly repeatable fragmentation. The availability of a spectral library (such as NIST and AMDIS) makes the identification of biomarkers more convenient and helpful for the elucidation of subsequent mechanisms of biology or pathology alterations.19,20 Furthermore, although low cost and ease of operation are its merits, GC-MS usually requires tedious sample processing and derivatization when the analysis targets are nonvolatile constituents. To increase the volatility and thermal stability of the analytes, various derivatizations, such as alkylation, acylation, and silylation, can be employed to “protect” functional groups.1,9 Among these derivatization methods, methoximation and trimethylsilylation are commonly used in large-scale metabolomics studies with GC-MS.21 On account of the difference in the derivatization efficiencies of metabolites, the reproducibility of the overall analysis may be affected.9,22 It should also should be noted that the formation of byproducts and structural transformation in the derivatization process may lead to the misinterpretation of the generated data. The simple scheme of the GC-MS technique is illustrated in Fig. 2.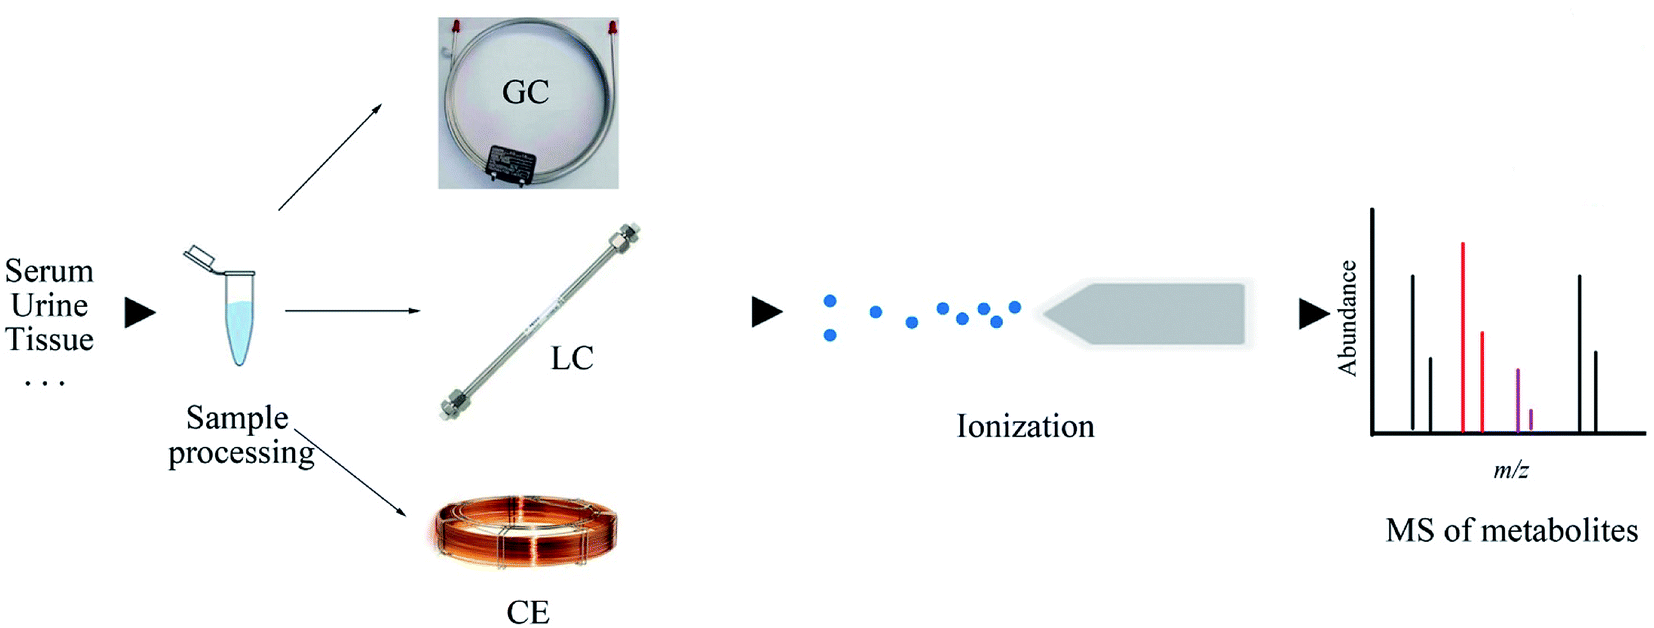 | ||
| Fig. 2 Flowchart depicting the basic workflow of GC-MS, LC-MS, and CE-MS techniques. | ||
Zhao et al. developed an automated high-throughput sample derivatization and quantitative method by using the GC-MS platform, and simultaneously measured over one hundred microbial metabolites in human serum, urine, feces, and Escherichia coli cell samples within 15 min for each sample.23 This established method is suitable for future microbiome metabolomics research that require good linearity, reproducibility, and stability. Hadi et al. profiled serum metabolites for the prediction of breast cancer diagnosis, grading, staging, and neoadjuvant status by GC-MS.24 The robust analytical approach highlights the potential of these metabolic features as prognostic factors, thus helping to improve the treatment of breast cancer. Yan et al. performed GC-MS to investigate urinary metabolic alterations related to systemic lupus erythematosus: 70 endogenous metabolites were identified that involved nucleotide metabolism, energy metabolism, oxidative stress, and gut-microbiome-derived metabolism.25 The present study manifested that GC-MS is a promising technique for metabolites analysis and understanding the pathology of diseases.
Since 1991, the use of comprehensive GC (GC × GC) has increased both peak capacity and sensitivity, which aid the identification of metabolites.26–28 In GC × GC, the compounds eluted from the primary column are imported into the secondary column to perform a second independent separation.29 Most of the reported applications of GC × GC are executed using the nonpolar stationary phase in the first dimension of separation and polar stationary phase in the second dimension. This choice is usually made as the elution behavior of the compound class is predictable, and these compounds are subjected to the first-dimension separation according to the different boiling points. Due to the similar boiling points, first-dimension separation fails to isolate the compounds. Therefore, these compounds were separated according to polarity in the second-dimension separation; consequently, the separation power was significantly enhanced.30 Miyazaki et al. examined the temporal changes of serum metabolites in neonatal calves after the first ingestion of colostrum by GC × GC-MS.31 Approximately 1400 calf serum metabolites were detected, the number of which was significantly higher than that of conventional GC-MS. About 180 metabolites were detected in the same serum sample, thus enhancing our understanding of serum metabolites.
2.2 Liquid chromatography-mass spectrometry
Liquid chromatography-mass spectrometry (LC-MS) has become the dominating analytical technique in the field of global metabolite profiling. As compared to GC-MS, the mobile phase changes from gas to liquid, eliminating the need for metabolites to be volatile. Thus, no sample derivatization is required, which indicates that a broader range of analytes can be detected. In 2004, the introduction of commercialized ultra-high-performance LC (UPLC) with sub-2 μm-particles drastically increased the throughput of regular LC methods.32 UPLC usually employs sub-2 μm or 2.6–2.8 μm (fused-core) stationary phase particles at the chromatography column and can withstand high solvent flow rates and high pressures in the range of 6000–19![[thin space (1/6-em)]](https://www.rsc.org/images/entities/char_2009.gif) 000 psi, which can reduce the peak width, yield shorter analytical run times, increase the peak capacity, provide better ionization, and reduce mass spectral overlap, leading to improved structural determination and confirmation.33,34 It is reported that the separation of human serum metabolites with UPLC-MS brings about the detection of 20% more metabolites when compared with those detected by HPLC-MS.35 Currently, UPLC-MS has become the mainstay in metabolites separation and identification. The simple scheme of the LC-MS technique is illustrated in Fig. 2.
000 psi, which can reduce the peak width, yield shorter analytical run times, increase the peak capacity, provide better ionization, and reduce mass spectral overlap, leading to improved structural determination and confirmation.33,34 It is reported that the separation of human serum metabolites with UPLC-MS brings about the detection of 20% more metabolites when compared with those detected by HPLC-MS.35 Currently, UPLC-MS has become the mainstay in metabolites separation and identification. The simple scheme of the LC-MS technique is illustrated in Fig. 2.
Wang et al. investigated a comprehensive metabolome of jaundice syndrome by RP-UPLC-MS, which established a specific metabolite phenotype and identified 44 potential biomarkers. The disturbance of alanine, aspartate, and glutamate metabolism, as well as the synthesis and degradation of ketone bodies were found in jaundice syndrome patients, which can yield a better understanding of the pathophysiology of the jaundice syndrome, and laid the foundation for the scientific interpretation of the pathology of traditional Chinese medicine syndrome.40 Based on the chinmedomics analysis method, Li et al. analyzed the global constituents of Phellodendri amurensis cortex and serum metabolites by RP-UPLC-MS.41 Herein, 34 different metabolites were found to be related with prostate cancer, and Phellodendri amurensis cortex can observably reverse the abovementioned biomarkers to the normal level, indicating its therapeutic effect. Zhang et al. profiled urine metabolites by RP-UPLC-MS to probe the phenotypic characteristics of nanshi oral liquid, altering the metabolic features of the Kidney-Yang deficiency syndrome.42 The established metabolomics platform characterized the metabolic pathways of the Kidney-Yang deficiency syndrome and evaluated the intervention effect of the nanshi oral liquid against this syndrome, which is conducive to further understanding the pathogenesis of traditional Chinese medicine syndrome, and supplied novel information for studying the pharmacology of traditional Chinese medicine.
However, highly polar and ionic compounds are difficult to retain in RPLC; the analysis of polar compounds is practicable using RPLC by adding ion-pairing agents into the mobile phase by means of ion-pairing liquid chromatography (IPLC).43 The ion-pair reagent is a compound that has an opposite charge when compared with the target metabolites in an aqueous solution.44 As for cation analysis, the ion-pair reagent usually includes hydrochloric acid, perchloric acid, perfluorocarboxylic acids, pentane sulfonic acids, hexane sulfonic acids, heptane sulfonic acids, and octane sulfonic acids, while for anion analysis, it usually includes tetramethylammonium, tetraethylammonium, tetrapropylammonium, tetrabutylammonium, tributylamine, and hexylamine.45 Guo et al. exploited the IP-RP-UHPLC-MS method to separate and analyze biochemical-related metabolites that contain phosphate and carboxylic acid in cellular metabolism.46 Diisopropylethylamine and hexafluoroisopropanol were used as the IP reagents, which enhanced the sensitivity and chromatographic separation, thus assisting in the precise analysis of metabolites in cell center energy metabolism and proving the in-depth knowledge of mechanisms related to metabolic adaptations. Though the usage of an ion-pair reagent is helpful, the remaining unpaired reagent may contaminate the ion source that may influence the sensitivity or reproducibility of LC-MS.44,47
It is well known that the simultaneous quantitative measurements of amino acids, neurotransmitters, purines, and pyrimidines exhibit immense difficulties. Chen et al. established a novel method based on HILIC-MS to target the quantification of the abovementioned metabolites in rat brain and serum, which displayed high selectivity, high throughput, and better chromatographic behavior than existing approaches.49 The results demonstrated that HILIC-MS can monitor a wide range of metabolites. Boelaert et al. developed a HILIC-MS-based metabolomics study in searching for novel potential biomarkers of chronic kidney disease.50 Herein, glycoursodeoxycholic acid, 2-hydroxyethane sulfonate, and pregnenolone sulfate were the newly identified metabolites in uremic retention solutes, which extends the range of metabolites of chronic kidney disease, opening a new perspective for future study. Cífková et al. systematically optimized the separation of acidic lipid classes and other lipid classes by HILIC-MS.51 It is a fairly tough task to separate acidic lipid classes due to the broadening or tailing of the chromatographic peaks by them. The established method obtained a higher number of lipids, providing a basis for the future detailed research on lipids.
Lísa et al. developed a novel analytical strategy for high throughput and comprehensive analysis of lipids by SFC-MS, which enables a quick separation of 30 classes of nonpolar and polar lipids within 6 min.57 Taguchi et al. established a rapid method to target profile bile acids in rat serum with SFC-MS.58 Twenty four bile acids were simultaneously quantified without any solid-phase extraction and complex sample preparation within 13 min. These applications confirm that SFC-MS is an alternative to existing analytical methods for metabolomics research.
2.3 Capillary electrophoresis-mass spectrometry
Electrophoresis is defined as the migration of ions under the influence of a spatially uniform electric field.59 Capillary electrophoresis (CE) requires the application of high voltage to produce an electrophoretic flow of different ionic species in a narrow-bore capillary (20–200 μm i.d.).60 CE-MS is a robust technique for polar and charged metabolite analyses, which is a complementary tool to the chromatographic separation technique.61 Capillary zone electrophoresis, the most common pattern of CE, when combined with MS, initially separates metabolites on the basis of their charge-to-size ratios and then on the basis of the mass-to-charge ratios, thus providing an alternative to LC.62,63 CE is considered to be a new technique among metabolomics and till date, it has not been routinely applied in metabolites profiling due to certain drawbacks, such as poor system stability and easy blockage of narrow capillaries by salt. While CE is a valuable analytical tool for those who have mastered the required skills and knowledge,64 it has some distinct advantages over other instrumental techniques employed for metabolomics: low separation volume, which is particularly suitable for the study of biological fluids in small experimental animals, homogeneous separation environment, easy sample preparation process, and capability of concentrating analytes.62 CE-MS exhibits semblable or even better separation efficiency than GC-MS and LC-MS due to the analysis time. The simple scheme of the CE-MS technique is illustrated in Fig. 2.Significant sensitivity enhancement of modern MS and optimized methods have transformed CE-MS into a potential tool for metabolomics analysis, and the application of CE-MS in metabolomics has drastically increased in the past decade.65 Onjiko et al. developed “microprobe single-cell CE-ESI-MS” for the in situ analysis of metabolites in single cells in a freely developing vertebrate embryo.66 Only <0.02% of the single cell content can allow the detection of ∼230 different molecules in the positive ion mode, which extends the biological toolbox of the system cell biology and opens a new direction toward understanding normal and impaired developments of cell biology.66 Zeng et al. employed CE-MS to profile metabolites in hepatocellular carcinoma patients, which is helpful to cover polar metabolites. Few studies have used CE-MS to evaluate serum polar metabolites in hepatocellular carcinoma, and this study may provide novel insights into the complicated biological processes in hepatocellular carcinoma.67 Fujii et al. applied CE-MS to detect metabolic changes in the postmortem brain of schizophrenia patients, and the results pointed out that glucose metabolism and proteolysis were altered, revealing that several pathways are changed in the brains of schizophrenia patients.68
2.4 Ion mobility-mass spectrometry
Ion mobility-mass spectrometry (IM-MS), a gas-phase electrophoretic technology, enables the differentiation of ions in the gas phase and electric field on the basis of their size, shape, charge, and mass, and can provide important supplementary information regarding molecular chromatographic separation and ion mass spectrometry separation.69–71 The advantages of IM-MS include distinguishing isobars and isomers, increased signal-to-noise ratio, and determining the conformational state caused by the charge location.72 The separation of IM-MS usually occurs in milliseconds, making it suitable for collaborating with MS, which adds a new dimension in the analysis. The scheme of IM-MS technique is displayed in Fig. 3.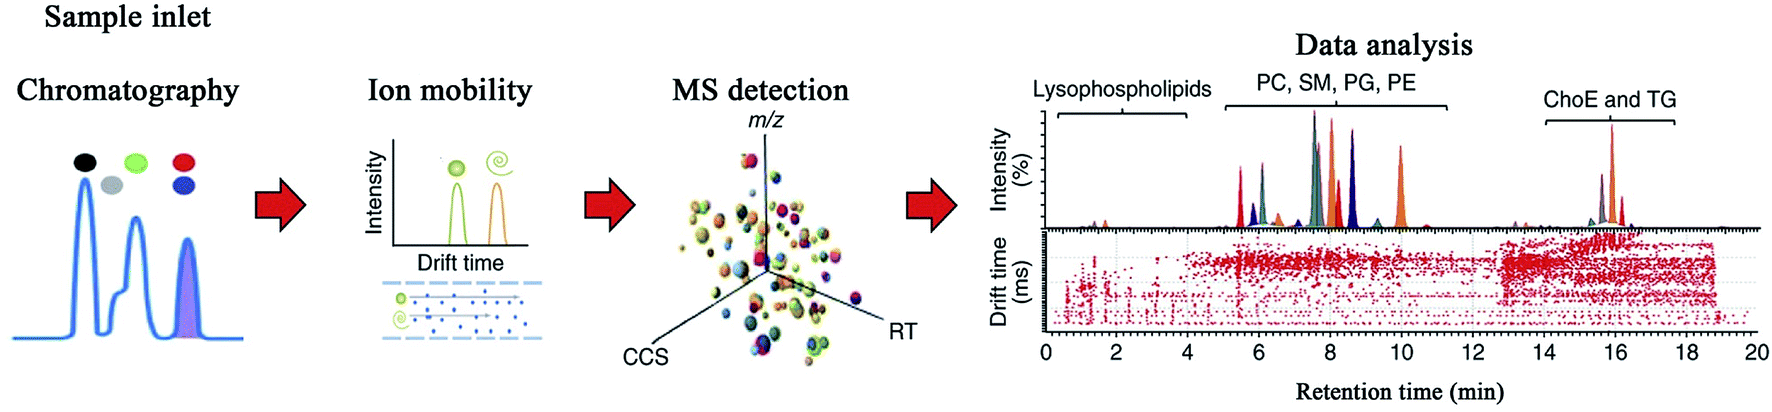 | ||
| Fig. 3 Scheme of IM-MS technique. Reprinted with permission from ref. 72. Copyright (2017) Nature. | ||
There are three major ion mobility spectrometry (IMS) techniques used in IM-MS: drift-time IMS (DTIMS), traveling-wave IMS (TWIMS), and field asymmetric IMS (FAIMS). DTIMS is the most straightforward method for measuring ion mobility. In the presence of an axial linear electric-field gradient, ions migrate through the buffer gas, thus demonstrating high resolution.73 However, DTIMS suffers from two deficiencies that limit its broad applications: low sensitivity and difficulty in coupling with commercial instruments.74 TWIMS is similar to DTIMS; however, in TWIMS, a sequence of applied voltages engenders a traveling wave that drives the ions through the buffer gas.13 This characteristic facilitates its coupling with the MS platform, greatly enhancing the sensitivity results.75 Since it is difficult to quantify traveling wave voltages, the measurement accuracy of the ion collision cross-section value (CCS: distinct physicochemical property of a compound, with which the compound's molecular structure can be predicted) is the primary disadvantage of TWIMS.76 It is possible for TWIMS to determine CCS accurately, which can be calibrated with the highly accurate CCS obtained from DTIMS.77–79 As the name suggests, FAIMS employs an asymmetric voltage waveform composed of a low- and high-field component to induce ions that can migrate between two fields when they are swept through the flow of gas. Only the stable ions in the applied waveform can pass through FAIMS, thus becoming capable of producing an effective narrow band-pass ion mobility filtering device. When compared with DTIMS and TWIMS, FAIMS operates with high sensitivity when the ions pass through it in a space-dispersive mode by varying the compensation voltage, making it suitable as a commercial technique for several MS instrument platforms.74,80
At present, numerous metabolomics studies using IM-MS have been published. Zhang et al. used ESI IM-MS to study the striatal metabolomics in Parkinson's-like disease for a rat model, and 9 metabolites were selected as potential biomarkers.81 A major discovery of this research was the finding of a dopamine isomer, which has not been reported previously, which was separated using IM-MS. This finding implied that the rangeability of dopamine in Parkinson's disease may be masked by the presence of its isomer. With the maturity of metabolomics, it is found that the function of isomers is not exactly the same, making isomer recognition particularly important. Bowman et al. explored FAIMS-MS to separate lipid isomers (the main differences including sn, chain length, double bond position, and cis/trans), and a success rate of approximately 75% was found in the four main types of glycerolipids and phospholipids.82 This study demonstrates FAIMS-MS as a powerful tool for lipid isomer analysis. Dwivedi et al. profiled human blood by IM-MS with about 1100 metabolites ions detected and 300 isomeric metabolites separated.83 Here, the peaks of low-abundance metabolites that may vanish in MS noise can be distinguished in the mobility space. Furthermore, the peak capacity of IM-MS is enhanced six-fold when compared with individual MS analysis. Thus, IM-MS seems to be a promising analytical technique for assessing metabolomics.
3 Separation-free MS techniques
3.1 Direct infusion-mass spectrometry
Direct infusion-mass spectrometry (DI-MS) is an analysis platform based on the direct injection or infusion of samples into MS, particularly ultra-high-resolution and accurate MS (such as Fourier transform ion cyclotron resonance-MS and Orbitrap-MS), without prior chromatographic or electrophoretic separation, which is clearly advantageous for high-throughput screening.3,84 This feature considerably shortens the total analysis time, thus minimizing the drift of sequence analysis, and improves the repeatability and accuracy among the intersamples.9,85 In addition, subsequent data processing is also simplified because it needs no alignment of the retention time.Anand et al. detected and confirmed serum lipid biomarkers for preeclampsia using DI-MS, which provides a high throughput method for the analysis of lipid species without a chromatographic separation step.86 It represents a versatile method that requires relatively simple sample preparation and sufficient reproducibility. González-Domínguez et al. analyzed regional metabolic abnormalities in the brains of transgenic APP/PS1 mice with DI-MS; when compared with wild-type control mice, the levels of phospholipids, fatty acids, acylcarnitines, purine and pyrimidine metabolites, sterols, and amino acids in transgenic APP/PS1 mice significantly changed, which is helpful to explore the possible pathogenesis of Alzheimer's disease.87
Although DI-MS can achieve rapid sample analysis, the ion source contamination of sample residue is tedious, and requires a long time to remove. The emergence of chip-based nano-ESI has excellently resolved this problem.88 The nozzle of chip-based nano-ESI is engraved on a silicon board, and the analyzed liquid is passed through the nozzle and sprayed under a relatively gentle pressure.89 Since the requirement of the sample volume is very small and each nozzle can be used only once, the sample residue effect is eliminated. It has been reported that this technique can reduce or even eliminate the differences in the MS response among analytes and adduct ions.90
Zhang et al. employed chip-based direct-infusion nano-electrospray Fourier transform ion cyclotron resonance-mass spectrometry to simultaneously quantify 6 free fatty acids in healthy controls, 5 types of cancer (colorectal, gastric, pancreatic, breast, and lung cancer) patients, and corresponding benign diseases. The results suggest that this platform could provide high sensitivity and high throughput analysis of free fatty acids, and serum unsaturated free fatty acids might have important clinical significance for the early detection of the abovementioned cancers.91–95
Although DI-MS is easy to perform, since it lacks chromatographic or electrophoretic separation capabilities, ion suppression becomes the main obstacle and isomeric compounds cannot be separated.
3.2 Matrix-assisted laser desorption ionization-mass spectrometry
MALDI, another powerful soft ionization source, has become an indispensable analytical tool for complex sample analyses.96–99 This technique provides distinguishing features such as rapid analysis ability, low sample consumption, and relatively high tolerance towards salts.100 The sample analysis time of MALDI-MS is mainly dependent on the amount of laser shots required for the experiment to be suitable for a high-throughput analysis (Fig. 4). In addition, 0.1–1 μL sample or the sample and matrix mixture is deposited on the target plate for MALDI-MS analysis, and only a small fraction of the spotted sample was consumed during the analysis. For LC-MS, usually, 2–20 μL sample volume is infused into the LC, which separates and concentrates the compounds prior to ionization.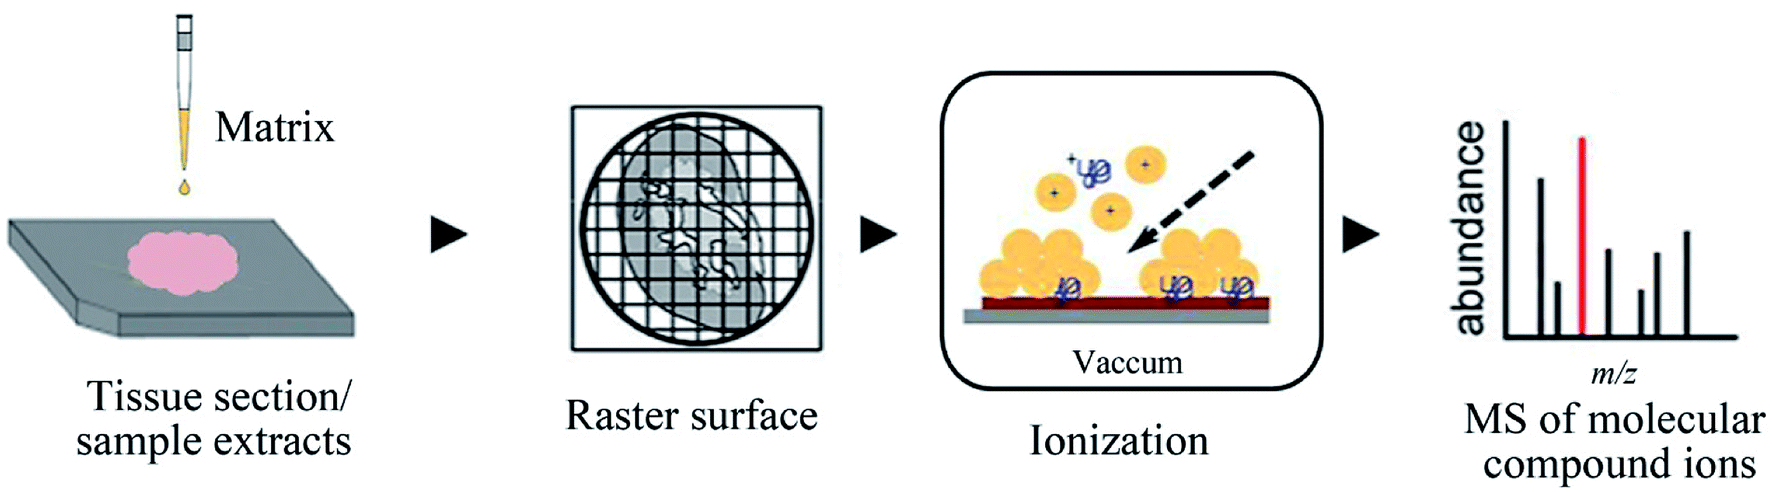 | ||
| Fig. 4 Flowchart depicting the basic workflow of MALDI-MS. Reprinted with permission from ref. 101. Copyright (2018) ACS Publications. | ||
Due to the poor reproducibility of the signal intensities of the analytes, the quantitative analysis of MALDI-MS is not very outstanding; also, the reproducibility of the signal intensities is largely determined by the type of matrices used and sample preparation.102,103 The most commonly used MALDI matrices are α-cyano-4-hydroxycinnamic acid (CHCA) and 2,5-dihydroxybenzoic acid (DHB). The selection of the matrix is also an important aspect that affects the experimental results. MALDI is an essential tool for analyzing macromolecule metabolites, such as proteins, peptides, and nucleic acids. With the discovery of various novel matrices, MALDI can also be used for the analysis of small molecule metabolites in the low mass region. Nanomaterials, such as carbon nanotubes,104 carbon dots,105 graphene,106 and graphene oxide,107 have been extensively developed as effective matrices for the MALDI profiling of smaller molecules.
He et al. adopted MALDI-MS for the in situ determination of the membrane constituents of human mammary epithelial cells and 6 breast cancer cell lines without any extraction and separation steps, thus providing a new rapid method for analyzing membrane lipids.108 Zhang et al. employed an ammonia-treated N-(1-naphthyl)ethylenediamine dihydrochloride (NEDC) as a new matrix for the rapid quantitative and qualitative determination of serum free fatty acids by MALDI-MS. Here, 9 free fatty acids were quantified in 339 serum samples, including healthy controls and non-hyperglycemia and hyperglycemia patients.109 This study indicated that MALDI-MS is not only suitable for metabolomics analysis, but can also quantitatively analyze the contents of metabolites. Ren et al. used graphene oxide as the matrix to rapidly and simultaneously quantify serum non-esterified and esterified fatty acids in 1440 subjects by MALDI-MS.18 Further, 12 non-esterified and esterified fatty acids were quantified within an analysis time of less than 1 min, and the potential biomarker panels presented good diagnostic ability to distinguish benign lung diseases from lung cancer with respect to the clinical uses of carcinoembryonic antigen or cytokeratin 19 fragment antigen 21-1.
3.3 Mass spectrometry imaging
MSI is a powerful tool for determining metabolites in situ, which can simultaneously map multiple molecules, from low-molecular-weight metabolites and drugs to large proteins while simultaneously maintaining the morphological integrity of the analyzed tissue slides.12,17,110 Typically, the spatial information of the biological processes in the tissue was obtained from histology staining, or immunohistochemistry. However, histology staining is non-molecular-specific, and immunohistochemistry requires the knowledge of the target analyte prior to investigation and limited to the simultaneous investigation of only a small number of analytes at any given time.111 Currently, MSI is an emerging technology that can enhance the understanding of the in situ distribution of metabolites or biomarkers directly in tissue sections or cells.The general workflow of MSI can be briefly summarized as follows: the tissue is cut into thin slices, usually 10–20 μm, and placed on an indium tin oxide-coated slide; then, according to the analysis' requirements, it is selected to either wash the tissue or not and spray an appropriate matrix or not on the basis of the selected ion source; and then, the analysis is performed.112–114 Tissue section is detected according to a predefined raster, which generates mass spectrum at each measurement point; then, the measured information is used to perform image reconstruction, yielding the distribution of molecules in the tissue.115
A variety of ionization methods have been employed for MSI, such as MALDI,17 secondary ion mass spectrometry (SIMS),116,117 desorption electrospray ionization (DESI),118–120 and laser ablation electrospray ionization (LAESI).121,122
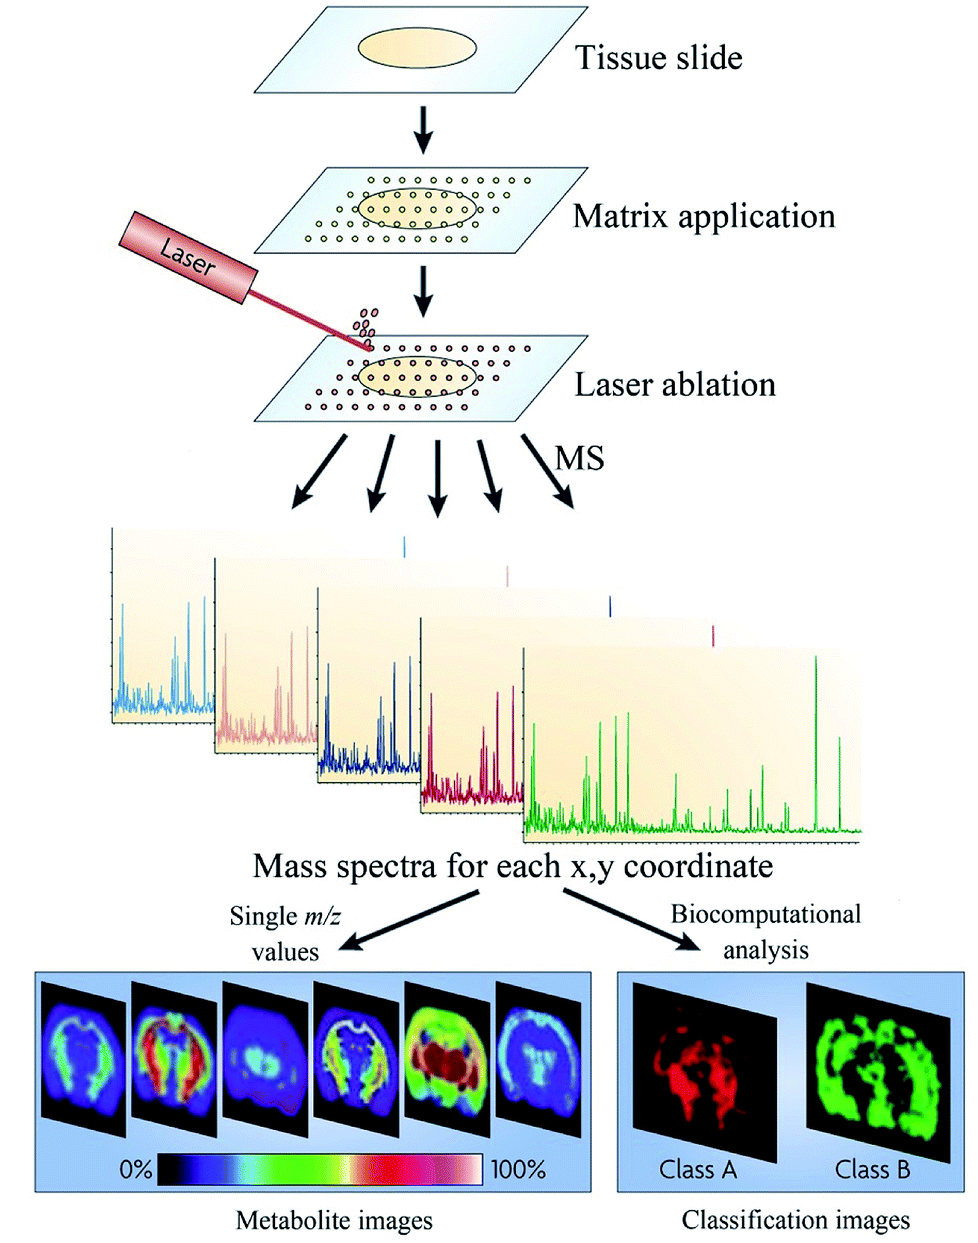 | ||
| Fig. 5 Flowchart depicting the basic workflow of MALDI MSI. Reprinted with permission from ref. 125. Copyright (2010) Nature. | ||
Guo et al. investigated 134 tissue samples from 6 types of cancer patients by MALDI MSI.17 The analysis of such a large sample size revealed that monosaturated lipids were significantly increased relative to polyunsaturated lipids and the associated enzymes were overexpressed in the tumor microenvironment, which also indicated that the MALDI MSI platform is a powerful tool to study metabolomics and cancer mechanisms. Zhou et al. employed graphene oxide as a matrix to image small molecules in the tissue; here, in the negative ion mode, 212 small molecules were detected and spatially visualized in mouse brain tissues, which reiterated the robust characteristics of MALDI MSI.131
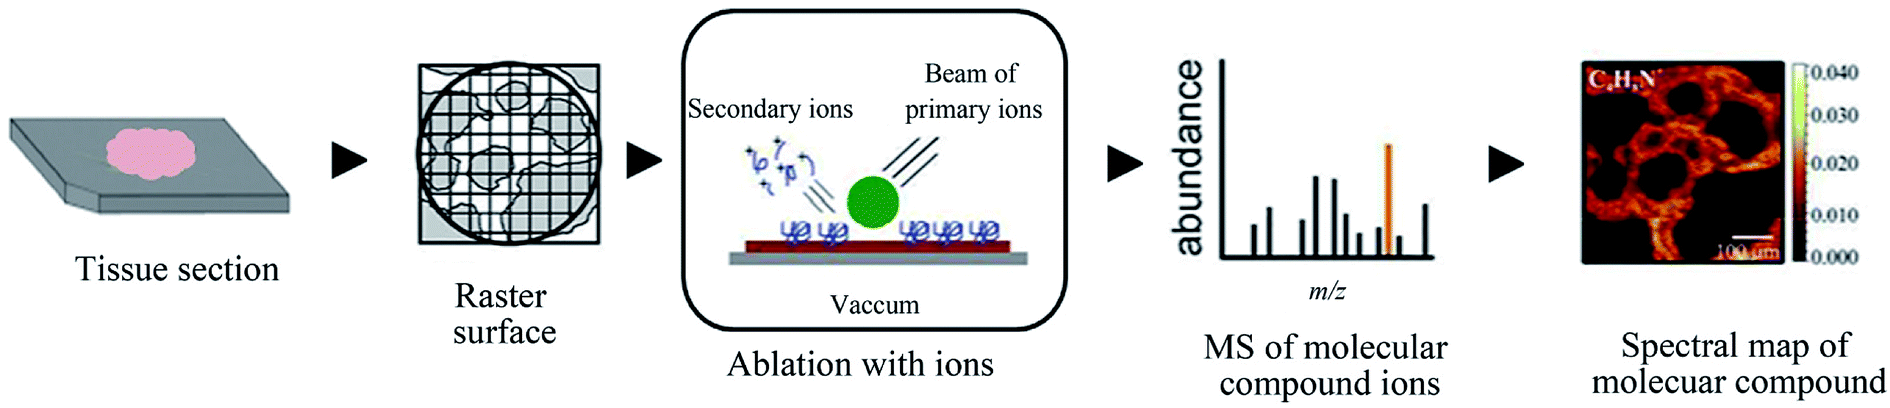 | ||
| Fig. 6 Flowchart depicting the basic workflow of SIMS MSI. Reprinted with permission from ref. 101. Copyright (2018) ACS Publications. | ||
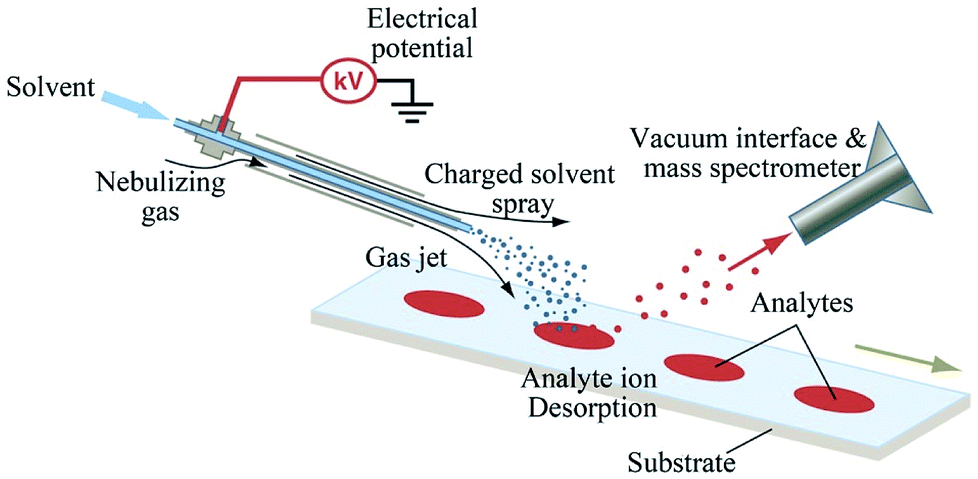 | ||
| Fig. 7 Scheme of DESI MSI technique. Reprinted with permission from ref. 136. Copyright (2006) Science. | ||
Jarmusch et al. examined human brain tumors by DESI MSI. A cluster of lower abundance signals were observed, which aided in differentiating brain parenchyma and gliomas.139 This operation can also be performed using tissue smears during intraoperative analyses, which may provide surgeons with near-real-time pathological information and guide the intraoperative resection of tumors whose perimeters are difficult to detect. Lanekoff et al. performed in situ imaging by nano-DESI MSI, obtained efficient separation, and identified difficult-to-isolate isomeric phospholipids in the full scan mode.140 This novel feature opens up exciting opportunities for metabolomics.
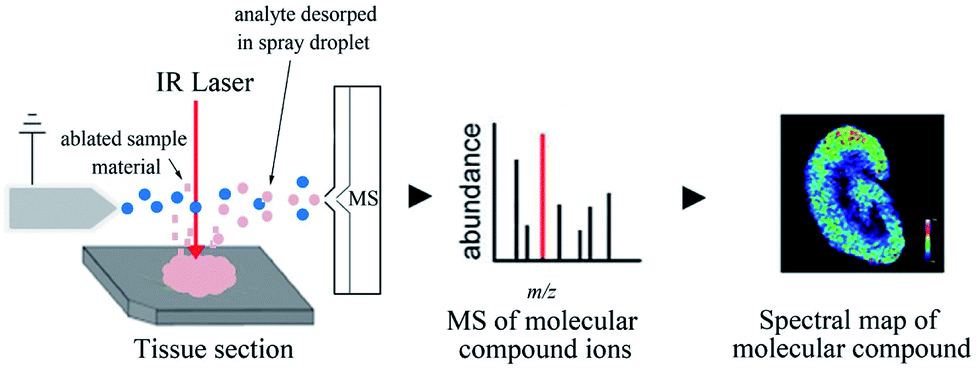 | ||
| Fig. 8 Flowchart depicting the basic workflow of LAESI MSI. Reprinted with permission from ref. 101. Copyright (2018) ACS Publications. | ||
Nowadays, MSI has evolved from a simple detection technique for different molecules present on various tissue surfaces or cells to a complex, in-depth imaging technique, revealing a mature analytical technology.
3.4 Direct analysis in real time-mass spectrometry
Direct analysis in real time (DART) is another versatile, new ambient ionization technology demonstrated by Cody et al. in 2005, which enables the rapid analyzing of solids, liquids, and gases at atmospheric pressure without sample preparation.146 Helium is conducted via an axial tube and supports a corona discharge that engenders ions, electrons, and excited atoms. Then, helium passes through the other two chambers, where the electrons, cations, and anions are removed, passing into the atmospheric reaction zone that include only electronically excited neutral substances (Fig. 9).147,148 These released atoms in the atmosphere will cause the environmental gas (e.g., atmospheric water or solvent) to undergo gas-phase reaction ionization cascade. Further, these ions serve as chemical ionizing reagents near the surface of the analyzed sample, resulting in analyte ions finally getting transferred to the mass analyzer.147,149 Penning ionization is the most important step in DART ionization, and the flow rate of carrier gas and temperature are the two major factors that affect the DART ionization performance.10 The prominent features of DART include high throughput, minor cross-contamination, and simplicity. In fact, DART is typically used to analyze small molecular compounds with m/z of 50–1200.150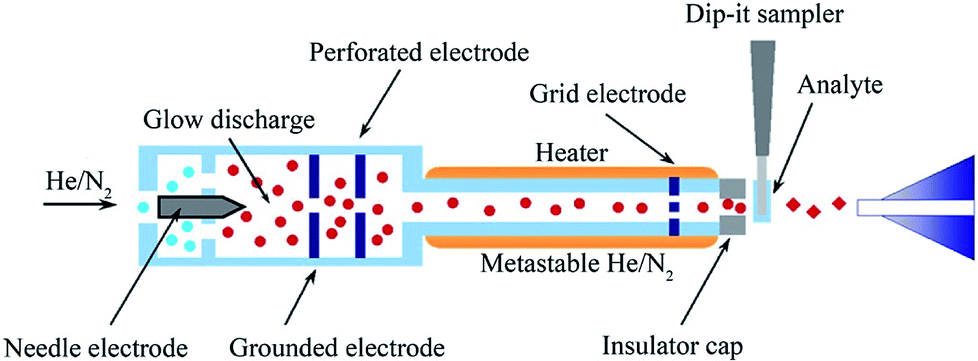 | ||
| Fig. 9 Scheme of DART MSI technique. Reprinted with permission from ref. 149. Copyright (2011) Elsevier. | ||
From the very beginning, DART was utilized in plant component analysis, vegetable pesticide residue monitoring, forensics, and now gradually used in metabolomics research. Cajka et al. employed DART-MS, where the flow rate of carrier gas and temperature were optimized, as a rapid tool to evaluate the response of dietary supplementation in fish metabolomics.151 Distinguishing carp muscles according to dietary supplementation was practicable when using DART-MS, which represents a powerful analytical technique in metabolomics-based aquaculture research. Zhou et al. reported metabolomics fingerprinting research of human serum by DART-MS.152 In this approach, volatile metabolites were derivatized from protein precipitate, followed by DART-MS analysis. The detection of each sample required only 1.2 min, during which more than 1500 different spectral characteristics were observed. This shows that DART-MS is an invaluable tool for metabolomic fingerprinting. Exploring the changes in human metabolism with DART-MS may provide a better outlook on the amount of biological information.
4 Tools for MS result analysis
There are various open access and commercial software/websites available for MS data processing and analysis (Table 2). These software/websites involve peak alignment, peak extraction, metabolites identification, and metabolic pathway analysis by searching metabolomics databases. The commonly used metabolomics databases include KEGG, HMDB, Metlin, and Massbank. However, there is no currently available standardized software/website for MS data processing and analysis. Using different software, the results will be very different,153–155 which shows that data processing and analysis software/websites have a great influence on data processing. Data processing is a vital part of metabolomics research and each software/website has its own characteristics. Researchers should choose the software/website to process and analyze data according to their own needs. It is believed that with the development of metabolomics methodologies and databases, data processing and analysis software/websites can be continuously enriched and perfected.| Software/website | Accepted data forms | Statistics | Pathway analysis | Data visualization | Source |
|---|---|---|---|---|---|
| MarkerLynx | .raw | ✓ | ✓ | Waters | |
| MarkerView | .d | ✓ | ✓ | AB Sciex | |
| MassHunter | all | ✓ | ✓ | Aglient | |
| Mass Profiler | all | ✓ | ✓ | ✓ | Aglient |
| MetQuest | .raw | ✓ | ✓ | Thermo | |
| SIEVE | .raw | ✓ | ✓ | Thermo | |
| IDEOM | all | ✓ | ✓ | https://mzmatch.sourceforge.net/ideom.html | |
| MathDAMP | all | ✓ | ✓ | https://mathdamp.iab.keio.ac.jp/ | |
| MAVEN | all | ✓ | ✓ | ✓ | https://maven.princeton.edu |
| MetAlign | all | ✓ | ✓ | https://www.metalign.nl | |
| MetboAnalyst | all | ✓ | ✓ | ✓ | https://www.metaboanalyst.ca/ |
| MET-COFEA | all | ✓ | ✓ | https://bioinfo.noble.org/manuscript-support/metcofea/ | |
| MET-XAlign | all | ✓ | ✓ | https://bioinfo.noble.org/manuscript-support/metxalign | |
| MS-DIAL | all | ✓ | ✓ | https://prime.psc.riken.jp/Metbolomics_Software/MS-DIAL | |
| MsXelerator | all | ✓ | ✓ | https://www.msmetrix.com/ | |
| MZmine | all | ✓ | ✓ | https://mzmine.sourceforge.net/ | |
| msCompare | all | ✓ | https://trac.nbic.nl/mscompare | ||
| OpenMS | all | ✓ | ✓ | https://www.openms.de/ | |
| SMART | all | ✓ | ✓ | https://www.stat.sinica.edu.tw/hsinchou/metabolomics/SMART.htm | |
| XCMS | all | ✓ | ✓ | https://xcmsonline.scripps.edu/ |
5 Limitations and challenges
MS-based metabolomics technology plays an important role in metabolites profiling due to its high sensitivity, high speed, and high throughput. However, some problems are constantly present in the continuous exploration of this field. First, since the concentration of metabolites in organisms varies greatly and some metabolites with lower concentrations may have important regulatory effects, the detection of trace-level metabolites presents a challenge for MS-based metabolomics. Therefore, the combined use of multiple separation, extraction methods, and MS detectors is imperative. Second, with the continuous improvement of sample processing methods, chromatographic separation capabilities, and MS sensitivity, massive amounts of data can be obtained. Thus, data processing will become another challenge for metabolomics. Third, on account of the different forms of adduct ions, the large amount of data obtained after peak alignment, and the imperfection in the databases and standards, the identification of metabolites is considerably challenging. Fourth, accurate concentration data are roughly relevant to the experimental conditions and data collection methods, which are considered to be comparable among different groups. At present, most MS-based metabolomic studies are limited to the relative quantification of metabolites, which is also regarded as the Achilles heel of metabolomics.156 The constant enrichment of isotopic affinity tags and standards will be conducive to the quantification of metabolites. Last, with the upgrading of the MS instrument, the construction and popularization of the Metabolomics Standards Initiative should be accelerated to achieve data sharing, effective use, and verification of experimental results.157–1606 Conclusion and future perspective
As a part of systems biology, metabolomics has received extensive attention in the field of life sciences, which represents the final omics level, supplying “functional” information among the omics studies.161–169 The latest advances in novel MS techniques have greatly improved the progression of metabolomics over the past decade (Fig. 10). The high selectivity, flexibility, and lower detection limits of MS along with its compatibility with various separation techniques and the capacity to provide qualitative and quantitative data makes MS an ideal instrument for metabolomics applications. At present, MS not only allows chemical information analysis of the extract content by LC-MS or DI-MS methods, but also can use imaging methods to analyze intact tissue or cells to provide spatial information for the location of given metabolites. In order to achieve better matching with clinical results, the sample processing, data analysis, method validation, and other details need to be standardized. In the future, it is necessary to continually develop new technologies to expand the coverage of metabolites and improve data quality. The measurement sensitivity, spatial resolution, and sample consumption should be improved constantly. Up to now, numerous published studies have demonstrated the promising potential of MS in metabolomics research. As another rapidly growing field of omics, it is expected that there will be more exciting new MS technologies applied in metabolomics in the near future.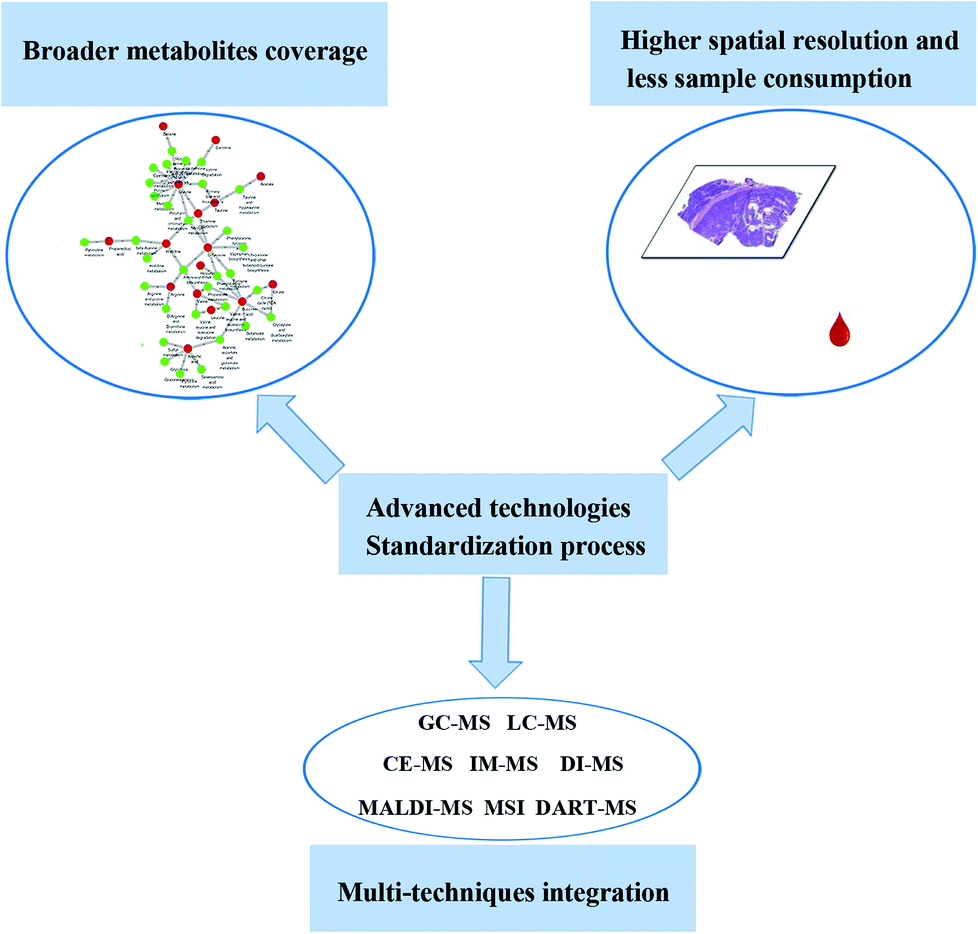 | ||
| Fig. 10 Trends in MS-based metabolomics. | ||
Conflicts of interest
The authors declare no competing financial interests.Acknowledgements
This study was supported by grants from the Key Program of Natural Science Foundation of State (Grant No. 81430093, 81373930, 81673586, 81302905), National Key Subject of Drug Innovation (Grant No. 2015ZX09101043-005, 2015ZX09101043-011), TCM State Administration Subject of Public Welfare of (Grant No. 2015468004), University Nursing Program for Young Scholars with Creative Talents in Heilongjiang Province (UNPYSCT-2015118).References
- O. Fiehn, Metabolomics – the link between genotypes and phenotypes, Plant Mol. Biol., 2002, 48(1–2), 155–171 CrossRef PubMed.
- N. M. Gruning, M. Rinnerthaler and K. Bluemlein, et al., Pyruvate kinase triggers a metabolic feedback loop that controls redox metabolism in respiring cells, Cell Metab., 2011, 14(3), 415–427 CrossRef PubMed.
- A. Zhang, H. Sun and X. Wang, Urinary metabolic profiling of rat models revealed protective function of scoparone against alcohol induced hepatotoxicity, Sci. Rep., 2014, 4, 6768 CrossRef PubMed.
- Y. Y. Zhao, J. Liu and X. L. Cheng, et al., Urinary metabonomics study on biochemical changes in an experimental model of chronic renal failure by adenine based on UPLC Q-TOF/MS, Clin. Chim. Acta, 2012, 413(5–6), 642–649 CrossRef PubMed.
- X. Li, A. Zhang and H. Sun, et al., Metabolic characterization and pathway analysis of berberine protects against prostate cancer, Oncotarget, 2017, 8, 65022–65041 Search PubMed.
- X. Wang, A. Zhang and H. Sun, Power of metabolomics in diagnosis and biomarker discovery of hepatocellular carcinoma, Hepatology, 2013, 57(5), 2072–2077 CrossRef PubMed.
- H. Sun, A. Zhang and G. Yan, et al., Metabolomic analysis of key regulatory metabolites in hepatitis C virus-infected tree shrews, Mol. Cell. Proteomics, 2013, 12(3), 710–719 CrossRef PubMed.
- X. Wang, A. Zhang and X. Zhou, et al., An integrated chinmedomics strategy for discovery of effective constituents from traditional herbal medicine, Sci. Rep., 2016, 6, 18997 CrossRef PubMed.
- A. Zhang, Q. Liu and H. Zhao, et al., Phenotypic characterization of nanshi oral liquid alters metabolic signatures during disease prevention, Sci. Rep., 2016, 6, 19333 CrossRef PubMed.
- W. B. Dunn, N. J. Bailey and H. E. Johnson, Measuring the metabolome: current analytical technologies, Analyst, 2005, 130(5), 606–625 RSC.
- H. Yang, W. B. Lau and B. Lau, et al., A mass spectrometric insight into the origins of benign gynecological disorders, Mass Spectrom. Rev., 2017, 36(3), 450–470 CrossRef PubMed.
- A. Zhang, G. Yan and H. Sun, et al., Deciphering the biological effects of acupuncture treatment modulating multiple metabolism pathways, Sci. Rep., 2016, 6, 19942 CrossRef PubMed.
- Q. Liu, A. Zhang and L. Wang, et al., High-throughput chinmedomics-based prediction of effective components and targets from herbal medicine AS1350, Sci. Rep., 2016, 6, 38437 CrossRef PubMed.
- A. Zhang, H. Sun and X. Wang, Mass spectrometry-driven drug discovery for development of herbal medicine, Mass Spectrom. Rev., 2018, 37(3), 307–320 CrossRef PubMed.
- S. Nguyen and J. B. Fenn, Gas-phase ions of solute species from charged droplets of solutions, Proc. Natl. Acad. Sci. U. S. A., 2007, 104(4), 1111–1117 CrossRef PubMed.
- J. J. Dalluge, Matrix-assisted laser desorption ionization-mass spectrometry (MALDI-MS), Anal. Bioanal. Chem., 2002, 372(1), 18–19 CrossRef PubMed.
- S. Guo, Y. Wang and D. Zhou, et al., Significantly increased monounsaturated lipids relative to polyunsaturated lipids in six types of cancer microenvironment are observed by mass spectrometry imaging, Sci. Rep., 2014, 4, 5959 CrossRef PubMed.
- J. Ren, D. Zhang and Y. Liu, et al., Simultaneous Quantification of Serum Nonesterified and Esterified Fatty Acids as Potential Biomarkers to Differentiate Benign Lung Diseases from Lung Cancer, Sci. Rep., 2016, 6, 34201 CrossRef PubMed.
- G. A. Theodoridis, H. G. Gika and E. J. Want, et al., Liquid chromatography-mass spectrometry based global metabolite profiling: a review, Anal. Chim. Acta, 2012, 711, 7–16 CrossRef PubMed.
- S. Dagan, Comparison of gas chromatography-pulsed flame photometric detection-mass spectrometry, automated mass spectral deconvolution and identification system and gas chromatography-tandem mass spectrometry as tools for trace level detection and identification, J. Chromatogr. A, 2000, 868(2), 229–247 CrossRef PubMed.
- W. B. Dunn, D. Broadhurst and P. Begley, et al., Procedures for large-scale metabolic profiling of serum and plasma using gas chromatography and liquid chromatography coupled to mass spectrometry, Nat. Protoc., 2011, 6(7), 1060–1083 CrossRef PubMed.
- H. Kanani, P. K. Chrysanthopoulos and M. I. Klapa, Standardizing GC-MS metabolomics, J. Chromatogr. B: Anal. Technol. Biomed. Life Sci., 2008, 871(2), 191–201 CrossRef PubMed.
- L. Zhao, Y. Ni and M. Su, et al., High Throughput and Quantitative Measurement of Microbial Metabolome by Gas Chromatography/Mass Spectrometry Using Automated Alkyl Chloroformate Derivatization, Anal. Chem., 2017, 89(10), 5565–5577 CrossRef PubMed.
- N. I. Hadi, Q. Jamal and A. Iqbal, et al., Serum Metabolomic Profiles for Breast Cancer Diagnosis, Grading and Staging by Gas Chromatography-Mass Spectrometry, Sci. Rep., 2017, 7(1), 1715 CrossRef PubMed.
- B. Yan, J. Huang and F. Dong, et al., Urinary metabolomic study of systemic lupus erythematosus based on gas chromatography/mass spectrometry, Biomed. Chromatogr., 2016, 30(11), 1877–1881 CrossRef PubMed.
- Y. F. Wong, C. Hartmann and P. J. Marriott, Multidimensional gas chromatography methods for bioanalytical research, Bioanalysis, 2014, 6(18), 2461–2479 CrossRef PubMed.
- S. T. Chin and P. J. Marriott, Multidimensional gas chromatography beyond simple volatiles separation, Chem. Commun., 2014, 50(64), 8819–8833 RSC.
- A. Mostafa, M. Edwards and T. Gorecki, Optimization aspects of comprehensive two-dimensional gas chromatography, J. Chromatogr. A, 2012, 1255, 38–55 CrossRef PubMed.
- H. J. Cortes, B. Winniford and J. Luong, et al., Comprehensive two dimensional gas chromatography review, J. Sep. Sci., 2009, 32(5–6), 883–904 CrossRef PubMed.
- D. Ryan, P. Morrison and P. Marriott, Orthogonality considerations in comprehensive two-dimensional gas chromatography, J. Chromatogr. A, 2005, 1071(1–2), 47–53 CrossRef PubMed.
- T. Miyazaki, K. Okada and T. Yamashita, et al., Two-dimensional gas chromatography time-of-flight mass spectrometry-based serum metabolic fingerprints of neonatal calves before and after first colostrum ingestion, J. Dairy Sci., 2017, 100(6), 4354–4364 CrossRef PubMed.
- X. Wang, B. Yang, H. Sun and A. Zhang, Pattern recognition approaches and computational systems tools for ultra performance liquid chromatography-mass spectrometry-based comprehensive metabolomic profiling and pathways analysis of biological data sets, Anal. Chem., 2012, 84(1), 428–439 CrossRef PubMed.
- Y. Zhang, P. Liu and Y. Li, et al., Exploration of metabolite signatures using high-throughput mass spectrometry coupled with multivariate data analysis, RSC Adv., 2017, 7(11), 6780–6787 RSC.
- A. Zhang, H. Sun and G. Yan, et al., Recent developments and emerging trends of mass spectrometry for herbal ingredients analysis, TrAC, Trends Anal. Chem., 2017, 94, 70–76 CrossRef.
- A. Nordstrom, G. O'Maille and C. Qin, et al., Nonlinear data alignment for UPLC-MS and HPLC-MS based metabolomics: quantitative analysis of endogenous and exogenous metabolites in human serum, Anal. Chem., 2006, 78(10), 3289–3295 CrossRef PubMed.
- X. Wang, J. Li and A. H. Zhang, Urine metabolic phenotypes analysis of extrahepatic cholangiocarcinoma disease using ultra-high performance liquid chromatography-mass spectrometry, RSC Adv., 2016, 6(67), 63049–63057 RSC.
- Q. Liang, H. Liu and H. Xing, et al., UPLC-QTOF/MS based metabolomics reveals metabolic alterations associated with severe sepsis, RSC Adv., 2016, 6, 43293–43298 RSC.
- E. J. Want, I. D. Wilson and H. Gika, et al., Global metabolic profiling procedures for urine using UPLC-MS, Nat. Protoc., 2010, 5(6), 1005–1018 CrossRef PubMed.
- Q. Liang, H. Liu and H. Xing, et al., Urinary UPLC-MS metabolomics dissecting the underlying mechanisms of huaxian capsule protects against sepsis, RSC Adv., 2016, 6, 40436–40441 RSC.
- X. Wang, A. Zhang and Y. Han, et al., Urine metabolomics analysis for biomarker discovery and detection of jaundice syndrome in patients with liver disease, Mol. Cell. Proteomics, 2012, 11(8), 370–380 CrossRef PubMed.
- X. N. Li, A. Zhang and M. Wang, et al., Screening the active compounds of Phellodendri amurensis cortex for treating prostate cancer by high-throughput chinmedomics, Sci. Rep., 2017, 7, 46234 CrossRef PubMed.
- Q. Liang, H. Liu and L. Xie, et al., High-throughput metabolomics enables biomarker discovery in prostate cancer, RSC Adv., 2017, 7(5), 2587–2593 RSC.
- W. Lu, B. D. Bennett and J. D. Rabinowitz, Analytical strategies for LC-MS-based targeted metabolomics, J. Chromatogr. B: Anal. Technol. Biomed. Life Sci., 2008, 871(2), 236–242 CrossRef PubMed.
- S. P. Putri, S. Yamamoto and H. Tsugawa, et al., Current metabolomics: technological advances, J. Biosci. Bioeng., 2013, 116(1), 9–16 CrossRef PubMed.
- T. W. Joachim Weiss, Handbook of Ion Chromatography, Wiley-VCH, Weinheim, 3rd edn, 2004 Search PubMed.
- L. Guo, A. J. Worth and C. Mesaros, et al., Diisopropylethylamine/hexafluoroisopropanol-mediated ion-pairing ultra-high-performance liquid chromatography/mass spectrometry for phosphate and carboxylate metabolite analysis: utility for studying cellular metabolism, Rapid Commun. Mass Spectrom., 2016, 30(16), 1835–1845 CrossRef PubMed.
- J. M. Buscher, D. Czernik and J. C. Ewald, et al., Cross-platform comparison of methods for quantitative metabolomics of primary metabolism, Anal. Chem., 2009, 81(6), 2135–2143 CrossRef PubMed.
- D. Q. Tang, L. Zou and X. X. Yin, et al., HILIC-MS for metabolomics: an attractive and complementary approach to RPLC-MS, Mass Spectrom. Rev., 2016, 35(5), 574–600 CrossRef PubMed.
- J. Chen, W. Hou and B. Han, et al., Target-based metabolomics for the quantitative measurement of 37 pathway metabolites in rat brain and serum using hydrophilic interaction ultra-high-performance liquid chromatography-tandem mass spectrometry, Anal. Bioanal. Chem., 2016, 408(10), 2527–2542 CrossRef PubMed.
- J. Boelaert, F. Lynen and G. Glorieux, et al., Metabolic profiling of human plasma and urine in chronic kidney disease by hydrophilic interaction liquid chromatography coupled with time-of-flight mass spectrometry: a pilot study, Anal. Bioanal. Chem., 2017, 409(8), 2201–2211 CrossRef PubMed.
- E. Cifkova, R. Hajek and M. Lisa, et al., Hydrophilic interaction liquid chromatography-mass spectrometry of (lyso)phosphatidic acids, (lyso)phosphatidylserines and other lipid classes, J. Chromatogr. A, 2016, 1439, 65–73 CrossRef PubMed.
- A. Matsubara, E. Fukusaki and T. Bamba, Metabolite analysis by supercritical fluid chromatography, Bioanalysis, 2010, 2(1), 27–34 CrossRef PubMed.
- Y. S. N. Ikushima, M. Arai and K. Arai, Solvent polarity parameters of supercritical carbondioxide as measured by infraredspectroscopy, Bull. Chem. Soc. Jpn., 1991, 64(7), 2224–2229 CrossRef.
- S. Fekete, A. Grand-Guillaume Perrenoud and D. Guillarme, Evolution and Current Trends in Liquid and Supercritical Fluid Chromatography, Curr. Chromatogr., 2014, 1, 15–40 CrossRef.
- J. D. Pinkston, D. Wen and K. L. Morand, et al., Comparison of LC/MS and SFC/MS for screening of a large and diverse library of pharmaceutically relevant compounds, Anal. Chem., 2006, 78(21), 7467–7472 CrossRef PubMed.
- K. Taguchi, E. Fukusaki and T. Bamba, Supercritical fluid chromatography/mass spectrometry in metabolite analysis, Bioanalysis, 2014, 6(12), 1679–1689 CrossRef PubMed.
- M. Lisa and M. Holcapek, High-Throughput and Comprehensive Lipidomic Analysis Using Ultrahigh-Performance Supercritical Fluid Chromatography-Mass Spectrometry, Anal. Chem., 2015, 87(14), 7187–7195 CrossRef PubMed.
- K. Taguchi, E. Fukusaki and T. Bamba, Simultaneous and rapid analysis of bile acids including conjugates by supercritical fluid chromatography coupled to tandem mass spectrometry, J. Chromatogr. A, 2013, 1299, 103–109 CrossRef PubMed.
- Y. Masuo, T. Imai and J. Shibato, et al., Omic analyses unravels global molecular changes in the brain and liver of a rat model for chronic Sake (Japanese alcoholic beverage) intake, Electrophoresis, 2009, 30(8), 1259–1275 CrossRef PubMed.
- D. J. Beale, O. A. Jones and A. V. Karpe, et al., A Review of Analytical Techniques and Their Application in Disease Diagnosis in Breathomics and Salivaomics Research, Int. J. Mol. Sci., 2016, 18(1), E24 CrossRef PubMed.
- J. L. Wolfender, G. Marti and A. Thomas, et al., Current approaches and challenges for the metabolite profiling of complex natural extracts, J. Chromatogr. A, 2015, 1382, 136–164 CrossRef PubMed.
- K. Kleparnik, Recent advances in combination of capillary electrophoresis with mass spectrometry: methodology and theory, Electrophoresis, 2015, 36(1), 159–178 CrossRef PubMed.
- S. S. Zhao, X. Zhong and C. Tie, et al., Capillary electrophoresis-mass spectrometry for analysis of complex samples, Proteomics, 2012, 12(19–20), 2991–3012 CrossRef PubMed.
- A. Garcia, J. Godzien and A. Lopez-Gonzalvez, et al., Capillary electrophoresis mass spectrometry as a tool for untargeted metabolomics, Bioanalysis, 2017, 9(1), 99–130 CrossRef PubMed.
- A. Stalmach, A. Albalat and W. Mullen, et al., Recent advances in capillary electrophoresis coupled to mass spectrometry for clinical proteomic applications, Electrophoresis, 2013, 34(11), 1452–1464 CrossRef PubMed.
- R. M. Onjiko, E. P. Portero and S. A. Moody, et al., In Situ Microprobe Single-Cell Capillary Electrophoresis Mass Spectrometry: Metabolic Reorganization in Single Differentiating Cells in the Live Vertebrate (Xenopus laevis) Embryo, Anal. Chem., 2017, 89(13), 7069–7076 CrossRef PubMed.
- J. Zeng, P. Yin and Y. Tan, et al., Metabolomics study of hepatocellular carcinoma: discovery and validation of serum potential biomarkers by using capillary electrophoresis-mass spectrometry, J. Proteome Res., 2014, 13(7), 3420–3431 CrossRef PubMed.
- T. Fujii, K. Hattori and T. Miyakawa, et al., Metabolic profile alterations in the postmortem brains of patients with schizophrenia using capillary electrophoresis-mass spectrometry, Schizophrenia Research, 2017, 183, 70–74 CrossRef PubMed.
- A. B. Kanu, P. Dwivedi and M. Tam, et al., Ion mobility-mass spectrometry, J. Mass Spectrom., 2008, 43(1), 1–22 CrossRef PubMed.
- C. Lapthorn, F. Pullen and B. Z. Chowdhry, Ion mobility spectrometry-mass spectrometry (IMS-MS) of small molecules: separating and assigning structures to ions, Mass Spectrom. Rev., 2013, 32(1), 43–71 CrossRef PubMed.
- M. Holcapek, R. Jirasko and M. Lisa, Recent developments in liquid chromatography-mass spectrometry and related techniques, J. Chromatogr. A, 2012, 1259, 3–15 CrossRef PubMed.
- G. Paglia and G. Astarita, Metabolomics and lipidomics using traveling-wave ion mobility mass spectrometry, Nat. Protoc., 2017, 12(4), 797–813 CrossRef PubMed.
- P. Dugourd, R. R. Hudgins, D. E. Clemmer and M. F. Jarrold, High-resolution ion mobility measurements, Rev. Sci. Instrum., 1997, 68(2), 1122–1129 CrossRef.
- M. Kliman, J. C. May and J. A. McLean, Lipid analysis and lipidomics by structurally selective ion mobility-mass spectrometry, Biochim. Biophys. Acta, 2011, 1811(11), 935–945 CrossRef PubMed.
- F. Lanucara, S. W. Holman and C. J. Gray, et al., The power of ion mobility-mass spectrometry for structural characterization and the study of conformational dynamics, Nat. Chem., 2014, 6(4), 281–294 CrossRef PubMed.
- A. A. Shvartsburg and R. D. Smith, Fundamentals of traveling wave ion mobility spectrometry, Anal. Chem., 2008, 80(24), 9689–9699 CrossRef PubMed.
- B. T. Ruotolo, J. L. Benesch and A. M. Sandercock, et al., Ion mobility-mass spectrometry analysis of large protein complexes, Nat. Protoc., 2008, 3(7), 1139–1152 CrossRef PubMed.
- M. F. Bush, Z. Hall and K. Giles, et al., Collision cross sections of proteins and their complexes: a calibration framework and database for gas-phase structural biology, Anal. Chem., 2010, 82(22), 9557–9565 CrossRef PubMed.
- E. Jurneczko and P. E. Barran, How useful is ion mobility mass spectrometry for structural biology? The relationship between protein crystal structures and their collision cross sections in the gas phase, Analyst, 2011, 136(1), 20–28 RSC.
- R. Guevremont, High-field asymmetric waveform ion mobility spectrometry: a new tool for mass spectrometry, J. Chromatogr. A, 2004, 1058(1–2), 3–19 CrossRef PubMed.
- X. Zhang, V. M. Chiu and G. Stoica, et al., Metabolic analysis of striatal tissues from Parkinson's disease-like rats by electrospray ionization ion mobility mass spectrometry, Anal. Chem., 2014, 86(6), 3075–3083 CrossRef PubMed.
- A. P. Bowman, R. R. Abzalimov and A. A. Shvartsburg, Broad Separation of Isomeric Lipids by High-Resolution Differential Ion Mobility Spectrometry with Tandem Mass Spectrometry, J. Am. Soc. Mass Spectrom., 2017, 28(8), 1552–1561 CrossRef PubMed.
- P. Dwivedi, A. J. Schultz and H. H. Hill, Metabolic Profiling of Human Blood by High Resolution Ion Mobility Mass Spectrometry (IM-MS), Int. J. Mass Spectrom., 2010, 298(1–3), 78–90 CrossRef PubMed.
- R. Gonzalez-Dominguez, A. Sayago and A. Fernandez-Recamales, Direct infusion mass spectrometry for metabolomic phenotyping of diseases, Bioanalysis, 2017, 9(1), 131–148 CrossRef PubMed.
- L. Lin, Q. Yu and X. Yan, et al., Direct infusion mass spectrometry or liquid chromatography mass spectrometry for human metabonomics? A serum metabonomic study of kidney cancer, Analyst, 2010, 135(11), 2970–2978 RSC.
- S. Anand, S. Young and M. S. Esplin, et al., Detection and confirmation of serum lipid biomarkers for preeclampsia using direct infusion mass spectrometry, J. Lipid Res., 2016, 57(4), 687–696 CrossRef PubMed.
- R. Gonzalez-Dominguez, T. Garcia-Barrera and J. Vitorica, et al., Metabolomic screening of regional brain alterations in the APP/PS1 transgenic model of Alzheimer's disease by direct infusion mass spectrometry, J. Pharm. Biomed. Anal., 2015, 102, 425–435 CrossRef PubMed.
- J. T. Kapron, E. Pace and C. K. Van Pelt, et al., Quantitation of midazolam in human plasma by automated chip-based infusion nanoelectrospray tandem mass spectrometry, Rapid Commun. Mass Spectrom., 2003, 17(18), 2019–2026 CrossRef PubMed.
- C. E. Hop, Y. Chen and L. J. Yu, Uniformity of ionization response of structurally diverse analytes using a chip-based nanoelectrospray ionization source, Rapid Commun. Mass Spectrom., 2005, 19(21), 3139–3142 CrossRef PubMed.
- G. A. Valaskovic, L. Utley and M. S. Lee, et al., Ultra-low flow nanospray for the normalization of conventional liquid chromatography/mass spectrometry through equimolar response: standard-free quantitative estimation of metabolite levels in drug discovery, Rapid Commun. Mass Spectrom., 2006, 20(7), 1087–1096 CrossRef PubMed.
- Y. Zhang, C. He and L. Qiu, et al., Serum Unsaturated Free Fatty Acids: A Potential Biomarker Panel for Early-Stage Detection of Colorectal Cancer, J. Cancer, 2016, 7(4), 477–483 CrossRef PubMed.
- Y. Zhang, L. Qiu and Y. Wang, et al., Unsaturated free fatty acids: a potential biomarker panel for early detection of gastric cancer, Biomarkers, 2014, 19(8), 667–673 Search PubMed.
- Y. Zhang, L. Qiu and Y. Wang, et al., High-throughput and high-sensitivity quantitative analysis of serum unsaturated fatty acids by chip-based nanoelectrospray ionization-Fourier transform ion cyclotron resonance mass spectrometry: early stage diagnostic biomarkers of pancreatic cancer, Analyst, 2014, 139(7), 1697–1706 RSC.
- Y. Zhang, L. Song and N. Liu, et al., Decreased serum levels of free fatty acids are associated with breast cancer, Clin. Chim. Acta, 2014, 437, 31–37 CrossRef PubMed.
- Y. Zhang, C. He and L. Qiu, et al., Serum unsaturated free fatty acids: potential biomarkers for early detection and disease progression monitoring of non-small cell lung cancer, J. Cancer, 2014, 5(8), 706–714 CrossRef PubMed.
- T. Guinan, P. Kirkbride and P. E. Pigou, et al., Surface-assisted laser desorption ionization mass spectrometry techniques for application in forensics, Mass Spectrom. Rev., 2015, 34(6), 627–640 CrossRef PubMed.
- M. Lu and Z. Cai, Advances of MALDI-TOF MS in the analysis of traditional Chinese medicines, Top. Curr. Chem., 2013, 331, 143–164 CrossRef PubMed.
- T. R. Sandrin, J. E. Goldstein and S. Schumaker, MALDI TOF MS profiling of bacteria at the strain level: a review, Mass Spectrom. Rev., 2013, 32(3), 188–217 CrossRef PubMed.
- M. Lu, X. Yang and Y. Yang, et al., Nanomaterials as Assisted Matrix of Laser Desorption/Ionization Time-of-Flight Mass Spectrometry for the Analysis of Small Molecules, Nanomaterials, 2017, 7(4), 87 CrossRef PubMed.
- J. J. van Kampen, P. C. Burgers and R. de Groot, et al., Biomedical application of MALDI mass spectrometry for small-molecule analysis, Mass Spectrom. Rev., 2011, 30(1), 101–120 CrossRef PubMed.
- T. P. Cleland and E. R. Schroeter, A Comparison of Common Mass Spectrometry Approaches for Paleoproteomics, J. Proteome Res., 2018, 17(3), 936–945 CrossRef PubMed.
- L. Sleno and D. A. Volmer, Some fundamental and technical aspects of the quantitative analysis of pharmaceutical drugs by matrix-assisted laser desorption/ionization mass spectrometry, Rapid Commun. Mass Spectrom., 2005, 19(14), 1928–1936 CrossRef PubMed.
- J. J. van Kampen, P. C. Burgers and R. A. Gruters, et al., Quantitative analysis of antiretroviral drugs in lysates of peripheral blood mononuclear cells using MALDI-triple quadrupole mass spectrometry, Anal. Chem., 2008, 80(13), 4969–4975 CrossRef PubMed.
- S. Xu, Y. Li and H. Zou, et al., Carbon nanotubes as assisted matrix for laser desorption/ionization time-of-flight mass spectrometry, Anal. Chem., 2003, 75(22), 6191–6195 CrossRef PubMed.
- S. N. Baker and G. A. Baker, Luminescent carbon nanodots: emergent nanolights, Angew. Chem., Int. Ed. Engl., 2010, 49(38), 6726–6744 CrossRef PubMed.
- K. S. Novoselov, A. K. Geim and S. V. Morozov, et al., Electric field effect in atomically thin carbon films, Science, 2004, 306(5696), 666–669 CrossRef PubMed.
- Y. K. Kim and D. H. Min, Mechanistic study of laser desorption/ionization of small molecules on graphene oxide multilayer films, Langmuir, 2014, 30(42), 12675–12683 CrossRef PubMed.
- M. He, S. Guo and Z. Li, In situ characterizing membrane lipid phenotype of breast cancer cells using mass spectrometry profiling, Sci. Rep., 2015, 5, 11298 CrossRef PubMed.
- Y. Zhang, Y. Wang and S. Guo, et al., Ammonia-treated N-(1-naphthyl)ethylenediamine dihydrochloride as a novel matrix for rapid quantitative and qualitative determination of serum free fatty acids by matrix-assisted laser desorption/ionization-Fourier transform ion cyclotron resonance mass spectrometry, Anal. Chim. Acta, 2013, 794, 82–89 CrossRef PubMed.
- K. Chughtai and R. M. Heeren, Mass spectrometric imaging for biomedical tissue analysis, Chem. Rev., 2010, 110(5), 3237–3277 CrossRef PubMed.
- P. M. Angel and R. M. Caprioli, Matrix-assisted laser desorption ionization imaging mass spectrometry: in situ molecular mapping, Biochemistry, 2013, 52(22), 3818–3828 CrossRef PubMed.
- E. M. Weaver and A. B. Hummon, Imaging mass spectrometry: from tissue sections to cell cultures, Adv. Drug Delivery Rev., 2013, 65(8), 1039–1055 CrossRef PubMed.
- J. L. Norris and R. M. Caprioli, Analysis of tissue specimens by matrix-assisted laser desorption/ionization imaging mass spectrometry in biological and clinical research, Chem. Rev., 2013, 113(4), 2309–2342 CrossRef PubMed.
- R. Vismeh, D. J. Waldon and Y. Teffera, et al., Localization and quantification of drugs in animal tissues by use of desorption electrospray ionization mass spectrometry imaging, Anal. Chem., 2012, 84(12), 5439–5445 CrossRef PubMed.
- A. Ly, A. Buck and B. Balluff, et al., High-mass-resolution MALDI mass spectrometry imaging of metabolites from formalin-fixed paraffin-embedded tissue, Nat. Protoc., 2016, 11(8), 1428–1443 CrossRef PubMed.
- I. Kaganman, SIMS for membranes, Nat. Methods, 2006, 3(12), 962–963 CrossRef PubMed.
- Y. P. Kim, E. Oh and Y. H. Oh, et al., Protein kinase assay on peptide-conjugated gold nanoparticles by using secondary-ion mass spectrometric imaging, Angew. Chem., Int. Ed. Engl., 2007, 46(36), 6816–6819 CrossRef PubMed.
- T. J. Comi, S. W. Ryu and R. H. Perry, Synchronized Desorption Electrospray Ionization Mass Spectrometry Imaging, Anal. Chem., 2016, 88(2), 1169–1175 CrossRef PubMed.
- L. S. Eberlin, DESI-MS imaging of lipids and metabolites from biological samples, Methods Mol. Biol., 2014, 1198, 299–311 CrossRef PubMed.
- Z. Takats, J. M. Wiseman and B. Gologan, et al., Mass spectrometry sampling under ambient conditions with desorption electrospray ionization, Science, 2004, 306(5695), 471–473 CrossRef PubMed.
- P. Nemes, A. A. Barton and Y. Li, et al., Ambient molecular imaging and depth profiling of live tissue by infrared laser ablation electrospray ionization mass spectrometry, Anal. Chem., 2008, 80(12), 4575–4582 CrossRef PubMed.
- P. Nemes, A. A. Barton and A. Vertes, Three-dimensional imaging of metabolites in tissues under ambient conditions by laser ablation electrospray ionization mass spectrometry, Anal. Chem., 2009, 81(16), 6668–6675 CrossRef PubMed.
- M. R. Groseclose, P. P. Massion and P. Chaurand, et al., High-throughput proteomic analysis of formalin-fixed paraffin-embedded tissue microarrays using MALDI imaging mass spectrometry, Proteomics, 2008, 8(18), 3715–3724 CrossRef PubMed.
- S. Castellino, M. R. Groseclose and D. Wagner, MALDI imaging mass spectrometry: bridging biology and chemistry in drug development, Bioanalysis, 2011, 3(21), 2427–2441 CrossRef PubMed.
- K. Schwamborn and R. M. Caprioli, Molecular imaging by mass spectrometry – looking beyond classical histology, Nat. Rev. Cancer, 2010, 10, 639–646 CrossRef PubMed.
- J. Franck, K. Arafah and M. Elayed, et al., MALDI imaging mass spectrometry: state of the art technology in clinical proteomics, Mol. Cell. Proteomics, 2009, 8(9), 2023–2033 CrossRef PubMed.
- M. Karas and R. Kruger, Ion formation in MALDI: the cluster ionization mechanism, Chem. Rev., 2003, 103(2), 427–440 CrossRef PubMed.
- K. K. Murray, C. A. Seneviratne and S. Ghorai, High resolution laser mass spectrometry bioimaging, Methods, 2016, 104, 118–126 CrossRef PubMed.
- P. Chaurand, Introducing specificity and sensitivity in imaging MS, Bioanalysis, 2015, 7(18), 2279–2281 CrossRef PubMed.
- B. Banstola, E. T. Grodner and F. Cao, et al., Systematic assessment of surfactants for matrix-assisted laser desorption/ionization mass spectrometry imaging, Anal. Chim. Acta, 2017, 963, 76–82 CrossRef PubMed.
- D. Zhou, S. Guo and M. Zhang, et al., Mass spectrometry imaging of small molecules in biological tissues using graphene oxide as a matrix, Anal. Chim. Acta, 2017, 962, 52–59 CrossRef PubMed.
- A. Bodzon-Kulakowska and P. Suder, Imaging mass spectrometry: instrumentation, applications, and combination with other visualization techniques, Mass Spectrom. Rev., 2016, 35(1), 147–169 CrossRef PubMed.
- M. L. Kraft and H. A. Klitzing, Imaging lipids with secondary ion mass spectrometry, Biochim. Biophys. Acta, 2014, 1841(8), 1108–1119 CrossRef PubMed.
- N. T. N. Phan, M. Munem and A. G. Ewing, et al., MS/MS analysis and imaging of lipids across Drosophila brain using secondary ion mass spectrometry, Anal. Bioanal. Chem., 2017, 409(16), 3923–3932 CrossRef PubMed.
- P. J. Roach, J. Laskin and A. Laskin, Nanospray desorption electrospray ionization: an ambient method for liquid-extraction surface sampling in mass spectrometry, Analyst, 2010, 135(9), 2233–2236 RSC.
- R. Graham Cooks, Z. Ouyang and Z. Takats, et al., Ambient Mass Spectrometry, Science, 2006, 311, 1566–1570 CrossRef PubMed.
- D. R. Ifa, C. Wu and Z. Ouyang, et al., Desorption electrospray ionization and other ambient ionization methods: current progress and preview, Analyst, 2010, 135(4), 669–681 RSC.
- J. Laskin, B. S. Heath and P. J. Roach, et al., Tissue imaging using nanospray desorption electrospray ionization mass spectrometry, Anal. Chem., 2012, 84(1), 141–148 CrossRef PubMed.
- A. K. Jarmusch, V. Pirro and Z. Baird, et al., Lipid and metabolite profiles of human brain tumors by desorption electrospray ionization-MS, Proc. Natl. Acad. Sci. U. S. A., 2016, 113(6), 1486–1491 CrossRef PubMed.
- I. Lanekoff, K. Burnum-Johnson and M. Thomas, et al., High-speed tandem mass spectrometric in situ imaging by nanospray desorption electrospray ionization mass spectrometry, Anal. Chem., 2013, 85(20), 9596–9603 CrossRef PubMed.
- P. Nemes and A. Vertes, Laser ablation electrospray ionization for atmospheric pressure, in vivo, and imaging mass spectrometry, Anal. Chem., 2007, 79(21), 8098–8106 CrossRef PubMed.
- P. N. Akos Vertes, S. Bindesh and A. B. Alexis, et al., Molecular imaging by Mid-IR laser ablation mass spectrometry, Appl. Phys. A: Mater. Sci. Process., 2008, 93(4), 885–891 CrossRef.
- P. Nemes, A. S. Woods and A. Vertes, Simultaneous imaging of small metabolites and lipids in rat brain tissues at atmospheric pressure by laser ablation electrospray ionization mass spectrometry, Anal. Chem., 2010, 82(3), 982–988 CrossRef PubMed.
- C. Wu, A. L. Dill, L. S. Eberlin, R. G. Cooks and D. R. Ifa, et al., Mass spectrometry imaging under ambient conditions, Mass Spectrom. Rev., 2013, 32(3), 218–243 CrossRef PubMed.
- H. Li, P. Balan and A. Vertes, Molecular Imaging of Growth, Metabolism, and Antibiotic Inhibition in Bacterial Colonies by Laser Ablation Electrospray Ionization Mass Spectrometry, Angew. Chem., Int. Ed. Engl., 2016, 55(48), 15035–15039 CrossRef PubMed.
- R. B. Cody, J. A. Laramee and H. D. Durst, Versatile new ion source for the analysis of materials in open air under ambient conditions, Anal. Chem., 2005, 77(8), 2297–2302 CrossRef PubMed.
- C. D. Calvano, I. D. van der Werf and F. Palmisano, et al., Revealing the composition of organic materials in polychrome works of art: the role of mass spectrometry-based techniques, Anal. Bioanal. Chem., 2016, 408(25), 6957–6981 CrossRef PubMed.
- C. Y. Pierce, J. R. Barr and R. B. Cody, et al., Ambient generation of fatty acid methyl ester ions from bacterial whole cells by direct analysis in real time (DART) mass spectrometry, Chem. Commun., 2007, 8, 807–809 RSC.
- J. Hajslova, T. Cajka and L. Vaclavik, Challenging applications offered by direct analysis in real time (DART) in food-quality and safety analysis, TrAC, Trends Anal. Chem., 2011, 30(2), 204–218 CrossRef.
- J. H. Gross, Direct analysis in real time – a critical review on DART-MS, Anal. Bioanal. Chem., 2014, 406(1), 63–80 CrossRef PubMed.
- T. Cajka, H. Danhelova and A. Vavrecka, et al., Evaluation of direct analysis in real time ionization-mass spectrometry (DART-MS) in fish metabolomics aimed to assess the response to dietary supplementation, Talanta, 2013, 115, 263–270 CrossRef PubMed.
- M. Zhou, J. F. McDonald and F. M. Fernandez, Optimization of a direct analysis in real time/time-of-flight mass spectrometry method for rapid serum metabolomic fingerprinting, J. Am. Soc. Mass Spectrom., 2010, 21(1), 68–75 CrossRef PubMed.
- G. Gürdeniz, M. Kristensen and T. Skov, et al., The Effect of LC-MS Data Preprocessing Methods on the Selection of Plasma Biomarkers in Fed vs. Fasted Rats, Metabolites, 2012, 2(1), 77–99 CrossRef PubMed.
- J. B. Coble and C. G. Fraga, Comparative evaluation of preprocessing freeware on chromatography/mass spectrometry data for signature discovery, J. Chromatogr. A, 2014, 1359, 155–164 CrossRef PubMed.
- Y. Chen, J. Xu and R. Zhang, et al., Assessment of data pre-processing methods for LC-MS/MS-based metabolomics of uterine cervix cancer, Analyst, 2013, 138(9), 2669–2677 RSC.
- A. Scalbert, L. Brennan and O. Fiehn, et al., Mass-spectrometry-based metabolomics: limitations and recommendations for future progress with particular focus on nutrition research, Metabolomics, 2009, 5, 435–458 CrossRef PubMed.
- O. Fiehn, D. Robertson and J. Griffin, et al., The metabolomics standards initiative (MSI), Metabolomics, 2007, 3(3), 175–178 CrossRef.
- L. W. Sumner, A. Amberg and D. Barrett, et al., Proposed minimum reporting standards for chemical analysis, Metabolomics, 2007, 3, 211–221 CrossRef PubMed.
- K. Haug, R. M. Salek and P. Conesa, et al., MetaboLights-an open-access general-purpose repository for metabolomics studies and associated meta-data, Nucleic Acids Res., 2012, 41, D781–D786 CrossRef PubMed.
- R. M. Salek, C. Steinbeck and M. R. Viant, et al., The role of reporting standards for metabolite annotation and identification in metabolomic studies, GigaScience, 2013, 2(1), 13 CrossRef PubMed.
- S. Qiu, A. Zhang and T. Zhang, et al., Dissect new mechanistic insights for geniposide efficacy on the hepatoprotection using multiomics approach, Oncotarget, 2017, 8(65), 108760–108770 Search PubMed.
- A. Zhang, H. Sun and X. Wang, Emerging role and recent applications of metabolomics biomarkers in obesity disease research, RSC Adv., 2017, 7(25), 14966–14973 RSC.
- A. Zhang, H. Fang and Y. Wang, et al., Discovery and verification of the potential targets from bioactive molecules by network pharmacology-based target prediction combined with high-throughput metabolomics, RSC Adv., 2017, 7, 51069–51078 RSC.
- A. H. Zhang, H. Sun and Y. Han, et al., Ultraperformance liquid chromatography-mass spectrometry based comprehensive metabolomics combined with pattern recognition and network analysis methods for characterization of metabolites and metabolic pathways from biological data sets, Anal. Chem., 2013 Aug 6, 85(15), 7606–7612 Search PubMed.
- A. Zhang, H. Sun and G. Yan, et al., Mass spectrometry-based metabolomics: applications to biomarker and metabolic pathway research, Biomed. Chromatogr., 2016, 30(1), 7–12 CrossRef PubMed.
- Y. Nan, X. Zhou and Q. Liu, et al., Serum metabolomics strategy for understanding pharmacological effects of ShenQi pill acting on kidney yang deficiency syndrome, J. Chromatogr. B: Anal. Technol. Biomed. Life Sci., 2016, 1026, 217–226 CrossRef PubMed.
- Q. Liang, H. Liu and Y. Jiang, et al., High-throughput metabolic profiling for discovering metabolic biomarkers of sepsis-induced acute lung injury, RSC Adv., 2016, 6, 11008–11013 RSC.
- A. Zhang, G. Yan and H. Sun, et al., Deciphering the biological effects of acupuncture treatment modulating multiple metabolism pathways, Sci. Rep., 2016, 6, 19942 CrossRef PubMed.
- H. Chu, A. Zhang and Y. Han, et al., Metabolomics approach to explore the effects of Kai-Xin-San on Alzheimer's disease using UPLC/ESI-Q-TOF mass spectrometry, J. Chromatogr. B: Anal. Technol. Biomed. Life Sci., 2016, 1015–1016, 50–61 CrossRef PubMed.
| This journal is © The Royal Society of Chemistry 2018 |