 Open Access Article
Creative Commons Attribution 3.0 Unported Licence
Enhanced visible-light photocatalytic activity and photostability of Ag3PO4/Bi2WO6 heterostructures toward organic pollutant degradation and plasmonic Z-scheme mechanism†
Fengyan Maa,
Qilin Yanga,
Zhengjun Wanga,
Yahong Liua,
Jianjiao Xina,
Jingjing Zhanga,
Yuting Haoa and
Li Li *ab
*ab
aCollege of Chemistry and Chemical Engineering, Qiqihar University, Qiqihar 161006, Heilongjiang, P. R. China
bCollege of Materials Science and Engineering, Qiqihar University, Qiqihar 161006, Heilongjiang, P. R. China. E-mail: qqhrlili@126.com
First published on 27th April 2018
Abstract
Novel Ag3PO4/Bi2WO6 heterostructured materials with enhanced visible-light catalytic performance were successfully synthesized by assembly combined with a hydrothermal treatment. The microstructures, morphologies, and optical properties of the prepared samples were characterized by multiple techniques. The irregular Ag3PO4 nanospheres dispersed on the surface of Bi2WO6 nanoflakes, and their catalytic performances were evaluated via the degradation of organic pollutants including rhodamine B (RB), methylene blue (MB), crystal violet (CV), methyl orange (MO), and phenol (Phen) under visible-light irradiation. The resulting Ag3PO4/Bi2WO6 heterostructured materials displayed higher photocatalytic activity than that of either pure Bi2WO6 or Ag3PO4. The enhanced photocatalytic activity was due to the good formation of heterostructures, which could not only broaden the spectral response range to visible light but also effectively promoted the charge separation. Meanwhile, the reasonable photoreactive plasmonic Z-scheme mechanism was carefully investigated on the basic of the reactive species scavenging tests, photoelectrochemical experiments, and photoluminescence (PL) spectrum. In addition, the excellent photostability of Ag3PO4/Bi2WO6 was obtained, which Ag formed at the early photocatalytic reaction acted as the charge transmission-bridge to restrain the further photoreduction of Ag3PO4.
1. Instruction
Recently, semiconductor photocatalysis has attracted more and more attention as a green, highly efficient technology for resolving the current energy and environmental problems.1–3 Photocatalysts based on TiO2, ZnO are inactive under visible light irradiation due to their wide bandgap energy and improper band position, which requires ultraviolet irradiation that only accounts for less than 5% of the solar energy.4–6 And the main reason for their poor photocatalytic activity might be due to the strong recombination of photogenerated electron–hole (e−–h+) pairs, which is a widespread phenomenon among semiconductor photocatalysts. Therefore, it is still challenging to extend the photo-response range and improve the charge separation efficiency of the semiconductor photocatalysts for satisfying the requirements of applications.Recently, Bi-based semiconductor materials, such as Bi2WO6, BiVO4, Bi2MO6, Bi2Mo2O9, Bi24O31Br10, and BiOBr, have attracted widespread attention in photocatalytic application owing to the relatively narrow gap, nontoxicity, chemical inertness, stability, and sunlight utilization for wastewater treatment.7–14 Among the Bi-based semiconductor materials, Bi2WO6, as a typical aurivillius oxide, is regarded one of the ideal photocatalyst materials because of its unique layered structure feature and relatively high visible photocatalytic activity. However, the photocatalytic activity of bare Bi2WO6 is limited by the high recombination rate of photogenerated e−–h+ pairs and the low absorption capacity of visible-light (less than 450 nm).15,16 Therefore, how to improve separation efficiency of photoinduced e−–h+ pairs during the photocatalytic reactions becomes a key issue for developing the Bi2WO6-based photocatalysts.
More recently, among the reported Ag-based semiconductors, especially silver orthophosphate (Ag3PO4), which has a strong absorption (λ < 530 nm), has been considered as a promising photocatalyst with outstanding visible-light catalytic activity.17,18 Meanwhile, Ag3PO4 possesses extremely oxidation power, which not only oxidizes H2O to produce O2 but also degrades organic pollutants under visible-light irradiation.19–22 However, there are some flaws limit its extensive use as following: (1) Ag3PO4 is slightly soluble in water due to its larger solubility product constant (Ksp = 1.6 × 10⁻¹⁶)23; (2) as the photosensitive material, it can be easily corroded by light and reduced to Ag0 in the photocatalytic process without electron acceptors;24 (3) it suffers from the fast recombination of photogenerated charge-carries.25
In the present study, Ag3PO4 is introduced on the basis of the following points: (1) Ag3PO4 is a narrow-semiconductor (Eg = 2.4 eV), and its introduction is beneficial to extend the light response of Bi2WO6 to a higher wavelength region and thereby decreasing its band gap; (2) two semiconductors possess the matching band structure, similar band gap, and the proper molar ratio, and build effective heterostructures, which promote the efficient separation of the e−–h+ pairs and therefore increasing the quantum yield; (3) part Ag3PO4 is reduced to metallic Ag during the initial photocatalytic reaction. It is precisely this part of the elemental silver can be used as a solid-state electron mediator to accelerate charge separation through Z-scheme system, which improve the charge separation, prevent the continuing reductive decomposition of Ag3PO4, and enhance its stability. Hence, the coupling of Bi2WO6 with Ag3PO4 to form heterostructures is considered to be one of the most promising methods to improve the visible-light-driven catalytic performance of photocatalysts (Bi2WO6 or Ag3PO4) because the heterostructures not only broaden the spectral response range to visible light but also promote the charge separation. This point is confirmed by the deposition of Ag3PO4 onto certain semiconductor materials. Please see the Table 1 (ESI†). Table 1 summarizes the detailed information on literature reported Ag3PO4 photocatalysts. Compared with the semiconductor materials, such as ZnO,26 graphene27 (G), InVO4/BiVO4,28 and Bi2MoO6,29 Bi2WO6 as support can well improve the photocatalytic activity of Ag3PO4.
| Samples | SBET (m2 g−1) | Vp (cm3 g−1) | Dp (nm) |
|---|---|---|---|
| Ag3PO4 | 8.06 | 0.038 | 11.47 |
| Ag3PO4/Bi2WO6-0.3 | 14.50 | 0.049 | 9.46 |
| Ag3PO4/Bi2WO6-0.5 | 18.21 | 0.070 | 10.74 |
| Bi2WO6 | 43.55 | 0.16 | 10.44 |
Among a good deal of the heterojunction photocatalysts, the all-solid-state Z-scheme photocatalytic system possesses advantages over improving separation ratio of photo-induced e−–h+ pairs and enhancing the stability of photocatalyst. In general, the all-solid-state Z-scheme photocatalytic system consists of two different semiconductor materials and an electron mediator. Notably, metallic Ag as a solid-state electron mediator would contribute to the construction of Z-scheme system. Recently, Yuan et al. successfully prepared Ag3PO4/CuBi2O4 photocatalyst and formed Ag3PO4/Ag/CuBi2O4 photocatalyst during the photocatalytic degradation process, which can enhance photocatalytic activity and stability of photocatalyst through the formation of Z-scheme system.30 Liu et al. also designed a novel visible-light-driven Ag/Ag3PO4/WO3 Z-scheme heterostructures by a facile deposition–precipitation method followed by photoreducing Ag+ into metallic Ag. The Ag/Ag3PO4/WO3 showed enhanced photocatalytic RhB efficiency, indicating the formed Z-scheme heterostructures could efficiently promote the separation and transfer of photogenerated e−–h+ pairs.31 So the combination of Bi2WO6 and Ag3PO4 to construct Z-scheme would be an efficient strategy.
To the best of our knowledge, there is less report on the achievement of Bi2WO6-based heterojunction by the introduction of Ag3PO4. For instance, Somchai Thongtem prepared Ag3PO4/Bi2WO6 toward RB (5 ppm) degradation efficiency can reach 100% after 80 min visible-light illumination.32 Because it is still not sufficient for practical application. It is necessary to further improve the photocatalytic activity of Ag3PO4/Bi2WO6. In addition, there is no corresponding research reports to discuss the Ag3PO4/Bi2WO6 for pollutants' removal based on the plasmonic Z-scheme mechanism. Therefore, it is meaningful to apply the SPR effect of Ag nanoparticles into the hybrid composite to design highly efficient visible-light-driven photocatalysts based on Z-scheme charge transfer mechanism.
Herein, we successfully fabricated Ag3PO4/Bi2WO6 heterostructures via the assembly combined with a hydrothermal technique. The Ag3PO4/Bi2WO6 heterostructures displayed enhanced photocatalytic performance toward organic pollutants (including rhodamine B (RB), phenol (Phen), methyl orange (MO), crystal violet (CV), and methylene blue (MB)) degradation under visible-light irradiation. Subsequently, microstructures, surface chemical states, specific surface areas, optical, and photoelectrochemical properties of Ag3PO4/Bi2WO6 heterojunction were systematically studied. Meanwhile, a possible visible-light-induced photocatalytic mechanism of Ag3PO4/Bi2WO6 heterostructures was proposed.
2. Experiment section
2.1 Preparation of photocatalysts
2.2 Characterization of photocatalysts
The crystal structures were obtained on a Bruker-AXS (D8) X-ray diffractometer with Cu Kα radiation. X-ray photoelectron spectroscopy (XPS) characterization was carried out on an ESCALAB 250Xi spectrometer equipped with Al Kα radiation at 300 W. N2 adsorption–desorption isotherm analysis of samples were obtained at 77 K using Micromeritics 3H-2000PS2. The morphologies of synthesized samples were analyzed using a scanning electron microscope (SEM) (Hitachi S-4300) and transmission electron microscope (TEM) and high resolution transmission electron microscope (HRTEM) (JEM-2100F). The UV-visible diffuse reflectance spectra (UV-vis-DRS) were recorded using a UV-vis spectrophotometer (TU-1901) over the wavelength range of 200–800 nm using BaSO4 as the reflectance standard material. Fourier transform infrared (FT-IR) spectra were recorded using an FT-IR spectrophotometer (PE Company, America). Photoluminescence spectra (PL) were obtained by a Hitachi F-7000 spectrofluorometer with an excitation wavelength of 360 nm, and all the samples were pressed into pellets in the sample holder.2.3 Photocatalytic tests
Photocatalytic activities of the Ag3PO4/Bi2WO6 heterostructures were studied by monitoring the degradation behaviors of organic contaminants, including RB, Phen, MO, CV, and MB. The photocatalytic experiments were carried out in a hollow cylindrical photoreactor equipped with a water jacket. 400 W Xe lamp (λ > 410.0 nm; moreover, the inner sleeve was made of No. 11 glasses to filter out ultraviolet from the Xe lamp) was used as the visible-light source. The Xe lamp was positioned within the inner part of the photoreactor and cooling water was circulated through a pyrex jacket surrounding the lamp to keep room temperature. In a typical experimental procedure, 200 mg of catalyst was placed into 220 mL of dye (50 ppm) or Phen (25 ppm) solution via ultrasonication for 10 min, and magnetically stirred in the dark for 1 h to establish the adsorption–desorption equilibrium between the catalyst and organic contaminant. Then the suspension was exposed to visible light irradiation under magnetic stirring. 4 mL of the suspension was collected at a regular time interval and analyzed after centrifugation. The dye concentration was analyzed by UV-vis spectrophotometer (TU-1901) at the maximum absorption spectra. Changes of Phen concentrations were monitored by a Yilite P230II HPLC: C18 column, UV detector (λ = 270 nm), methanol/water (50/50, v/v), and 1 mL min−1.2.4 Photoelectrochemical experiments
Electrochemical measurements were carried out in a traditional three-electrode system (CHI660E, China). Indium-tin oxide (ITO) glass electrode (1 cm2), saturated calomel electrode (SCE), and Pt sheet were used as the working electrode, reference electrode, and the counter electrode, respectively. The sample mixed with Nafion ionomer was dissolved ethanol aqueous solution to obtain 5 mg L−1 suspension. And then the suspension was uniformly drop-coated onto the clean ITO electrode surface and dried in air. A Xe lamp was used as the light source, and aqueous Na2SO4 solution (0.01 mol L−1) served as the electrolyte. All the experiments were performed at room temperature (about 25 °C). The photocurrent was measured under light illumination from a 400 W Xe lamp. The electrochemical impedance study was carried out over a frequency domain of 1 Hz to 100 kHz with a sinusoidal perturbation potential of 5 mV.3. Results and discussion
3.1 Characteristics of microstructures of Ag3PO4/Bi2WO6
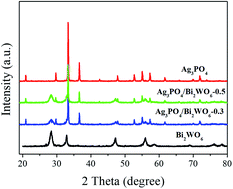
XRD is used to investigate the crystal structure of the samples. As displayed in Fig. 1, the distinct diffraction peaks of Bi2WO6 can be found 28.3°, 32.8°/32.9°, 47.1°, 56.0°, 58.5°, 68.8°, 75.9°, and 78.5°, which can be attributed to the (131), (200)/(002), (202), (133), (262), (400), (193), and (204) crystal planes of orthorhombic phase of Bi2WO6 (JCPDS 39-0256). While for pure Ag3PO4, the characteristic peaks of 21.7° (110), 29.7° (200), 33.3° (210), 36.5° (211), 47.8° (310), 52.6°(222), 54.9°(320), 57.2° (321), 61.8°(400), and 71.8°(421) are well indexed as the body-centered cubic phase of Ag3PO4 (JCPDS 06-0505). In case of Ag3PO4/Bi2WO6 composites, they show the coexistence of Bi2WO6 phase and Ag3PO4 phase. Furthermore, the peak intensity of Bi2WO6 increases with increasing the Bi2WO6 loading, while the peak intensity of Ag3PO4 lowers simultaneously. However, the peak position of Ag3PO4 does not significantly change, which indicates Bi2WO6 is not incorporated into Ag3PO4 lattice. In addition, no diffraction peaks of Ag or other impurities are found.X-ray photoelectron spectroscopy (XPS) as surface analytic technique is employed to detect the electronic structures of Ag3PO4, Bi2WO6, and Ag3PO4/Bi2WO6 composites. Fig. 2a shows the high-resolution XPS spectra of Ag of the Ag3PO4 and Ag3PO4/Bi2WO6 composite catalysts. The typical peaks of Ag 3d at 368.0 eV (Ag 3d5/2) and 374.0 eV (Ag 3d3/2) are ascribed to Ag+ in Ag3PO4.33 After the Bi2WO6 introduction, the binding energy of spin-obit Ag 3d is divided into two peaks at 368.3 and 374.3 eV (ref. 24 and 34), which is 0.3 eV higher than those of Ag3PO4. The characteristic peaks of Ag nanocrystals existing on the surface of Ag3PO4 and Ag3PO4/Bi2WO6 are not found, suggesting no Ag0 was formed during the preparation of the catalysts. Compared with pure Ag3PO4, the binding energy of P 2p of Ag3PO4/Bi2WO6 is turned from 132.8 eV to a higher value of 133.8 eV (Fig. 2b). As shown in Fig. 2c, the peaks located at 159.3 eV, 164.6 eV, and 159.9 eV, 165.2 eV correspond to the Bi 4f7/2 and Bi 4f5/2 of Bi2WO6 and Ag3PO4/Bi2WO6, respectively, implying the bismuth species in the composite is Bi3+ cations. The peaks for W 4f7/2 (35.98 eV) and W 4f5/2 (37.98 eV) can be attributed to a six-valent oxidation state for W6+ in Ag3PO4/Bi2WO6, meaning 0.2 and 0.1 eV deviation of 4f7/2 and 4f5/2 relative to the values in pure Bi2WO6 (Fig. 2d).
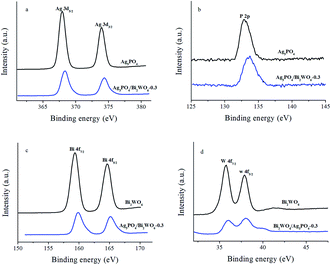 | ||
| Fig. 2 The high-resolution XPS spectra of Ag 3d (a), P 2p (b), Bi 4f (c), and W 4f (d) for the Ag3PO4, Bi2WO6, and Ag3PO4/Bi2WO6-0.3. | ||
The O 1s high-resolution XPS spectra of samples are provided in Fig. S1 (ESI†). The O 1s XPS spectra of Bi2WO6 (Ag3PO4) show three individual peaks with the binding energies of 530.2 eV (530.2 eV, denoted as O 1s(1)), 531.6 eV (531.3 eV, denoted as O 1s(2)), and 533.1 eV (533.1 eV, denoted as O 1s(3)), which can be attributed to the lattice oxygen in Bi2WO6 (Ag3PO4), the external hydroxyl groups, and adsorbed oxygen species at the surface of the composite.35–37 For Ag3PO4/Bi2WO6-0.3, the binding energies of O 1s orbits are 529.9 eV, 531.4 eV, and 533.1 eV, respectively. And they also display more or less lower energy shift compared with individual counterparts. The variations of the binding energies of Ag 3d, P 2p, Bi 4f, W 4f, and O 1s are attributed to chemical interactions between Bi2WO6 and Ag3PO4, which proves the formation of heterostructures and facilitates interfacial charge transfer, leading to the improved photocatalytic activity of Ag3PO4/Bi2WO6 nanocomposites. Beyond that, the tight chemical interactions can improve the structural stability of photocatalyst. The similar results were also reported by another group.38,39
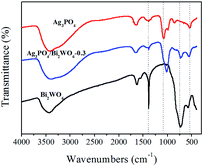
FT-IR spectra were carried out to investigate the presence of Ag3PO4 and Bi2WO6 in the Ag3PO4/Bi2WO6 composite. As shown in Fig. 3, the typical peaks located at 577.8 cm−1, 731.6 cm−1, and 1384 cm−1 are attributed to the Bi–O, W–O, and W–O–W bridging stretching modes, respectively, which indicates the existence of Bi2WO6.40,41 For pure Ag3PO4, the stronger peak at 543.1 cm−1 is ascribed to bending vibration of O![[double bond, length as m-dash]](https://www.rsc.org/images/entities/char_e001.gif) P–O. The other absorption bands at 859.9 cm−1 and 1076.4 cm−1 are assigned to the symmetric and asymmetric stretching vibrations of P–O–P rings.42 After the Bi2WO6 introduction, the typical peaks corresponding Bi–O, W–O, and W–O–W stretching modes in Ag3PO4/Bi2WO6 composite disappear, shift to lower value, and become weak, respectively. However, compared with pure Ag3PO4, the wavenumbers of P–O–P symmetric and asymmetric stretching vibrations shift to lower values of 817.6 cm−1 and 1017.5 cm−1. Meanwhile, that of O
P–O. The other absorption bands at 859.9 cm−1 and 1076.4 cm−1 are assigned to the symmetric and asymmetric stretching vibrations of P–O–P rings.42 After the Bi2WO6 introduction, the typical peaks corresponding Bi–O, W–O, and W–O–W stretching modes in Ag3PO4/Bi2WO6 composite disappear, shift to lower value, and become weak, respectively. However, compared with pure Ag3PO4, the wavenumbers of P–O–P symmetric and asymmetric stretching vibrations shift to lower values of 817.6 cm−1 and 1017.5 cm−1. Meanwhile, that of O![[double bond, length as m-dash]](https://www.rsc.org/images/entities/char_e001.gif) P–O changes from 543.1 cm−1 to 559.3 cm−1. In addition, the bands at 3400 cm−1 and 1654 cm−1 are related to the –OH stretching and vibration of adsorbed H2O on the surface of photocatalysts. These results further verify the interaction between Bi2WO6 and Ag3PO4, meaning Bi2WO6 was successfully modified Ag3PO4.
P–O changes from 543.1 cm−1 to 559.3 cm−1. In addition, the bands at 3400 cm−1 and 1654 cm−1 are related to the –OH stretching and vibration of adsorbed H2O on the surface of photocatalysts. These results further verify the interaction between Bi2WO6 and Ag3PO4, meaning Bi2WO6 was successfully modified Ag3PO4.
The typical morphologies of Ag3PO4, Bi2WO6, and Ag3PO4/Bi2WO6 composites were characterized by SEM images. From Fig. 4a, Ag3PO4 shows irregular spherical morphology with a diameter of 100–180 nm. While Bi2WO6 exhibits a typical structure of nanoflakes consist of nanoparticles with the side length of 50–250 nm (Fig. 4b). Fig. 4c illustrates the typical SEM image of Ag3PO4/Bi2WO6-0.3, where irregular spherical Ag3PO4 nanoparticles disperse on the surface of Bi2WO6 nanoflakes. These tiny particles intertwine with each other, suggesting that Ag3PO4 nanoparticles can restrain the agglomeration of Bi2WO6 nanoflakes.
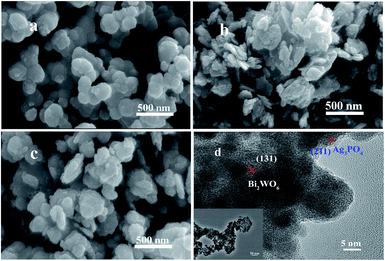 | ||
| Fig. 4 SEM images of Ag3PO4 (a), Bi2WO6 (b), Ag3PO4/Bi2WO6-0.3 (c), and HRTEM (d) and TEM images (inset d) of Ag3PO4/Bi2WO6-0.3. | ||
The morphological and microstructural details of Ag3PO4/Bi2WO6-0.3 are obtained by TEM and HRTEM technique. As displayed in the inset of Fig. 4d, the Ag3PO4 irregular spheres disperse over the surface of Bi2WO6 nanoflakes, which is coincided with the aforementioned SEM observations. From the HRTEM image of Ag3PO4/Bi2WO6-0.3 (Fig. 4d), the lattice distances for the Bi2WO6 (131) and Ag3PO4 (211) facets are measured to be 0.315 and 0.245 nm, respectively, which is in well accordance with the XRD results. Furthermore, to further prove the formation of heterostructure, the energy dispersive spectroscopy (EDS) elemental mapping of Ag3PO4/Bi2WO6-0.3 was performed. As shown in Fig. S2(b–f) (ESI†), Ag3PO4 and Bi2WO6 are relatively uniform dispersion and well connected, which is in accordance with that of SEM and TEM images. Therefore, according to the above results, it gives solid evidence for the formation of heterostructure between Bi2WO6 and Ag3PO4.
The BET specific surface area and the porous structure of the samples were analyzed by nitrogen adsorption–desorption isotherms, the results shown in Table 1. As shown in Fig. 5a, the N2 isotherms of samples show characteristic type IV isotherms with H3 hysteresis loops, implying the presence of mesopores in the size of 2–50 nm. This result can be further proved by the pore size distribution analysis (Fig. 5b). And the specific surface area of pure Ag3PO4, Ag3PO4/Bi2WO6-0.3, Ag3PO4/Bi2WO6-0.5, and Bi2WO6 is 8.06, 14.50, 18.21, and 43.55 m2 g−1, respectively. The BJH absorption cumulative pore volume increases from 0.038 to 0.070 cm3 g−1 after incorporation with Bi2WO6. The results imply the specific surface area and pore volume of Ag3PO4/Bi2WO6 slight enhance with increasing Bi2WO6 loading contrast with Ag3PO4. But the specific surface area and pore volume have no obvious change among these samples, which play a minor role in the enhanced photocatalytic activity of Ag3PO4/Bi2WO6 composite.
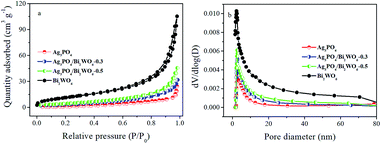 | ||
| Fig. 5 N2 adsorption–desorption isotherm curves (a) and pore size distribution (b) of the as-prepared samples. | ||
3.2 Optical absorption properties
The optical absorbance properties and gap energies of the Ag3PO4, Bi2WO6, and Ag3PO4/Bi2WO6 composites were determined using the UV-vis-DRS, and the results were displayed in Fig. 6. From Fig. 6a, the pure Bi2WO6 exhibits strong absorbance in the wavelengths shorter than 450 nm owing to the intrinsic band-gap transition,43 and Ag3PO4 has the absorption edge at about 530 nm, which is consistent with the reported result.44 Compared with Bi2WO6, the wavelength regions of the Ag3PO4/Bi2WO6 composite are extended towards the visible-light region. Moreover, the more obvious red shift phenomenon is observed with increasing the Ag3PO4 loading, which implies more visible light is absorbed by the composite, and produce more e−–h+ pairs, further improve the photocatalytic activity.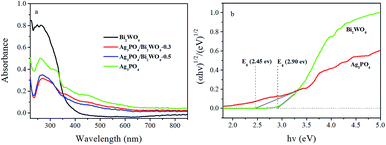 | ||
| Fig. 6 UV-vis DRS (a) and the plots of (αhν)1/2 versus photon energy for the band gap energies (b) of Ag3PO4, Bi2WO6, and Ag3PO4/Bi2WO6 photocatalysts. | ||
The band gap energies of the photocatalysts are calculated according to the following equation:
| (αhν) = A (hν − Eg)n/2 | (1) |
In this equation, A, α, h, hν, and Eg are constant, absorption coefficient, Planck constant, the energy of the incident photon, and band gap, respectively. And n is 1 and 4 for a direct and indirect band gap semiconductor, respectively. The value of n for Bi2WO6 and Ag3PO4 is 1 (ref. 20 and 45). By calculating, the band gaps of Bi2WO6 and Ag3PO4 are 2.90 and 2.45 eV, respectively. The band edge positions of photocatalysts can be determined by the empirical equations:
| EVB = X − Ee + 0.5 Eg | (2) |
| ECB = EVB − Eg, | (3) |
3.3 Photocatalytic tests
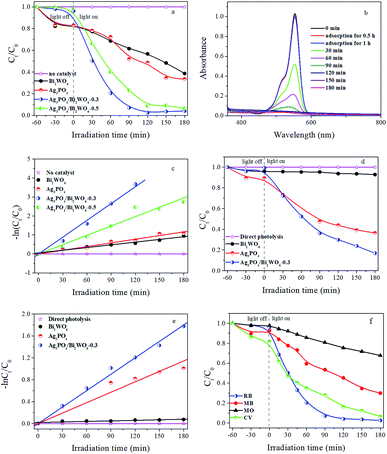
Based on the above results, the photocatalytic activities of prepared photocatalysts were evaluated by degradation of RB under visible-light irradiation. As shown in Fig. 7a, adsorption tests display all suspensions of photocatalyst and RB reach adsorption–desorption equilibrium after 1 h stirring in dark. Meanwhile, the visible-light photocatalytic activities of samples were investigated. The results show that: (1) without the catalyst, no RB is degraded under visible-light irradiation for 180 min, implying RB is relative stability under longtime irradiation; (2) in the presence of catalysts and light, the RB-degradation efficiency is greatly improved. Compared with pure Bi2WO6 and Ag3PO4, Ag3PO4/Bi2WO6 composites show higher photocatalytic activity. Furthermore, with increasing molar ratio of Ag3PO4/Bi2WO6 from 0 to 0.3, Ag3PO4/Bi2WO6 composites display enhanced photocatalytic activity and then decrease with increasing to 0.5. For example, RB-degradation efficiency of Bi2WO6, Ag3PO4, Ag3PO4/Bi2WO6-0.3, and Ag3PO4/Bi2WO6-0.5 can reach 43.2%, 51.4%, 97.5%, and 91.4% after 120 min visible-light illumination.Fig. 7b shows the absorption spectra of RB (λmax = 553 nm) under visible-light irradiating the photoactive Ag3PO4/Bi2WO6-0.3. The absorption peak intensity of RB located at 553 nm reduces rapidly with prolonged irradiation time, and it is hardly observed after 120 min visible-light illumination. The results are consistent with Fig. 7a. In addition, we find the obvious blue shift of the absorption peak at 553 nm, which corresponds to the de-ethylation process. Therefore, the cleavage of the whole conjugated chromophore structure of RB leads to rapidly reducing the absorption peak intensity of RB, which indicates intermediate products were formed and then degraded to small molecules or CO2 during the RB degradation process.15,46
The pseudo-first-order model based on the Langmuir–Hinshelwood (LH) kinetic model is mainly used to estimate the kinetics of the photocatalytic degradation of RB, as shown in the following equation:
| −ln(Ct/C0) = kappt, | (4) |
In order to eliminate the influence of dye sensitization, Phen as the colorless compound is selected as a model molecule to further study the photocatalytic performance of Ag3PO4/Bi2WO6 under visible-light irradiation. Because that Phen (λmax = 270 nm) has no absorption and no photosensitization in visible-light region. Fig. 7d and e show the relative concentration (Ct/C0) and −ln(Ct/C0) vs. time curves of Phen in the presence of Bi2WO6, Ag3PO4, and Ag3PO4/Bi2WO6-0.3. As displayed in Fig. 7d, the direct photolysis of Phen is neglected during the whole visible-light irradiation, indicating Phen is also a stable pollutant. However, the degradation efficiency of Phen is about 7.1%, 63.5%, and 83.1% in the presence of Bi2WO6, Ag3PO4, and Ag3PO4/Bi2WO6-0.3, respectively. Their corresponding rate constants are obtained from Fig. 7e to be 0.00033 min−1, 0.00634 min−1, and 0.00999 min−1, respectively. The results are consistent with those obtained for RB degradation. Meanwhile, the above results confirm that photocatalytic performance of Ag3PO4/Bi2WO6-0.3 is due to the excitation of the photocatalyst rather than the sensitization mechanism.
In order to test the extensive adaptability of the Ag3PO4/Bi2WO6 photocatalyst, anionic dye (MO) and cationic dyes (RB, MB, and CV) are also employed as target pollutants. As depicted in Fig. 7f, MO, RB, MB, and CV are effectively eliminated after visible-light irradiation, which implies that the Ag3PO4/Bi2WO6 photocatalyst is highly efficient in the visible-light degradation of pollutants, especially cationic dyes. The excellent photocatalytic activity of Ag3PO4/Bi2WO6 towards to organic pollutants is due to the good formation of heterostructures, which not only broaden the spectral response range to visible light but also effectively promote the charge separation. In addition, the excessive Ag3PO4 may act as a recombination center, and cover the active sites on the Bi2WO6 surface, leading to reducing the separation efficiency of the photogenerated charge carriers. It can be confirmed from the following PL results (Fig. S4, ESI†). That is why Ag3PO4/Bi2WO6-0.3 shows higher photocatalytic activity than Ag3PO4/Bi2WO6-0.5.
The photostability of a photocatalyst is essential for practical application. To research the reusability of photocatalysts, recycled photocatalytic degradation RB test was performed over Ag3PO4/Bi2WO6-0.3 composite. As shown in Fig. 8a, the photodegradation percentage of RB after visible light irradiation for 90 min reduced from the original 92.9–86.5%, 75.8%, 71.5%, 68.5% and 68.1% after six cycles. Although the degradation efficiency of RB in the reactive system went on 24.8%, the photodegradation percentage of RB was almost the same after the five and six cycles, indicating that the catalyst had a certain stability. The slight decline of photocatalytic efficiency is attributed to the inevitable loss of photocatalysts during the recycle runs. In addition, the color of RB-photocatalysts suspension had been changed from pink to black, indicating metallic Ag was formed on the surface of the catalyst during the photocatalytic process. This phenomenon is confirmed by the comparative XRD patterns of Ag3PO4/Bi2WO6 before and after the photocatalytic experiments in Fig. 8b. There is one weak peak located at 38.1° for Ag3PO4/Bi2WO6-0.3 after cycles, which can be classified as the characteristic peak of metallic silver.47 This part Ag formed at the early photocatalytic reaction. Meanwhile, UV-vis/DRS, the high-resolution XPS spectra of Ag 3d, and SEM image of Ag3PO4/Bi2WO6-0.3 after reaction are also shown in Fig. S3 (ESI†). As displayed in Fig. S3(a),† Ag3PO4/Bi2WO6-0.3 displays enhanced photo-absorption in the visible-light region after the cycle degradation experiments. In particular, a broad prominent absorption in the visible-light region of 450–800 nm is observed, owing to the surface plasmon resonance (SPR) effect of Ag nanoparticles.47 Fig. S3(b)† shows the Ag XPS spectra of Ag3PO4/Bi2WO6-0.3 after cycles. The peaks located at 368.8 and 374.9 eV are assigned to Ag0, and the typical peaks located at 367.8 and 373.8 eV are ascribed to Ag+. According to the XPS results, the content of Ag0 is about 30% after cycles. As shown in Fig. S3(c),† although the aggregation phenomenon becomes more obvious after the photocatalytic reaction, Ag3PO4/Bi2WO6-0.3 still maintain their morphologies. These results further prove that the photocorrosion resistance and stability of Ag3PO4 were improved by introducing Bi2WO6 to construct Ag3PO4-Ag-Bi2WO6 Z-scheme heterostructures.
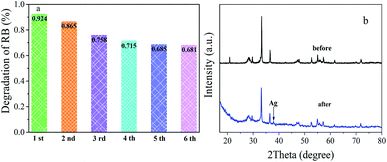 | ||
| Fig. 8 Cyclic photocatalytic degradation of RB over Ag3PO4/Bi2WO6-0.3 (a); XRD patterns of Ag3PO4/Bi2WO6-0.3 before and after the cycle degradation experiments (b). | ||
3.4 Photocatalytic mechanism discussion
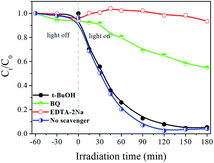
Fig. 9 depicts the effects of various scavengers on the degradation of RB. The addition of t-BuOH can hardly inhibit RB degradation, which demonstrates that hydroxyl radicals ˙OH have little influence in the photocatalytic process. However, when the EDTA-2Na and BQ were added into the reaction system, the photocatalytic activities of Ag3PO4/Bi2WO6-0.3 are obviously decelerated. Furthermore, the photodegradation percentage of RB is reduced from the original 100–6.6% and 45.1%, respectively. The above results suggested that h+ and ˙O2− are main active species during the degradation process.
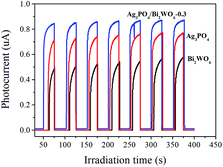 | ||
| Fig. 10 Photocurrent responses of Ag3PO4, Bi2WO6, and Ag3PO4/Bi2WO6-0.3 under visible light irradiation. | ||
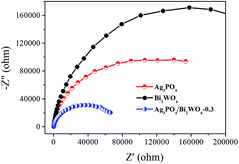
Electrochemical impedance spectroscopy (EIS) is also employed to investigate the charge transfer resistance and the separation of photogenerated e−–h+ pairs at solid/electrolyte interfaces in the photocatalyst.50 Fig. 11 displays the EIS Nyquist plots of Bi2WO6, Ag3PO4, and Ag3PO4/Bi2WO6-0.3 under visible-light irradiation. It is clearly seen that the smallest arc radius of the EIS Nyquist plot of Ag3PO4/Bi2WO6-0.3 implies that it has the fastest interfacial electron transfer and more separation of photogenerated e−–h+ pairs when compared to those of Bi2WO6 and Ag3PO4. It is the reason for the Ag3PO4/Bi2WO6-0.3 composites exhibit the highest photocatalytic activity.
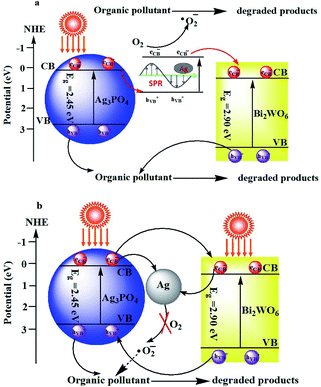
Photoluminescence (PL) spectrum is also an effective tool to reveal the migration, transfer and recombination processes of the photogenerated e−–h+ pairs in semiconductors. Usually, a lower PL intensity indicates lower recombination rate of the charge carriers and higher photocatalytic activities of the photocatalysts. Fig. S4 (ESI†) shows the PL spectra of as-prepared Ag3PO4, Bi2WO6, and Ag3PO4/Bi2WO6 composites with an excitation wavelength of 360 nm. As for the Bi2WO6-based materials, their PL intensities follow the order Bi2WO6 > Ag3PO4/Bi2WO6-0.5 > Ag3PO4/Bi2WO6-0.3 > Ag3PO4. Compared with pure Bi2WO6, the PL intensities of Ag3PO4/Bi2WO6 composites present an obvious decrease, implying a lower recombination feasibility of free charges in the Ag3PO4/Bi2WO6 heterostructures. The Ag3PO4/Bi2WO6 nanocomposite displays a higher PL intensity than Ag3PO4, implying that the migration pathways of the photoexcited e−–h+ in the Ag3PO4/Bi2WO6 nanocomposite is plasmonic Z-scheme theory (Scheme 1a) not as heterojunction energy-band theory (Scheme 1b).51,52
From the Scheme 1a, under visible-light irradiation, both Bi2WO6 and Ag3PO4 can be excited to produce e− and h+ simultaneously owing to their visible-light response. On the one hand, the part of Ag3PO4 can be photoreduced to Ag0 during the initial photocatalytic process. Ag nanoparticles (NPs) can absorb visible light and induce e−–h+ pairs on account of the dipolar character and the SPR effect of the Ag NPs. The photogenerated electrons in the CB of Ag3PO4 shift to the photogenerated holes produced by plasmonic absorption in the Ag NPs, which results in higher PL intensity. On other the hand, the plasmon hot electrons generated by the localized SPR oscillations of Ag NPs can capture the dissolved O2 in water to form ˙O2− (ref. 53). Meanwhile, the plasmon hot electrons directly transfer from the Ag NPs to the CB of Bi2WO6. While the photogenerated holes are still in the VB of Ag3PO4 and Bi2WO6. Therefore, the photo-generated charge carriers are efficiently separated in space, which retards the photocorrosion of Ag3PO4. With the assistance of h+ and ˙O2− the two main active species, the organic pollutant is effectively degraded in aqueous solution. But from the heterojunction energy-band theory described in Scheme 1b, the VB potential (2.68 eV vs. NHE) of Ag3PO4 is more negative than that of Bi2WO6 (3.08 eV vs. NHE), which leads to the migration of the h+ from Bi2WO6 to Ag3PO4. Since the CB potential (0.24 eV vs. NHE) of Ag3PO4 is more negative than that of Bi2WO6 (0.44 eV vs. NHE), photo-induced electrons from Ag3PO4 migrate to the CB of Bi2WO6 and then transfer to Ag0. Therefore, the photo-generated electrons cannot reduce O2 to produce ˙O2−, due to the CB potential of Bi2WO6 being more positive than the redox potential of ˙O2− formation (O2/˙O2− = −0.33 eV, NHE).51 Thus this phenomenon cannot explain the stronger effect of ˙O2− on the degradation of RB. In conclusion, the plasmonic Z-scheme theory for the photocatalysis of Ag3PO4/Bi2WO6 is much more reasonable.
4. Conclusions
Novel Ag3PO4/Bi2WO6 heterostructured materials were successfully synthesized by assembling Ag3PO4 irregular nanospheres on the surface of Bi2WO6 nanoflakes. Ag3PO4/Bi2WO6-0.3 showed obviously superior visible-light catalytic activity toward degradation of organic pollutants. Free radical and hole scavenging experiments suggested h+ and ˙O2− are two main active species through the degradation process. In brief, the enhanced photocatalytic activity was due to the good formation of heterostructures, which could not only broaden the spectral response range to visible light but also effectively promoted the charge separation. These results were solidly confirmed by photocurrent responses, electrochemical impedance spectroscopy, and photoluminescence spectrum. In addition, Ag3PO4/Bi2WO6-0.3 exhibited relative higher photostability toward RB degradation, which was explained by the reasonable photoreactive mechanism. This work provides the potential application of Bi2WO6-based heterostructures as efficient visible light responsive catalysts for environmental remediation.Conflicts of interest
There are no conflicts to declare.Acknowledgements
This work is supported by The Fundamental Research Funds in Heilongjiang Provincial Universities (135109204).Notes and references
- Q. J. Xiang, D. Lang, T. T. Shen and F. Liu, Appl. Catal., B, 2015, 162, 196 CrossRef CAS.
- J. H. Kou, C. H. Lu, J. Wang, Y. K. Chen, Z. Z. Xu and R. S. Varma, Chem. Rev., 2017, 117, 1445 CrossRef CAS PubMed.
- K. Wenderich and G. Mul, Chem. Rev., 2016, 116, 14587 CrossRef CAS PubMed.
- H. Huang, N. Huang, Z. H. Wang, G. Q. Xia, M. Chen, L. L. He, Z. F. Tong and C. G. Ren, J. Colloid Interface Sci., 2017, 502, 77 CrossRef CAS PubMed.
- H. Wei, W. A. McMaster, J. Z. Y. Tan, L. Cao, D. H. Chen and R. A. Caruso, J. Phys. Chem. C, 2017, 121, 22114 CAS.
- P. Mazierski, J. Nadolna, G. Nowaczyk, W. Lisowski, M. J. Winiarski, T. Klimczuk, M. P. Kobylański, S. Jurga and A. Zaleska-Medynska, J. Phys. Chem. C, 2017, 121, 17215 CAS.
- R. F. Tang, H. F. Su, Y. W. Sun, X. X. Zhang, L. Li, C. H. Liu, S. Y. Zeng and D. Z. Sun, J. Colloid Interface Sci., 2016, 466, 388 CrossRef CAS PubMed.
- F. Chen, Q. Yang, J. Sun, F. B. Yao, S. N. Wang, Y. L. Wang, X. L. Wang, X. M. Li, C. G. Niu, D. B. Wang and G. M. Zeng, ACS Appl. Mater. Interfaces, 2016, 8, 32887 CAS.
- Z. Dai, F. Qin, H. P. Zhao, J. Ding, Y. L. Liu and R. Chen, ACS Catal., 2016, 6, 3180 CrossRef CAS.
- J. Li, Y. C. Yin, E. Z. Liu, Y. N. Ma, J. Wan, J. Fan and X. Y. Hu, J. Hazard. Mater., 2017, 321, 183 CrossRef CAS PubMed.
- J. Song, L. Zhang, J. Yang, X. H. Huang and J. S. Hu, Ceram. Int., 2017, 43, 9214 CrossRef CAS.
- J. Song, L. Zhang, J. Yang, X. H. Huang and J. S. Hu, Mater. Des., 2017, 123, 128 CrossRef CAS.
- L. Zhang, X. F. Cao, X. T. Chen and Z. L. Xue, J. Colloid Interface Sci., 2011, 354, 630 CrossRef CAS PubMed.
- X. B. Zhang, L. Zhang, J. S. Hua and X. H. Huang, RSC Adv., 2016, 6, 32349 RSC.
- Y. K. Huang, S. F. Kang, Y. Yang, H. F. Qin, Z. J. Ni, S. J. Yang and X. Li, Appl. Catal., B, 2016, 196, 89 CrossRef CAS.
- C. M. Zhang, G. Chen, C. M. Li, J. X. Sun, C. Lv, S. Fan and W. N. Xing, ACS Sustainable Chem. Eng., 2016, 4, 5936 CrossRef CAS.
- X. J. Chen, Y. Z. Dai and X. Y. Wang, J. Alloys Compd., 2015, 649, 910 CrossRef CAS.
- X. F. Yang, J. L. Qin, Y. Jiang, R. Li, Y. Li and H. Tang, RSC Adv., 2014, 4, 18627 RSC.
- Y. P. Bi, S. X. Ouyang, N. Umezawa, J. Y. Cao and J. H. Ye, J. Am. Chem. Soc., 2011, 133, 6490 CrossRef CAS PubMed.
- Z. G. Yi, J. H. Ye, N. Kikugawa, T. Kako, S. X. Ouyang, H. Stuart-Williams, H. Yang, J. Y. Cao, W. J. Luo, Z. S. Li, Y. Liu and R. L. Withers, Nat. Mater., 2010, 9, 559 CrossRef CAS PubMed.
- X. F. Yang, H. Tang, J. S. Xu, M. Antonietti and M. Shalom, ChemSusChem, 2015, 8, 1350 CrossRef CAS PubMed.
- X. F. Yang, Z. P. Chen, J. S. Xu, H. Tang, K. M. Chen and Y. Jiang, ACS Appl. Mater. Interfaces, 2015, 7, 15285 CAS.
- X. Y. Zhang, H. X. Zhang, Y. Y. Xiang, S. B. Hao, Y. X. Zhang, R. N. Guo, X. W. Cheng, M. Z. Xie, Q. F. Cheng and B. Li, J. Hazard. Mater., 2018, 342, 353 CrossRef CAS PubMed.
- L. Zhou, O. G. Alvarez, C. S. Mazon, L. Chen, H. P. Deng and M. H. Sui, Catal. Sci. Technol., 2016, 6, 5972 CAS.
- J. Tian, T. J. Yan, Z. Qiao, L. L. Wang, W. J. Li, J. M. You and B. B. Huang, Appl. Catal., B, 2017, 209, 566 CrossRef CAS.
- Q. S. Li and C. Yang, Mater. Lett., 2017, 199, 168 CrossRef CAS.
- L. J. Xu, Y. D. Wang, J. Liu, S. G. Han, Z. P. Pan and L. Gan, J. Photochem. Photobiol., A, 2017, 340, 70 CrossRef CAS.
- X. Lin, X. Y. Guo, W. L. Shi, F. Guo, G. B. Che, H. J. Zhai, Y. S. Yan and Q. W. Wang, Catal. Commun., 2015, 71, 21 CrossRef CAS.
- X. Lin, J. Hou, S. S. Jiang, Z. Lin, M. Wang and G. B. Che, RSC Adv., 2015, 5, 104815 RSC.
- W. L. Shi, F. Guo and S. L. Yuan, Appl. Catal., B, 2017, 209, 720 CrossRef CAS.
- Q. Y. Li, F. L. Wang, Y. X. Hua, Y. T. Luo, X. H. Liu, G. R. Duan and X. J. Yang, J. Colloid Interface Sci., 2017, 506, 207 CrossRef CAS PubMed.
- S. Jonjana, A. Phuruangrat, T. Thongtem, B. Kuntalue and S. Thongtem, Mater. Lett., 2018, 218, 146 CrossRef CAS.
- X. Cui, Y. F. Zheng, H. Zhou, H. Y. Yin and X. C. Song, J. Taiwan Inst. Chem. Eng., 2016, 60, 328 CrossRef CAS.
- L. Wang, Y. Y. Chai, J. Ren, J. Ding, Q. Q. Liu and W. L. Dai, Dalton Trans., 2015, 44, 14625 RSC.
- X. F. Qian, D. T. Yue, Z. Y. Tian, M. Reng, Y. Zhu, M. Kan, T. Y. Zhang and Y. X. Zhao, Appl. Catal., B, 2016, 193, 16 CrossRef CAS.
- Y. N. Guo, L. Chen, X. Yang, F. Y. Ma, S. Q. Zhang, Y. X. Yang, Y. H. Guo and X. Yuan, RSC Adv., 2012, 2, 4656 RSC.
- N. Wei, H. Z. Cui, M. L. Wang, X. Z. Wang, X. J. Song, L. Ding and J. Tian, RSC Adv., 2017, 7, 18392 RSC.
- S. Z. You, Y. Hu, X. C. Liu and C. H. Wei, Appl. Catal., B, 2018, 232, 288 CrossRef CAS.
- J. Wan, X. Du, E. Z. Liu, Y. Hu, J. Fan and X. Y. Hu, J. Catal., 2017, 345, 281 CrossRef CAS.
- J. X. Xia, J. Dai, S. Yin, H. Xu, J. Zhang, Y. G. Xu, L. Xu, H. M. Li and M. X. Ji, RSC Adv., 2014, 4, 82 RSC.
- J. Di, J. X. Xia, Y. P. Ge, H. P. Li, H. Y. Ji, H. Xu, Q. Zhang, H. M. Li and M. N. Li, Appl. Catal., B, 2015, 168–169, 51 CrossRef CAS.
- N. N. Wang, Y. Zhou, C. H. Chen, L. Y. Cheng and H. M. Ding, Catal. Commun., 2016, 73, 74 CrossRef CAS.
- R. F. Tang, H. F. Su, S. X. Duan, Y. W. Sun, L. Li, X. X. Zhang, S. Y. Zeng and D. Z. Sun, RSC Adv., 2015, 5, 41949 RSC.
- X. Lin, J. Hou, S. S. Jiang, Z. Lin, M. Wang and G. B. Che, RSC Adv., 2015, 5, 104815 RSC.
- W. K. Jo, J. Y. Lee and T. S. Natarajan, Phys. Chem. Chem. Phys., 2016, 18, 1000 RSC.
- X. Lin, X. Y. Guo, W. L. Shi, F. Guo, G. B. Che, H. J. Zhai, Y. S. Yan and Q. W. Wang, Catal. Commun., 2015, 71, 21 CrossRef CAS.
- T. Cai, Y. T. Liu, L. L. Wang, S. Q. Zhang, Y. X. Zeng, J. L. Yuan, J. H. Ma, W. Y. Dong, C. B. Liu and S. L. Luo, Appl. Catal., B, 2017, 208, 1 CrossRef CAS.
- A. Kaur and S. K. Kansal, Chem. Eng. J., 2016, 302, 194 CrossRef CAS.
- B. Panigrahy and S. Srivastava, New J. Chem., 2016, 40, 3370 RSC.
- L. Liu, Y. H. Qi, J. R. Lu, S. L. Lin, W. J. An, Y. H. Liang and W. Q. Cui, Appl. Catal., B, 2016, 183, 133 CrossRef CAS.
- S. P. Wan, M. Ou, Q. Zhong and S. L. Zhang, New J. Chem., 2018, 42, 318 RSC.
- S. F. Chen, L. Ji, W. M. Tang and X. L. Fu, Dalton Trans., 2013, 42, 10759 RSC.
- H. Tang, Y. H. Fu, S. F. Chang, S. Y. Xie and G. G. Tang, Chin. J. Catal., 2017, 38, 337 CrossRef CAS.
Footnote |
| † Electronic supplementary information (ESI) available. DOI: 10.1039/c8ra01477a |
| This journal is © The Royal Society of Chemistry 2018 |

