 Open Access Article
Mesoporous NiO nanosphere: a sensitive strain sensor for determination of hydrogen peroxide†
Qin Lia,
Wenbin Gaoa,
Xiaopeng Zhanga,
Haitao Liuab,
Meiling Douab,
Zhengping Zhang*ab and
Feng Wang *ab
*ab
aState Key Laboratory of Chemical Resource Engineering, Beijing Key Laboratory of Electrochemical Process and Technology for Materials, Beijing University of Chemical Technology, Beijing 100029, China
bBeijing Advanced Innovation Center for Soft Matter Science and Engineering, Beijing University of Chemical Technology, Beijing 100029, China. E-mail: wangf@mail.buct.edu.cn; zhangzhengping@mail.buct.edu.cn
First published on 10th April 2018
Abstract
Exploring the sensitive and reliable methods for the determination of hydrogen peroxide (H2O2) is a crucial issue for the health and environmental challenges. Herein, we demonstrate a facile, but rational and effective solvothermal approach to the synthesis of hierarchical NiO mesoporous nanospheres (NiO-MNS) as an effective non-enzymatic sensor towards the H2O2 detection. Owing to the intercalation and stabilization effect of polyethylene glycol for the Ni(OH)2 intermediate, the NiO mesoporous nanosphere (NiO-MNS) product is consistent with the low-dimensional nanostructured NiO blocks with large surface area and plentiful mesopores after the calcination treatment. The obtained NiO-MNS sensor presents superior electrochemical performance with a high sensitivity (236.7 μA mM−1 cm−2) and low limit of detection (0.62 μM), as well as the good selectivity and reliability for the further application of H2O2 detection. In addition, the unraveling mechanism of the mesopores formation derived from the in situ measurements also offers the valuable guidance for the future design of porous materials for electrochemical devices and other applications.
1. Introduction
As one of the most important basic chemicals, hydrogen peroxide (H2O2) has been widely used in various industrial applications and people's daily life (e.g., pharmaceutical, textile, food and environmental protection, etc.).1–3 However, the residual H2O2 will generate free hydroxyl radicals, which are hazardous for major cellular constituents and living organisms.4,5 Driven by the health issues and environmental challenges, the development of sensitive and reliable determination for the sensing of H2O2 has gained more and more concerns. As a promising approach to H2O2 determination, non-enzymatic electrochemical sensors exhibit many irreplaceable advantages, such as high sensitivity, low detection limit, good selectivity, as well as the rapid and cost-effective operation.6,7 Most non-enzymatic electrodes are modified with multiple-oxidation-stated metal and metal oxides to overcome the sluggish kinetics and high over potential.8,9 Although the Au- or Pt-modified electrodes have been widely investigated due to their high electrochemical activity10–12, the high price and scarcity of these noble metals have greatly limited the practical application and large-scale commercialization. Among the non-noble metal materials studied, transition metal oxides have attracted the most interest owing to their low-cost, stable physical/chemical property and environmental benignity.13–17As one of the potential candidates for transition metal oxide sensors, NiO is one kind of the efficient H2O2 sensing materials for the electrocatalytic oxidation from its redox couple of Ni(II)/Ni(III) in the alkaline electrolyte. To make the NiO sensor employed in practical application, great efforts have been devoted to the improvement of its electrochemical performance.18–20 Nevertheless, limited by the inherently poor electronic conductivity and large volume changes, the design of NiO as a high-efficiency sensor mainly focuses on optimizing the nanoarchitectures to enhance the electrochemical reactivity. Due to the crosslinking texture with large surface area and rational porous structure, hierarchical porous nanomaterials, which are assembled by low-dimensional nanostructured blocks, represent the enhanced electronic conductivity, increased active sites and facilitated mass-transfer ability.21–24 In order to obtain such unique electronic properties and structural features, various synthetic methodologies have been attempted.25–30 As one of the efficient methodologies, the solvothermal synthetic process can make nickel ions slowly hydrolyze with the H2O molecules from the nickel salt hydrate without alkaline precipitants, which can make more precise control over surface properties, phases, and architectures.
Herein, we report a facile, but rational and effective approach to the synthesis of 3D hierarchical NiO mesoporous nanospheres (NiO-MNS) by polyol-mediated solvothermal without alkaline precipitants. Ethylene glycol (EG) and a spot of polyethylene glycol (PEG) were employed as solvent and stabilizer, respectively. Owing to the contribution of PEG to the direction of Ni(OH)2 intermediates and the effect of pore formation during the calcination process, the obtained NiO nanospheres with low-dimensional nanostructured NiO units and plentiful porous structure should exhibit excellent electrochemical performance. In addition, the unraveling mechanism of the formation of mesopores is also explored by in situ measurements to give the guidance for the future design of other porous materials.
2. Experimental section
2.1. Synthesis of materials
All chemicals were of analytical grade and used without further purification. In a typical procedure, 1.2 g of nickel chloride hexahydrate (NiCl2·6H2O) and 2.2 g of anhydrous sodium acetate (CH3COONa) were dissolved in 40 mL of ethylene glycol (EG) to form a homogeneous solution at room temperature. After that, 0.1 g of polyethylene glycol (PEG, molecular weight = 1000) was introduced into the above solution under constant stirring for 30 min. The mixture was then transferred into a Teflon-lined stainless steel autoclave, sealed, and maintained at 180 °C for 3 h. After completely cooling down, the greenish product was collected by centrifuging, washing with deionized water and ethanol, and drying at 80 °C for 12 h. The obtained Ni(OH)2 intermediate is denoted as PEG/EG-Ni(OH)2, which represents the Ni(OH)2 derived from PEG and EG. For comparison, the Ni(OH)2 intermediate was prepared in the same method without PEG involved (denoted as EG-Ni(OH)2). After calcined in an air atmosphere at 300 °C for 7 h, the PEG/EG-Ni(OH)2 and EG-Ni(OH)2 nanospheres were generated into NiO mesoporous nanosphere (NiO-MNS) and NiO nanosphere (NiO-NS), respectively. The structure and morphology are measured by the further characterizations.2.2 Structural and electrochemical characterization
The scanning electron microscope (SEM, JEOL 6701F), transmission electron microscope (TEM, JEOL JEM-2000FE) were used to investigate the morphology and microstructure of the as-synthesized samples. The X-ray powder diffraction (XRD, Rigaku D/Max 2500 VB2+/PC, Cu Kα radiation, λ = 1.54056 Å, 30 kV, 4° min−1) was carried out to evaluate the phase of the as-prepared products. The Nanometrics HL5550 cryostat was performed to measure the electrical conductivity, based on the standard four-probe technique. The specific surface area and the pore structure were determined by nitrogen adsorption–desorption isotherms on a Micromeritics Tristar 3020II instrument. The thermal gravimetric-infrared (TG-IR) spectra in this work were performed as in situ measurement by the thermal gravimetric-differential thermal analysis (TG-DTA, Mettler-Toledo) cooperated with a Nicolet 6700 Fourier infrared (Thermo Fisher) at a heating rate of 20 °C min−1 with heating region of 40–800 °C in an air atmosphere.All electrochemical measurements were carried out on a CHI660E electrochemical station (CH Instruments, Inc., Shanghai) equipped with a standard three-electrode cell maintained at 25 °C, using a saturated calomel electrode (SCE) as the reference electrode, a Pt wire as the counter electrode, and a modified glassy carbon electrode (GCE, geometric area of 0.071 cm−2) or a bare GCE as the working electrode. The modified working electrode was prepared as follows: 5 mg of sample, 50 μL of Nafion solution (5 wt%, DuPont), and 1 mL of ethanol was mixed to form homogeneous ink by shaking and sonicating for 30 min. Then, 6 μL of the homogeneous ink was loaded onto the GCE and evaporated under an ambient atmosphere. Before modifying, the GCE was polished with aluminium paste (0.05 μm), and then ultrasonically rinsed with deionized water and dried in air. All electrochemical testing is measured in 0.1 M NaOH solution. The reusability testing of NiO-MNS electrode was measured by the difference of two oxidation peaks current (at 0.45 V) of the CV curves (with and without 1 mM H2O2) for every 7 days (stored at 4 °C).
3. Results and discussion
3.1 Morphology and structure
The PEG/EG-Ni(OH)2 and EG-Ni(OH)2 intermediates were first observed with scanning electron microscopy (SEM, Fig. 1a and b). Compared with the EG-Ni(OH)2 intermediate (an average diameter of 650–950 nm), which is derived from EG solution without the addition of PEG, the PEG/EG-Ni(OH)2 intermediate exhibits the more uniform nanospheres (an average diameter of 700–800 nm) consistent with more clearly hierarchical silk-flower texture. After the calcination treatment, the NiO-MNS sample, derived from the PEG/EG-Ni(OH)2 intermediate, exhibits the broccoli-like architecture with the evenly rough surface (Fig. 1c), but the surface structure of NiO-NS has been broken and disorganized (Fig. 1d). Furthermore, we carried out transmission electron microscopy (TEM) to reveal the internal structure of these nanospheres. It is clear that the NiO-MNS is constructed by numerous nanoparticle units (the average size of ca. 10 nm with the close d-spacing of 0.24 nm), which are interconnected with each other (Fig. 1e and g). Additionally, many mesopores are observed in the broccoli-like architectures of NiO-MNS; however, as for NiO-NS, the nanostructured units and obvious porous structure are not detected, which indicates that the bulk texture is generated from Ni(OH)2 intermediate derived from EG solvent without the addition of PEG (Fig. 1f). The electron microscopy images indicate that a spot of PEG, as the stabilizer and morphology-directing agent, may induce the growth of Ni(OH)2 in the sheet-like directions and improve the size uniformity, which favors the PEG/EG-Ni(OH)2 intermediate generating into NiO-MNS with broccoli-like texture and mesoporous structure. Both NiO-MNS and NiO-NS exhibit the same diffraction rings, which indexes to the (111), (200), (220), (311) and (222) planes of NiO, in selected area electron diffraction (SAED) pattern (Fig. S1†). The result reconfirm the formation of NiO nanoparticles.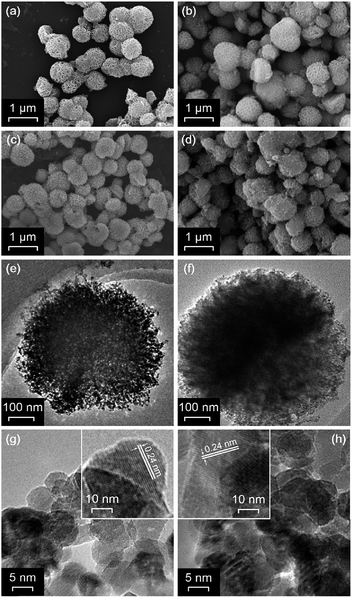 | ||
| Fig. 1 SEM images of (a) PEG/EG-Ni(OH)2, (b) EG-Ni(OH)2, (c) NiO-MNS and (d) NiO-NS. TEM and the corresponding high-resolution TEM images of the (e and g) NiO-MNS and (f and h) NiO-NS samples. | ||
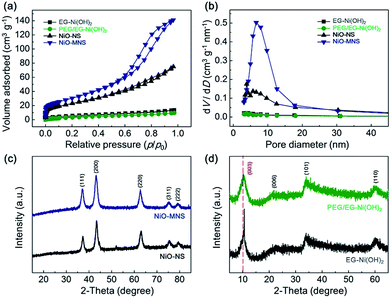
To further confirm the porous structure of NiO-MNS, nitrogen adsorption–desorption measurements were performed for all the final NiO products and Ni(OH)2 intermediates (Fig. 2a). Contrary to PEG/EG-Ni(OH)2 (14.2 m2 g−1) and EG-Ni(OH)2 (18.7 m2 g−1), both NiO-MNS and NiO-NS shows the significantly increased Brunauer–Emmett–Teller (BET) surface area of 113.6 and 85.2 m2 g−1, respectively. Especially, the NiO-MNS sample exhibits apparently type-IV isotherm characteristics of mesopores with much larger surface area than NiO-NS. In addition, Barrett–Joyner–Halenda (BJH) pore size distributions (Fig. 2b) calculated by the nitrogen desorption branches reconfirm the presence of mesopores with diameters <20 nm in the NiO-MNS samples, as well as a higher pore volume (0.22 cm3 g−1) than NiO-NS (0.10 cm3 g−1). We believe that such large surface area, high pore volume and mesoporous structure in the NiO-MNS product, but not in NiO-NS, may be mostly probably caused by the original structure of the Ni(OH)2 intermediates. Therefore, X-ray diffraction (XRD) patterns were obtained to explore the crystalline phases of the NiO products and Ni(OH)2 intermediates. As shown in Fig. 2c, either NiO-MNS or NiO-NS presents a high crystalline degree of NiO phase, where the 37.2°, 43.3°, 62.9°, 75.4° and 79.4° can be indexed to (111), (200), (220), (311) and (222) crystal planes, respectively. No other peaks could be detected. These diffraction peaks are consistent with the face-centered cubic structure with the lattice parameter of 0.24 nm, which correlates well with the lattice fringes of NiO-MNS in the TEM profile. Furthermore, the XRD patterns of PEG/EG-Ni(OH)2 and EG-Ni(OH)2 intermediates were investigated to the evolution of the NiO formation (Fig. 2d). The relative broad diffraction peak of PEG/EG-Ni(OH)2 centered at 10.1° refers to the (003) plane of α-Ni(OH)2 with a low-angle-shift of the EG-Ni(OH)2 (10.6°) and complete crystal (11.3°, JCPDS: no. 38–0715), suggesting that some impurities intercalate into the interlayered space in the Ni(OH)2 lattice.
To investigate the surface chemical structure of NiO-MNS and NiO-NS, we employed the X-ray photoelectron spectroscopic (XPS) measurements and Raman spectra. The XPS survey spectra (Fig. S2†) of NiO-MNS and NiO-NS shows the presence of Ni (NiO-MNS: 43.1 at%; NiO-NS: 43.6 at%) and O (NiO-MNS: 56.9 at%; NiO-NS: 56.4 at%) with similar element contents (Table S1†). In addition, the high-resolution XPS of Ni 2p spectra were deconvoluted into Ni(II), Ni(III) and satellite peaks designated to their oxidized surface,31 and O 1s spectra were deconvoluted into metal–oxygen (O1), oxygen deficiency (O2) and metal-hydroxyl (O3) species (Fig. S3†). Compared with NiO-NS, the higher O2 content of NiO-MNS indicates a larger number of the low oxygen coordination defect sites, which promote the adsorption of H2O molecules and OH− ions and enhance the electrochemical activity of NiO-MNS.32 Furthermore, the Raman spectra (Fig. S4†) of the NiO-MNS and NiO-NS exhibits the peaks at about 490 cm−1 and 1130 cm−1, referring to the first-order longitudinal optical (1LO) and second-order longitudinal optical (2LO) phonon modes of NiO, respectively.33
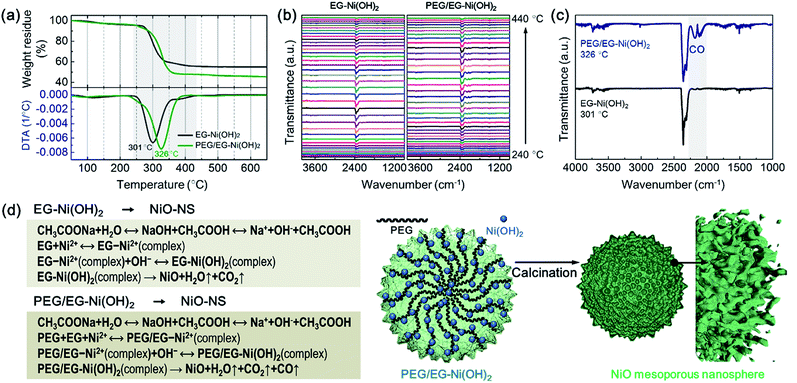
In order to elucidate the origin of enlarged surface area of the NiO-MNS products and the intercalation in the Ni(OH)2 intermediates, we performed PEG/EG-Ni(OH)2 and EG-Ni(OH)2 by the thermal gravimetric-differential thermal analysis (TG-DTA) measurements and the thermal gravimetric-infrared (TG-IR) spectra to comprehensively elucidate the mechanism of the formation process from the Ni(OH)2 intermediates to NiO products. In an air atmosphere, the PEG/EG-Ni(OH)2 and EG-Ni(OH)2 intermediates show the exothermic peaks located at 326 and 301 °C, respectively (Fig. 3a). These obviously exothermic peaks were ascribed to the thermolysis during the formation of NiO from Ni(OH)2. Notably, the PEG/EG-Ni(OH)2 presents not only a higher thermal stability but a larger weight loss (54.6 wt%) compared with EG-Ni(OH)2 (46.1 wt%). It is believed that the NiO-MNS intermediate should release more small molecules than NiO-NS, which can produce more pores. Meanwhile, compared with the theoretical weights loss (29.7 wt%) derived from α-Ni(OH)2 (JCPDF: no. 38-0715) to NiO, both PEG/EG-Ni(OH)2 and EG-Ni(OH)2 exhibit large weight loss, demonstrating that the released small molecules are not just water steam from the hydroxide dehydration. Therefore, TG-IR spectra was employed to further analyze the gaseous decomposition during the calcination treatment (Fig. 3b). The IR spectra of gaseous decomposition are shown in the temperature region from 240 to 440 °C. As for both PEG/EG-Ni(OH)2 and EG-Ni(OH)2, the gaseous decomposition shows the strongest signal intensity at the exothermic peak temperature. To better study the components of gaseous decomposition, we selected the IR spectra derived from the exothermic peak temperatures for PEG/EG-Ni(OH)2 (326 °C) and EG-Ni(OH)2 (301 °C). As shown in Fig. 3c, a series characteristic bands of H2O (at 3400–4000 cm−1) and CO2 (at 2250–2360 cm−1) are observed in both of the two samples. Combined with the result of XRD, it indicates that the EG or PEG/EG is intercalated into the interlayered space in the Ni(OH)2 lattice. It is worth noting that the strong and obviously characteristic bands of CO at 2030–2240 cm−1 are detected in PEG/EG-Ni(OH)2, inferring that the generation of CO is produced from the residual PEG of PEG/EG-Ni(OH)2. During the calcination process of PEG/EG-Ni(OH)2, the decomposed H2O, CO2 and CO steams can act as pore forming agent to produce high specific surface area and large pore size. According to the literatures and our results, the feasible formation mechanisms of NiO-NS and NiO-MNS has been proposed in Fig. 3d. The spot of PEG not merely promotes to stabilize the nanospherical architectures, but also produces the mesoporous structure with the low-dimensional NiO blocks, which can provide large accessible surface area to accelerate the diffusion of the reactants and improve the electrochemical activity.
3.2 Electrochemical testing
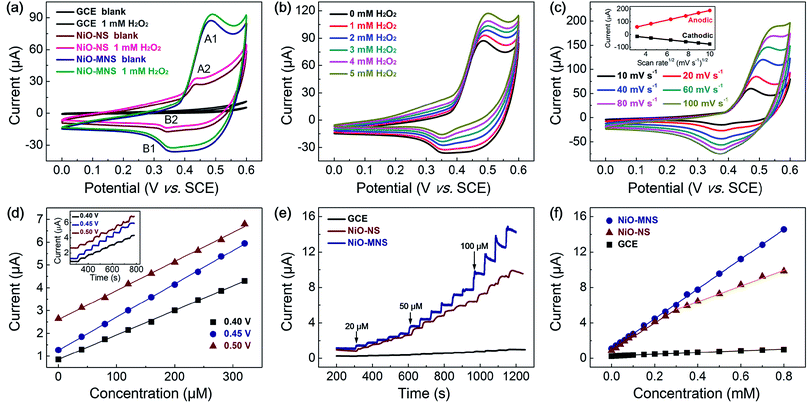
To evaluate the electrochemical activity of the resultant NiO-NS and NiO-MNS electrodes, cyclic voltammetric (CV) measurements were first performed to investigate the electrocatalytic oxidation of hydrogen peroxide (H2O2) in 0.1 M N2-saturated NaOH solution with and without 1 mM H2O2. As shown in Fig. 4a, both NiO-NS and NiO-MNS shows well-defined redox peaks (the reversible electron transfer of NiO/NiOOH(II/III), eqn (1)), but not for the bare GC electrode. The strong current responses with a clear oxidation peak (A1, A2; the oxidation from NiO to NiOOH) at about 0.45 V, and the reduction peaks (B1, B2; the reduction from NiOOH to NiO) at about 0.35 V. Owing to the larger surface area and more active sites, the NiO-MNS (A1, 0.47 V) exhibits a higher oxidation peak potential than the NiO-NS sample (A2, 0.43 V). More respected, the NiO-MNS electrode shows a much larger anodic and cathodic current response than NiO-NS, attributing to its own numerous active sites and large accessible reactive interface. When we added the H2O2 solution into the alkaline solution, the anodic current responses (from Ni(II)O to Ni(III)OOH) increased and the cathodic current responses (from Ni(III)OOH to Ni(II)O) decreased, indicating that the H2O2 is mainly catalytic oxidized by NiOOH, the oxidation of NiO/NiOOH redox state. In the anodic sweep, the oxidation of H2O2 and the reduction of NiOOH take place simultaneously (eqn (2)). Moreover, the increased NiO/NiOOH current responses (i.e., the decreased NiOOH/NiO current responses) follow with more concentrated H2O2 (Fig. 4b). With the increased concentration of H2O2, more NiO is further oxidized to NiOOH causing an increased anodic current; meanwhile, more NiOOH is reduced by H2O2, which decreases the cathodic current response. The result reconfirms that the H2O2 oxidation current can be catalyzed by the electron transfer of NiO/NiOOH(II/III) redox state. The electrochemical processes can be formulated as follows:| Ni(II)O + OH− ↔ Ni(III)OOH + e− | (1) |
| 2Ni(III)OOH + H2O2 → 2Ni(II)O + 2H2O + O2 | (2) |
Additionally, the anodic (or cathodic) current peaks only increase (or decrease) with minor voltage shift after H2O2 addition, demonstrating that the H2O2 oxidation reaction on the NiO-MNS surface is sustainable. The CV curves of NiO-MNS at various scan rates from 10 to 100 mV s−1 were also measured to further investigate the H2O2 sensing process (Fig. 4c). The current responses exhibit a pair of redox peaks at around 0.35–0.50 V with good symmetry, suggesting that the redox reaction of NiO-MNS is reversible. Moreover, the anodic and cathodic peak currents show linear relationship with the square root of the scan rate, revealing that the electron transfer of NiO/NiOOH(II/III) process on the surface of the NiO-MNS is diffusion controlled. Combined with the diffusion of H2O2 on the electrode surface, the porous structure and surface area will impose the restrictions of the adsorption of H2O2 on the active sites of the sensor surface. Hence the sensitive surface reaction and mesoporous structure promise NiO-MNS further to have a good application in a H2O2 electrochemical sensor.
Because the working potential of the electrochemical sensor is also one of the main detection conditions, the optimal working potential of NiO-MNS is explored by the chronoamperometric response with the step-by-step injection of 40 μM H2O2 at potentials of 0.40, 0.45 and 0.50 V (the inset in Fig. 4d). As shown in Fig. 4d, three good linear dependences of the typical chronoamperometric response of H2O2 oxidation current versus the H2O2 concentration were observed without obviously competitive reactions and noise background current. Compared with the working potential of 0.40 and 0.50 V, the sensitivity at 0.45 V is so high that the potential of 0.45 V is selected as the optimum working potential for the further detection of H2O2. We also optimize the working potential of NiO-NS, the optimal potential for chronoamperometric test of NiO-NS is also about 0.45 V (Fig. S5†). In addition, this result is consistent with the oxidation peak potential of NiO/NiOOH(II/III) derived from the CV measurements.
To better elaborate the merits of mesoporous structure in the NiO-MNS sensor, we evaluated the chronoamperometric responses by the injection of 20–800 μM H2O2 at potentials of 0.45 V also with the comparison of NiO-NS and bare GCE (Fig. 4e). All the electrode shows the current responses towards successive addition of H2O2. Upon the addition of H2O2, the steady-state current was obtained in less than 8 s for the NiO-MNS electrode, which is much faster than NiO-NS (13 s) and GCE (15.4 s). The corresponding calibration curves for H2O2 detection on the above three electrodes are shown in Fig. 4f. The bare GCE exhibits a rather low sensitivity (13.6 μA mM−1 cm−2) towards the H2O2 addition. Contrary to the linear dependences of NiO-MNS in the H2O2 concentration range of 20–800 μM, the NiO-NS presents two narrower linear concentration ranges (20–300 μM and 400–800 μM). Notably, despite the similar sensitivity of NiO-MNS and NiO-NS (236.7 and 218.4 μA mM−1 cm−2, respectively) at the low concentration range (20–300 μM), the NiO-MNS electrode maintains such high sensitivity in much wide concentration range (20–800 μM), but the NiO-NS only exhibits the much low sensitivity (124.7 μA mM−1 cm−2) in the high concentration range (400–800 μM). In addition, the limit of detection (LOD) is also calculated as 0.62 μM for NiO-MNS and 0.80 μM for NiO-NS (signal/noise = 3). These results demonstrate that the sensitivity depends on the intrinsic activity and directional electron transport, which is related with the species and conductivity of sensors, in the low concentration range; however, the facile diffusion of the electrolyte and reactant is a significant factor to accelerate the electrochemical response in the high concentration range. Hence, as for the NiO-MNS electrode, the nanoarchitectures constructed from the interconnected NiO blocks with the dominant mesoporous structure can offer numerous accessible active sites, facilitate both the electron and mass transport, and thereby enhance its electrochemical performance. We also summarized the sensing performances of typical non-enzymatic and non-precious metal electrochemical materials for H2O2 detection. The statistics reveals that the electrochemical sensing performance of the NiO-MNS electrode is comparable with the best reported transition metal oxides materials (Table 1).
| Electrode | Detection limit (μM) | Linear range (mM) | Sensitivity (μA mM−1 cm−2) | Reference |
|---|---|---|---|---|
| a CF: carbon foam; NW: nanowires; GS: graphite sheet; SPE: screen printed electrode. | ||||
| CuCo2S4 | 0.084 | — | 857.1 | 5 |
| Co3O4-NWs/CF | 1.4 | 0.01–1.4 | 230 | 6 |
| NiO nanosheets on GS | 0.4 | Up to 4 | 1077 | 18 |
| NiO-SPE | 3.22 | 0.011–2.4 | 807 | 3 |
| NiO/graphene | 0.7664 | 0.25–4.75 | 591 | 20 |
| Cu2O/CuO@rGO | 0.71 | 1.5 μM–11 mM | 431.65 | 34 |
| Heart/dumbbell-like CuO | 4 | Up to 0.9 | 136.92 | 35 |
| Grass-like CuO | 5.5 | Up to 0.9 | 137.17 | 35 |
| ITO/NiO | 5.2 | 0.01–0.87 | 41.36 | 36 |
| NiO/ITO | 1.28 mM | 0.01–1 | 1150 | 37 |
| Ni(II)-MOF/CNTs | 2.1 | 0.01–51.6 | 115.49 | 38 |
| Cubic Cu2O | 1.61 | 0.5–8.5 | 25 | 39 |
| NiO-MNS | 0.62 | 0.01–0.8 | 236.67 | This work |
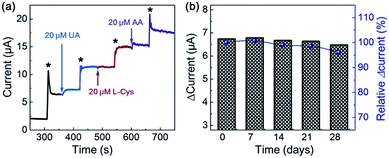
To obtain the reproducibility of NiO-MNS, five parallel sensors derived from NiO-MNS were tested by chronoamperometric measurement (Fig. S6 and S7†). The relative standard deviation (RSD) is only 4.35%. The selectivity of NiO-MNS to H2O2 was also investigated (Fig. 5a). The chronoamperometric responses of NiO-MNS to H2O2 is performed with the injection of some possible interfering species, including uric acid (UA), L(+)-cysteine (L-Cys) and ascorbic acid (AA). With the NiO-MNS electrode at 0.45 V, 20 μM additions of these interfering species do not exhibit apparent interferences to the detection of 200 μM H2O2, which indicates that the NiO-MNS sensor has a good selectivity for H2O2 detection and feasible application to determine H2O2 in real samples. In addition, the reproducibility of the NiO-MNS electrode was measured by the five successive CV results for four consecutive weeks (stored at 4 °C, Fig. 5b). The attenuation of normalized current is only 4.0%, indicating that the NiO-MNS sensor possesses remarkable reliability and stability for practical applications.
4. Conclusions
In summary, this work reports an effective solvothermal synthetic process with calcination at temperature of 300 °C to prepare NiO nanospheres which are constructed by the interconnected NiO blocks with the dominant mesoporous structure. Multiple characterizations are performed to confirm that the addition of PEG not merely promotes to construct the interconnected architectures, but also enhance the surface area with numerous mesopores. Thanks to the plentiful active sites and large accessible surface area, the NiO-MNS sensor presents the high sensitivity of 236.7 μA mM−1 cm−2, the wide linear concentration range of 20–800 μM, the low limit of detection of 0.62 μM, as well as the good selectivity and reliability. Therefore, the NiO-MNS electrode is promising to be the potential sensor for the practical and feasible application towards the H2O2 detection. Moreover, the unraveling mechanism of the mesopores formation derived from the in situ measurements also gives the significant guidance for the future design of porous materials for other electrochemical devices.Conflicts of interest
There are no conflicts to declare.Acknowledgements
This work was supported by the National Natural Science Funds of China (51432003, 51125007).References
- W. Chen, S. Cai, Q. Q. Ren, W. Wen and Y. D. Zhao, Analyst, 2012, 137, 49 RSC.
- M. Swieca, Food Chem., 2015, 180, 219 CrossRef CAS PubMed.
- P. Salazar, V. Rico and A. R. González-Elipe, Electrochim. Acta, 2017, 235, 534 CrossRef CAS.
- M. Li, H. Gao, X. Wang, Y. Wang, H. Qi and C. Zhang, Microchim. Acta, 2016, 184, 603 CrossRef.
- Z. Yang, S. Zhang, Y. Fu, X. Zheng and J. Zheng, Electrochim. Acta, 2017, 255, 23 CrossRef CAS.
- M. Liu, S. He and W. Chen, Nanoscale, 2014, 6, 11769–11776 RSC.
- A. A. Ensafi, H. A. Alinajafi, M. Jafari-Asl, B. Rezaei and F. Ghazaei, Mater. Sci. Eng., C, 2016, 60, 276 CrossRef CAS PubMed.
- T. Zhou, P. Lu, Z. Zhang, Q. Wang and A. Umar, Sens. Actuators, B, 2016, 235, 457 CrossRef CAS.
- M. Liu, R. Liu and W. Chen, Biosens. Bioelectron., 2013, 45, 206 CrossRef CAS PubMed.
- X. Wang, Q. Han, S. Cai, T. Wang, C. Qi, R. Yang and C. Wang, Analyst, 2017, 142, 2500 RSC.
- D. Chen, X. Zhuang, J. Zhai, Y. Zheng, H. Lu and L. Chen, Sens. Actuators, B, 2018, 255, 1500 CrossRef CAS.
- J. Agrisuelas, M.-I. González-Sánchez and E. Valero, Sens. Actuators, B, 2017, 249, 499 CrossRef CAS.
- J. Zhang, W. Gao, M. Dou, F. Wang, J. Liu, Z. Li and J. Ji, Analyst, 2015, 140, 1686 RSC.
- T. Zhou, W. Gao, Y. Gao, Q. Wang and A. Umar, RSC Adv., 2017, 7, 50087 RSC.
- S. Muralikrishna, S. Cheunkar, B. Lertanantawong, T. Ramakrishnappa, D. H. Nagaraju, W. Surareungchai, R. G. Balakrishna and K. R. Reddy, J. Electroanal. Chem., 2016, 776, 59 CrossRef CAS.
- Z. Yang, Q. Sheng, S. Zhang, X. Zheng and J. Zheng, Microchim. Acta, 2017, 184, 2219 CrossRef CAS.
- S. Kogularasu, M. Govindasamy, S. M. Chen, M. Akilarasan and V. Mani, Sens. Actuators, B, 2017, 253, 773 CrossRef CAS.
- W. Liu, H. Zhang, B. Yang, Z. Li, L. Lei and X. Zhang, J. Electroanal. Chem., 2015, 749, 62 CrossRef CAS.
- S. Ci, T. Huang, Z. Wen, S. Cui, S. Mao, D. A. Steeber and J. Chen, Biosens. Bioelectron., 2014, 54, 251 CrossRef CAS PubMed.
- Z. Yu, H. Li, X. Zhang, N. Liu and X. Zhang, Talanta, 2015, 144, 1 CrossRef CAS PubMed.
- Z.-X. Cai, H.-Y. Li, J.-C. Ding and X. Guo, Sens. Actuators, B, 2017, 246, 225 CrossRef CAS.
- J. Cao, S. Wang and H. Zhang, Mater. Lett., 2017, 202, 44 CrossRef CAS.
- Z. Yang, X. Zheng and J. Zheng, Sens. Actuators, B, 2017, 253, 34 CrossRef CAS.
- X. Zhang, G. Xu, Z. Chen, H. Cui, Z. Zhang and X. Zhan, Ceram. Int., 2017, 43, 4112 CrossRef CAS.
- M. Khairy and S. A. El-Safty, Sens. Actuators, B, 2014, 193, 644 CrossRef CAS.
- T. Zhu, J. S. Chen and X. W. Lou, J. Phys. Chem. C, 2012, 116, 6873 CAS.
- A. K. Mondal, D. Su, Y. Wang, S. Chen, Q. Liu and G. Wang, J. Alloys Compd., 2014, 582, 522 CrossRef CAS.
- N. D. Hoa and S. A. El-Safty, Chem.–Eur. J., 2011, 17, 12896 CrossRef CAS PubMed.
- X. San, G. Zhao, G. Wang, Y. Shen, D. Meng, Y. Zhang and F. Meng, RSC Adv., 2017, 7, 3540 RSC.
- C. Ray, S. Dutta, S. Sarkar, R. Sahoo, A. Roy and T. Pal, J. Mater. Chem. B, 2014, 2, 6097 RSC.
- Z. Zhang, Y. Qin, M. Dou, J. Ji and F. Wang, Nano Energy, 2016, 30, 426 CrossRef CAS.
- L. Wang, X. Jiao, P. Liu, Y. Ouyang, X. Xia, W. Lei and Q. Hao, Appl. Surf. Sci., 2018, 427, 174 CrossRef CAS.
- M. Zhou, H. Chai, D. Jia and W. Zhou, New J. Chem., 2014, 38, 2320 RSC.
- D. Wu, Z. Xu, T. Zhang, Y. Shao, P. Xi, H. Li and C. Xu, RSC Adv., 2016, 6, 103116 RSC.
- P. Gao and D. Liu, Sens. Actuators, B, 2015, 208, 346 CrossRef CAS.
- S. Jana, G. Mondal, B. C. Mitra, P. Bera, B. Chakraborty, A. Mondal and A. Ghosh, New J. Chem., 2017, 41, 14985 RSC.
- S. Jana, S. Samai, B. C. Mitra, P. Bera and A. Mondal, Dalton Trans., 2014, 43, 13096 RSC.
- M.-Q. Wang, Y. Zhang, S.-J. Bao, Y.-N. Yu and C. Ye, Electrochim. Acta, 2016, 190, 365 CrossRef CAS.
- Y. Li, Y. Zhong, Y. Zhang, W. Weng and S. Li, Sens. Actuators, B, 2015, 206, 735 CrossRef CAS.
Footnote |
| † Electronic supplementary information (ESI) available: Details of the electrochemical calculations, physical characterization and additional data. See DOI: 10.1039/c8ra01313f |
| This journal is © The Royal Society of Chemistry 2018 |

