 Open Access Article
Opal promotes hydrothermal carbonization of hydroxypropyl methyl cellulose and formation of carbon nanospheres
Yuanjun Xu,
Maosheng Xia,
Yinshan Jiang,
Fangfei Li and
Bing Xue *
*
Key Laboratory of Automobile Materials, Ministry of Education, Department of Materials Science and Engineering, Jilin University, No. 5988 People's Avenue, Changchun 130025, People's Republic of China. E-mail: xuebing2011@jlu.edu.cn; Fax: +86-0431-85094856; Tel: +86-0431-85094856
First published on 4th June 2018
Abstract
Hydrothermal carbon nanospheres were prepared by introducing opal into the hydrothermal carbonization system of hydroxypropyl methyl cellulose (HPMC). Then the effects of opal on hydrothermal carbonization of HPMC were investigated after different reaction durations (105–240 min). The reaction products were characterized by elemental analysis, gas chromatography-mass spectrometry (GC-MS), scanning electron microscopy (SEM), energy dispersive X-ray spectroscopy (EDS), Fourier transform infrared spectroscopy (FT-IR) and N2 adsorption–desorption. Results of elemental analysis indicated that the H (hydrogen) and O (oxygen) content of HPMC decreased through dehydration, demethylation, decarbonylation and hydrolysis reactions, forming hydrochar with higher carbon content. The addition of opal was confirmed to accelerate the hydrolysis of HPMC. N2 adsorption–desorption tests and SEM analysis showed that opal with a large specific surface area adsorbed HPMC hydrolysis products, such as furans, and facilitated furan cyclodehydration on its surfaces to form cross-linked carbons, which contributed to the quick formation of hydrochar. Moreover, the adsorption by opal also inhibited hydrochar aggregation, so the final hydrothermal carbon spheres had sizes of 20–100 nm.
Introduction
Biomass has attracted growing attention as a significant renewable resource. Hydrothermal processes, which are environmental-friendly, can reduce environmental pollution and greenhouse gas emissions, which makes biomass hydrothermal carbonization (HTC) increasingly important.1–6 HTC of biomass is a conversion under a closed, mild and autogenous pressure system.7,8 At 200–280 °C, the water which is similar to mild acid and mild base at the same time in the hydrothermal system can accelerate biomass degradation.9,10 HTC of biomass is accompanied by hydrolysis, dehydration, decarboxylation, aromatization, polycondensation and polymerization.11,12 During HTC, the biomass is converted into liquid biofuels and carbon nanospheres with rich functional groups. These products are widely applied to soil augmentation, environmental remediation, novel carbon-based anode materials of Li-ion batteries, ion exchange resins, adsorbing materials, and catalysts.6,13–17The use of an additive would modestly affect the biomass conversion during HTC. For instance, some researchers identified that the addition of H2SO4 and acetic acid into a lignocellulose biomass HTC system could accelerate the hydrolysis and cleavage of lignocellulose.18,19 Addition of inorganic salts (e.g. CaCl2, LiCl, MgCl2) into lignocellulose could reduce hydrothermal vapor, catalyze biomass degradation, and increase the higher heat value (HHV) and energy density of products.18,20,21 Furthermore, researchers paid more attention to how types of minerals would affect the HTC of biomass. In recent years, more and more attentions have been paid to high-temperature pyrolysis improved by addition of minerals into biomass (cellulose) systems. As reported, the presence of minerals promotes biomass (cellulose) degradation, accelerates primary and secondary cellulose decompositions, and promotes the formation of numerous small-molecule substances.21,22 Meanwhile, the minerals contained in biomass components also lower the decomposition temperature of biomass (lignin, nutshell), increase gas production rates and decrease char production.21,22 There are many examples in nature that minerals affect biomass conversion. Through HTC experiments, Wu et al. confirmed the montmorillonite in biomass could catalyze the cellulose conversion into oil-prone kerogen products.23 Regarding geological effects, this is an important reaction for fossil fuel formation and accumulation. However, the mechanisms how newly-added minerals affect biomass and yield rate of solid product with HTC time have not been profoundly studied. Thus, relevant research is needed to further understand the special roles of minerals in HTC and optimize synthesis parameters of the formation of biomass carbon. Such researches provided references for the wide application of biomass carbon.
In this work, volcanic opal shale was selected as the amorphous SiO2 additive. Then the effects of minerals on biomass along with the HTC of hydroxypropyl methyl cellulose (HPMC) were investigated. The HTC system was studied through element analysis, GC-MS, SEM, EDS, FT-IR and N2 adsorption–desorption tests. The specific research contents were listed as follows (1) production yields of hydrochar and element distributions of residual solid products; (2) effects of opal on morphology and structures of products; (3) effects of opal on composition of filtrates; (4) mechanism of residual solid product formation.
Experimental
Materials
HPMC (analytical reagent) was purchased from Yanxing Industrial Co., Ltd. Opal came from Nenjiang watershed, north of Inner Mongolia, China, and it was composed of 90.24% SiO2, 3.66% Al2O3, 0.33% MgO, 0.83% TFe2O3, 0.56% K2O, 0.30% CaO, 0.10% TiO2, 0.30% P2O5 and 0.21% Na2O. Opal was dried and passed through a 100-mesh square-hole sieve before the HTC experiment.HTC
HTC experiments were carried out in 100 mL static stainless steel Teflon-lined autoclave reactor. In mineral-free experiments (HPMC system), each reactor was added with 3 g of HPMC and 30 mL of deionized water under stirring, and then heated in a DGG-9070B electric constant temperature drying oven (Shanghai Sende Laboratory Instrument Co., Ltd.) at 230 °C. The reactors were taken out one-by-one at certain interval, cooled to room temperature, and vacuum-filtrated. The residual solid products were dried at 80 °C for 24 h until reaching constant weight and the filtrate was reserved for analysis. In the mineral-added experiments (HPMC/opal system), the procedures were the same except for the addition of 0.9 g of opal in the reactor. The sampling time was 105, 120, 150, 180 and 240 min, respectively. The residual solid products of HPMC systems were named as H-X, where X represented the sampling time. The residual solid products of HPMC/opal systems were named as HMC-X. For instance, HMC-150 represented the product from the HPMC/opal system after 150 min of reaction.Demineralization
The presence of opal in HMC-X would affect the analytical accuracy of HTC products (hydrochar), so the opal in HMC-X should be removed before analysis. Hence, the HCl/HF mixed acid dissolution method was used, which contained a 3 mol L−1 HCl solution and a 4.45 mol L−1 HF (10 wt%) solution mixed at the volumetric ratio of 1![[thin space (1/6-em)]](https://www.rsc.org/images/entities/char_2009.gif) :
:![[thin space (1/6-em)]](https://www.rsc.org/images/entities/char_2009.gif) 2. Each time 0.3 g of HMC-X was added into 30 mL of the mixed acid solution under magnetic stirring for 8 h, followed by centrifugation. The centrifugal products were washed with deionized water several times until reaching pH = 7, and then dried at 80 °C until reaching constant weight. At this moment, the demineralized product was named D-X. H-X was also conducted by the same demineralization treatment, in order to analyze the influence of strong acid on H-X. The demineralized product of H-X was named as A-X.
2. Each time 0.3 g of HMC-X was added into 30 mL of the mixed acid solution under magnetic stirring for 8 h, followed by centrifugation. The centrifugal products were washed with deionized water several times until reaching pH = 7, and then dried at 80 °C until reaching constant weight. At this moment, the demineralized product was named D-X. H-X was also conducted by the same demineralization treatment, in order to analyze the influence of strong acid on H-X. The demineralized product of H-X was named as A-X.
Characterization
FT-IR spectra were performed on a Nexus 670 spectroscope (USA) at 400–4000 cm−1 and with KBr. To compare the functional group strengths, 0.5 mg of solid product and 200 mg of KBr were used for quantitative analysis. The surface morphologies of raw materials and residual solid products (sampled at 105, 150, 240 min) were characterized on an XL-30 environmental SEM instrument (FEI company, USA). Energy dispersive X-ray spectrometer (EDS) detector (X-MAX, OXFORD instruments, England) combined with XL-30 environmental SEM was used to analyze HMC-240. Specific surface areas were measured by the multipoint Brunauer–Emmett–Teller (BET) method. The volumes/diameters of micropores and mesopores were detected by the Barrett–Joyner–Halenda (BJH) method. The specific surface area and pore size instrument was bought from Beijing JWGB SCI & Tech Co. Ltd. (JW-BK222). Hydrothermal liquids were detected by a QP2010SE GC-MS meter (Shimadzu, Japan). Elements of raw materials and solid residues were analyzed on a CHN element analyzer (Vario EL cube, CHN, Germany). Mainly D-X and H-X were tested.Results and discussion
Hydrochar production yields
The hydrochar production yields of H-X and D-X were calculated as follows:
 | (1) |
 | (2) |
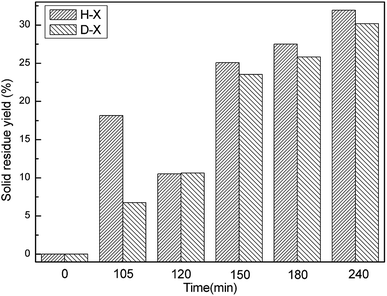
Fig. 1 displays the hydrochar production yields of H-X or D-X after different reaction durations (defined no hydrochar production formed at 0 min). Clearly, the production yields from H-X first decrease and then increase with time, while the production rates of D-X increase all the time. The HTC of HPMC mainly consists of two stages. The first procedure includes organic matter dehydration, dehydroxylation, the hydrolysis of HPMC into small molecules and HPMC solubilization;8,12 the weight of the resulting residual solid products gradually decreases. The second procedure is the repolymerization of small molecules in solution into hydrochar.24 For H-X, the first procedure does not end after 105 min, so the weight of resulting residual solid products gradually decreases with the prolonging of time. The increase in the weight of residual solid products after 120 min indicates the second procedure already has started, so the weight of resulting hydrochar increases with time. For D-X, the weight of solid products always rises from 105 to 240 min; analysis of D-105 suggests the first procedure may be almost finished and the second one has gradually started after 105 min. It is also indicated the presence of opal could accelerate the first procedure and facilitate the dissolution of HPMC in water. Meanwhile, the H-120 and D-120 both transform into hydrochar at 120 min.
Element analysis of hydrochar
Table 1 shows the element composition (C, H, N, O) and atomic ratios (H/C, O/C) of HPMC, D-X and H-X. The carbon contents increase from 46.05% in HPMC to 70.77% in H-X (H-240) and to 69.91% in D-X (D-240). Meanwhile, the O and H contents in the residual solid products are both significantly smaller. The atomic H/C and O/C ratios, which are 1.83 and 0.76 in HPMC respectively, decrease to 0.76 and 0.26 in H-X, respectively. And the H/C and O/C atomic ratios of D-X decrease from 1.83 to 0.76 and 0.74 to 0.28 respectively (Table 1). Above results indicate these changes are similar between H-X and D-X at last. These results suggest that the polycondensation of hydrochar and the carbonization are both gradually intensified with time. However, the element composition and atomic ratios (H/C, O/C) of D-105 is different from H-105, indicating the formation of hydrochar is accelerated under the effect of opal.| Samples | C (wt%) | H (wt%) | N (wt%) | O (wt%) | H/C | O/C |
|---|---|---|---|---|---|---|
| HPMC | 46.05 | 7.04 | 0.00 | 46.91 | 1.83 | 0.76 |
| H-105 min | 50.64 | 7.62 | 0.00 | 41.74 | 1.80 | 0.62 |
| D-105 min | 58.85 | 6.23 | 0.00 | 34.92 | 1.27 | 0.45 |
| H-120 min | 66.53 | 5.07 | 0.00 | 28.40 | 0.91 | 0.32 |
| D-120 min | 65.28 | 4.83 | 0.00 | 29.89 | 0.89 | 0.34 |
| H-150 min | 69.92 | 4.65 | 0.00 | 25.43 | 0.80 | 0.27 |
| D-150 min | 68.52 | 4.58 | 0.00 | 26.90 | 0.80 | 0.29 |
| H-180 min | 71.15 | 4.58 | 0.00 | 24.27 | 0.77 | 0.26 |
| D-180 min | 68.52 | 4.58 | 0.00 | 26.90 | 0.80 | 0.29 |
| H-240 min | 70.77 | 4.50 | 0.00 | 24.73 | 0.76 | 0.26 |
| D-240 min | 69.91 | 4.30 | 0.00 | 25.79 | 0.74 | 0.28 |
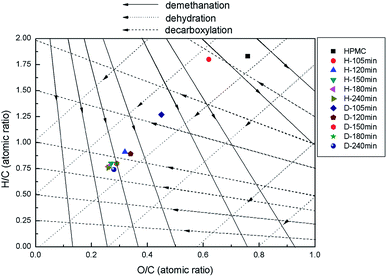
The evolutions of H/C and O/C atomic ratios can be illustrated by the representative reaction pathways in the Van Krevelen diagram (Fig. 2). Samples correspond to different state points on the figure based on the atomic H/C and O/C ratios, so when the positions of state points are changed due to the alteration of preparation conditions, the migration of arrowhead at a specific direction indicates the occurrence of corresponding reaction of dehydration, demethylation or decarbonylation.12,25 With the reaction time from 105 to 120 min, the H/C and O/C ratios of H-X rapidly decrease (Fig. 2). The state point of H-105 migrates largely along the dehydration line to the state point of H-120, but almost do not change at the demethylation or decarbonylation line, indicating HPMC is fast dehydrated during this period and demethylation or decarbonylation nearly do not occur. The changes of D-X and H-X are almost the same, as they are all fast dehydrated.12 With the prolonging of time, the H/C and O/C ratios decrease slowly until reaching a balance for both H-X and D-X, and the migrating distances of the corresponding state points are gradually shortened, indicating demethylation and decarbonylation reactions are ignorable at this moment. However, the dehydration rate of D-105 is faster than H-105. In predecessors' research, methylisobutylketone (MIBK) was used to extract hydroxymethyl furfural (HMF) immediately, thus promoting the dehydration reaction by shifting the equilibrium towards the formation of HMF.26 Because of the better absorption ability of opal, opal can also be introduced to adsorb the soluble production, therefore accelerating the dehydration reaction by shifting the equilibrium to the dehydrated production.
In this paper, it has been found that the reaction pathways are occurred at the earlier period of HTC process. The research of Xiaowei Lu et al.8 demonstrates that reaction temperature is the major parameter to influence the transformation of cellulose, while the long duration time only has delicate impact on reaction pathways of hydrothermal carbonization of cellulose such as dehydration and decarbonylation. The phenomenon has also been found by the study of Chao He et al.1 These results indicate that the reaction pathways of biomass mainly happen in the early stage of HTC process.
FT-IR analysis of hydrothermal carbonized products
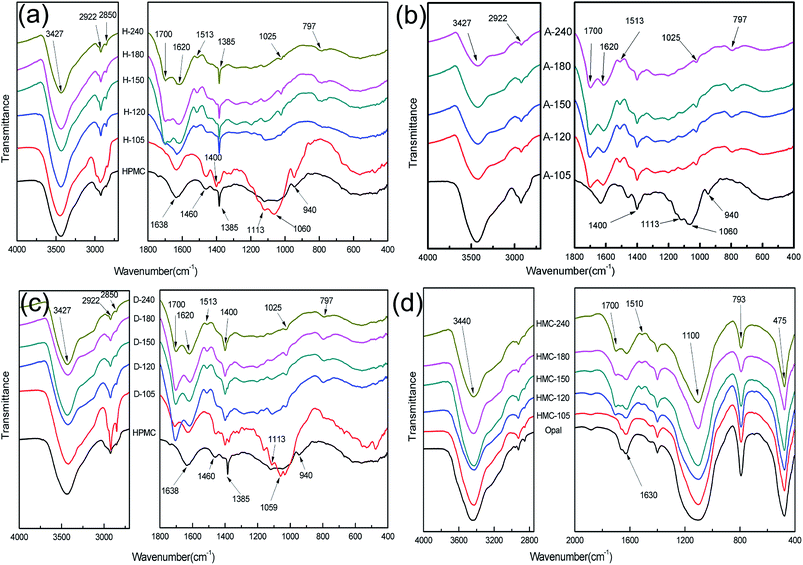
Fig. 3 displays the FT-IR spectra of hydrochar. The FT-IR spectra of HPMC show peaks at 3427, 2922, 2850 cm−1 (stretching vibrations of –OH, –CH2, –CH3, respectively); 1638 cm−1 (adsorbed water from environment); 1480 cm−1 (stretching vibration of C![[double bond, length as m-dash]](https://www.rsc.org/images/entities/char_e001.gif) O stands for carbonyl groups in HPMC); 1385, 940 cm−1 (characteristic of –CH).1,3,27,28 With the proceeding of reaction, the FT-IR spectra of H-X are gradually changed in Fig. 3a. The FT-IR spectral lines of H-105 has a little different with HPMC such as the increasement of peak intensity at 1060 cm−1 (C–O stretching vibration) and the shift of –CH from 1385 cm−1 (HPMC) to 1400 cm−1 (H-105), indicating the structure of HPMC has started to transform, the HPMC has been converted into hydrochar after 105 min of reaction. The FT-IR spectra of H-120 show new peaks at 1700 cm−1 (stretching vibration of C
O stands for carbonyl groups in HPMC); 1385, 940 cm−1 (characteristic of –CH).1,3,27,28 With the proceeding of reaction, the FT-IR spectra of H-X are gradually changed in Fig. 3a. The FT-IR spectral lines of H-105 has a little different with HPMC such as the increasement of peak intensity at 1060 cm−1 (C–O stretching vibration) and the shift of –CH from 1385 cm−1 (HPMC) to 1400 cm−1 (H-105), indicating the structure of HPMC has started to transform, the HPMC has been converted into hydrochar after 105 min of reaction. The FT-IR spectra of H-120 show new peaks at 1700 cm−1 (stretching vibration of C![[double bond, length as m-dash]](https://www.rsc.org/images/entities/char_e001.gif) O); 1620, 1513 cm−1 (stretching vibration of C
O); 1620, 1513 cm−1 (stretching vibration of C![[double bond, length as m-dash]](https://www.rsc.org/images/entities/char_e001.gif) C); 797 cm−1 (C–H out-of-plane bending vibrations in aromatic chemicals).12,25,28 Along with the prolonging of time, the three vibration peaks become increasingly more evident in H-150, H-180 and H-240. These results suggest dehydration of HPMC has occurred to form carbonyl and carboxyl groups after 120 min of reaction, which confirms the generation of hydrochar. Fig. 3b shows the FT-IR spectra of A-H. There is no difference between the FT-IR spectra of A-H with H-X, indicating slight influence on the H-X by demineralization treatment. The FT-IR spectra in Fig. 3c are not largely different between D-X and H-X, but the vibration peaks characteristic of hydrochar at 1700, 1513 and 797 cm−1 already appear after 105 min in D-X. This result indicates the formation of hydrochar is earlier than that in the opal-free systems, indicating the presence of opal could accelerate the dehydration of HPMC and thereby promote the formation of hydrochar. Fig. 3d shows the peaks of opal shale at 3440, 1630 cm−1 (stretching vibration and bending vibration of –OH, respectively), 1100 cm−1 (asymmetric stretching vibration of Si–O–Si), 793 cm−1 (stretching vibration of Si–OH) and 475 cm−1 (bending vibration of Si–O–Si).27,29–32 Peaks at 1700 cm−1 (stretching vibration of C
C); 797 cm−1 (C–H out-of-plane bending vibrations in aromatic chemicals).12,25,28 Along with the prolonging of time, the three vibration peaks become increasingly more evident in H-150, H-180 and H-240. These results suggest dehydration of HPMC has occurred to form carbonyl and carboxyl groups after 120 min of reaction, which confirms the generation of hydrochar. Fig. 3b shows the FT-IR spectra of A-H. There is no difference between the FT-IR spectra of A-H with H-X, indicating slight influence on the H-X by demineralization treatment. The FT-IR spectra in Fig. 3c are not largely different between D-X and H-X, but the vibration peaks characteristic of hydrochar at 1700, 1513 and 797 cm−1 already appear after 105 min in D-X. This result indicates the formation of hydrochar is earlier than that in the opal-free systems, indicating the presence of opal could accelerate the dehydration of HPMC and thereby promote the formation of hydrochar. Fig. 3d shows the peaks of opal shale at 3440, 1630 cm−1 (stretching vibration and bending vibration of –OH, respectively), 1100 cm−1 (asymmetric stretching vibration of Si–O–Si), 793 cm−1 (stretching vibration of Si–OH) and 475 cm−1 (bending vibration of Si–O–Si).27,29–32 Peaks at 1700 cm−1 (stretching vibration of C![[double bond, length as m-dash]](https://www.rsc.org/images/entities/char_e001.gif) O) and 1513 cm−1 (stretching vibration of C
O) and 1513 cm−1 (stretching vibration of C![[double bond, length as m-dash]](https://www.rsc.org/images/entities/char_e001.gif) C) also present in Fig. 3d. These phenomena suggest that hydrochar and opal may couple with each other.31–34
C) also present in Fig. 3d. These phenomena suggest that hydrochar and opal may couple with each other.31–34
Morphology and EDS analysis of HTC products
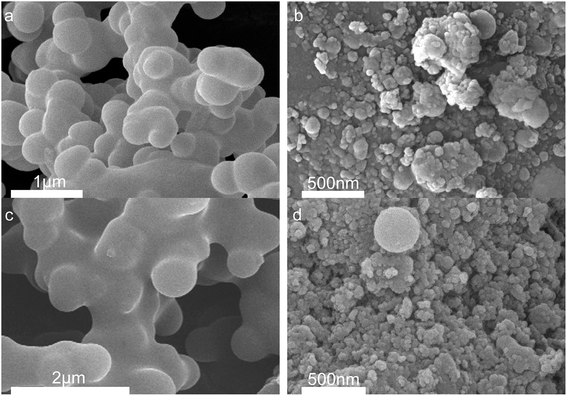
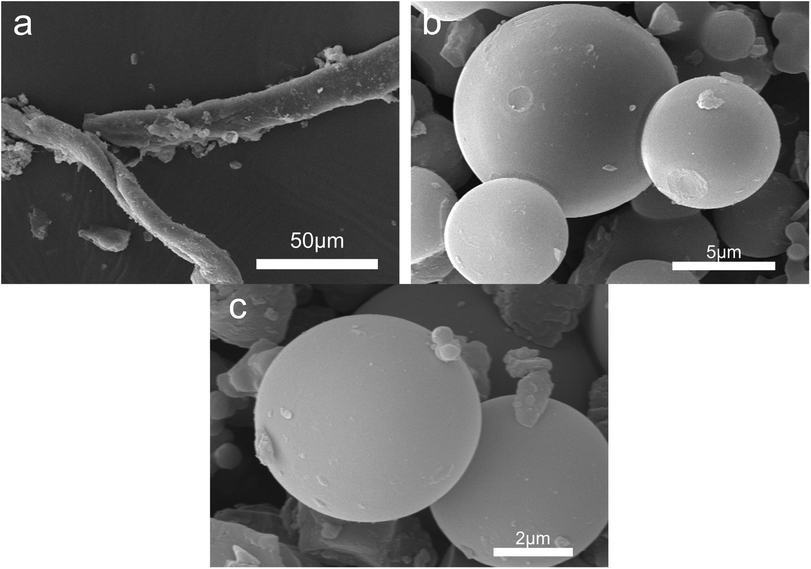
Fig. 4 shows the morphology of solid products at different time points. SEM shows that opal exists as a villous cluster shape (Fig. 4a), which can be magnified to be a structure consisting of numerous irregular layers. This unique structure endows opal with very low density and large specific surface area. In comparison, HPMC exists as a porous micellar structure composed of fiber-like substances (Fig. 4b).3,25 The morphology of HPMC after HTC has considerably changed. After treatment at 230 °C for 105 min, the “porous micelles” has already merged together (Fig. 4c), which reduces the porosity of HPMC. Under same conditions, the addition of opal leads to the complete disappearance of porous micelles from HPMC, and instead fine particles have been formed on surfaces of opal (Fig. 4d).35 At 150 min, numerous spherical substances (which have also been identified as hydrochar by element analysis and FT-IR) become more evident in the HPMC systems (Fig. 4e and 5a). These hydrothermal carbon spheres are non-uniform in sizes, as the large spheres are 5–10 μm with smooth surfaces; while the small spheres are 0.4–0.7 μm with irregular appearance and have adhered at edges.36 At 240 min, the large spheres become slightly larger in sizes and smoother on surfaces, and tend to be homogeneous (Fig. 4g and 5c). These changes are similar to the hydrochar converted from glucose, fructose or sucrose.11,37,38 In the HPMC/opal systems, the morphology of products has changed significantly. At 150 min, spherical hydrochar, but very little and small (<1 μm), is also found in the products, but more particles (20–100 nm) are adsorbed onto opal surfaces (Fig. 4f and 5b), which are largely different from the HPMC systems. At 240 min, in addition to the small spheres (<1 μm), large spheres (5–10 μm) also appear, while the bulk density of particles on opal surfaces increases, but with smaller particle size (Fig. 4h and 5d). These results indicate the presence of opal significantly inhibits the growth of hydrothermal carbon spheres and restricts the ball sizes at the nanoscale. The formation of hydrochar involves the hydrolysis of HPMC and the repolymerization of hydrolysates. As for hydrochar production rates, the presence of opal considerably facilitates the hydrolysis of HPMC, and the larger specific surface area contributes to the adsorption of hydrolysis products from the liquid phase and accelerates the sedimentation of polymer products.4,23 Moreover, the interaction between surface silicon hydroxyl and hydrolysis products or hydrochar would restrict the sizes of hydrochar and facilitate the binding between hydrochar and opal.31–33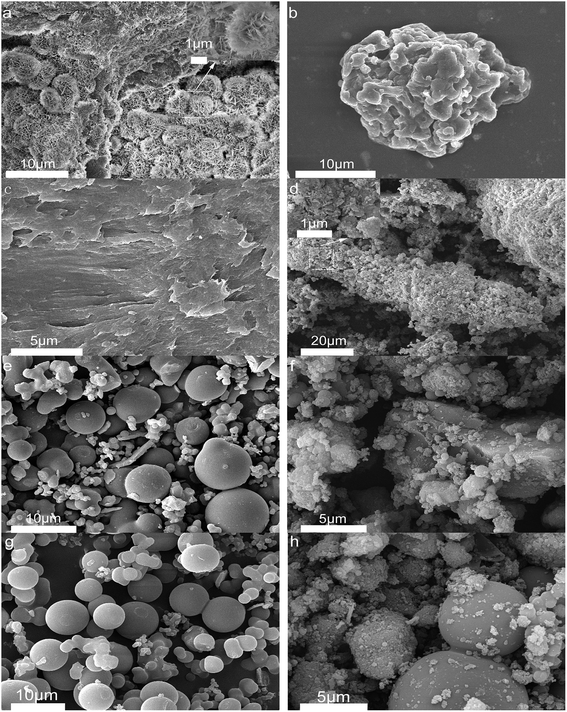 | ||
| Fig. 4 SEM images (a) raw opal; (b) HPMC; (c) H-105; (d) HMC-105; (e) H-150; (f) HMC-150; (g) H-240 and (h) HMC-240. | ||
In order to analyze the impact of the demineralization treatment on the morphology of hydrochar, the SEM analysis of A-H was tested. Fig. 6 demonstrates the morphology of A-H at different time points. The morphology of A-105 retained fiber-like state (Fig. 2(a)). Fig. 2(b) shows the diameter of the spheres is in the range of 5–10 μm and the surface of the spheres is quite smooth. The A-240 sample has the same morphology as A-150, and the diameter of spheres is in the range of 5–8 μm. These results suggest that demineralization treatment of H-X has a certain effect on the morphology of A-105, resulting in the appearance of fiber-like morphology due to no hydrochar formed by HTC of HPMC at 105 min. However, demineralization treatment has delicate influence on the morphology of H-150 and H-240 when the hydrochar has formed.
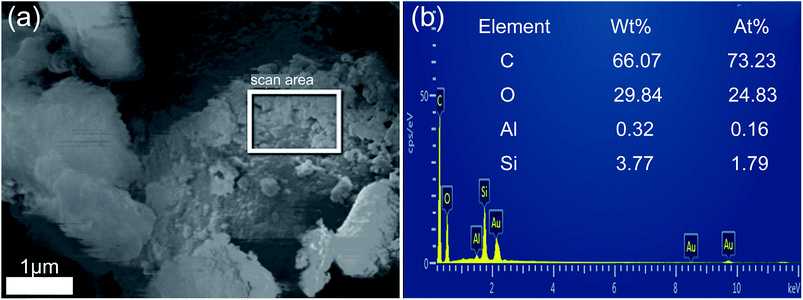
To further confirm the combination between hydrochar and opal, the EDS analysis of HMC-240 was tested. The SEM and relevant EDS pattern of HMC-240 are shown in Fig. 7. Color mapping was performed to visualize the spatial distribution of silicon (Si), carbon (C) and oxygen (O) of HMC-240 (Fig. 7b). Silicon, carbon and oxygen are colored respectively as violet, red and green. The EDS image, and mass ratio and atomic ratio of each element are shown in Fig. 7c. The carbon content (53.33%) is much higher than silicon content (10.79%). The high-carbon content property of sample indicates the hydrochar has been formed. From Fig. 7b, the silicon (Si), carbon (C) and oxygen (O) are interlaced with each other. This phenomenon suggests the hydrochar has successfully adsorbed onto the surface of opal. Meanwhile, the appearance of red accumulation area shows the enrichment of hydrochar in opal surface. In addition, Fig. 8b shows the EDS analysis results of some spheroidal particles in white box in Fig. 8a. The carbon content (66.07%) is higher than other regions; that indicates the some spheroidal particles are just the hydrochar in opal surface. This EDS result is consistent with SEM analysis in Fig. 4 and 5.
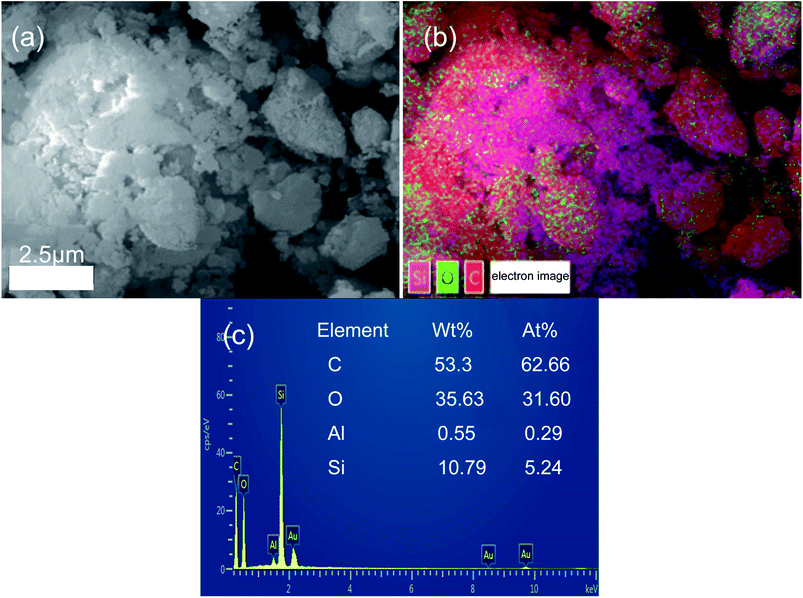 | ||
| Fig. 7 SEM-EDS analysis of HMC-240 (a) SEM of HMC-240; (b) overall scanning and elements mapping of HMC-240; (c) EDS spectra of HMC-240. | ||
N2 adsorption–desorption analysis of solid products
Table 2 shows the specific surface area, average pore sizes, and average pore volumes of both raw materials and residual solid products. Clearly, the average pore volume and average pore size of HPMC is 0.003 cm3 g−1, and 11.824 nm respectively. The three parameters of H-120 slightly increase to 0.022 cm3 g−1 and 19.372 nm, respectively, but all start to decrease with further prolonging of reaction. The specific surface area values of H-X series are very low in all cases (<5 m2 g−1). The three parameters of opal are 80 m2 g−1, 0.223 cm3 g−1 and 11.227 nm, respectively; after physical mixing with HPMC, the specific surface area and average pore volume significantly decrease to 15 m2 g−1 and 0.052 cm3 g−1, respectively, indicating HPMC has been already partially adsorbed onto opal surfaces to block the pores of a part of opal, leading to the decline of specific surface area and pore volume.31,32 The effects of reaction time on the specific surface area and average pore volume of products in HPMC/opal systems are consistent with those of HPMC systems, and tend to “first increase and then decrease”. These changes are decided by the characteristics of hydrolysis of HPMC and hydrochar production. At the first procedure of HTC, the molecular chains of HPMC are hydrolyzed and broken into small molecules like oligosaccharide, and the reduction in the concentrations of volatile small molecules and HPMC volatile matter would enlarge specific surface area of solid products.3,8 After 120 min of reaction, the decrease in specific surface area of solid products is attributed to the gradual formation of hydrochar and the aggregation-induced intense solid products.| Characterization | 0 min | 105 min | 120 min | 150 min | 180 min | 240 min | |
|---|---|---|---|---|---|---|---|
| a Opal: specific surface area 80 m2 g−1, pore volume 0.223 cm3 g−1, pore size 11.227 nm; specific surface areas of H-X < 5 m2 g−1. | |||||||
| Specific surface area (m2 g−1) | HMC-X | 15 | 27 | 32 | 30 | 27 | 28 |
| Pore volume (cm3 g−1) | H-X | 0.003 | 0.008 | 0.022 | 0.013 | 0.013 | 0.013 |
| HMC-X | 0.052 | 0.111 | 0.126 | 0.108 | 0.098 | 0.100 | |
| Pore size (nm) | H-X | 11.824 | 17.117 | 19.372 | 13.535 | 16.057 | 15.236 |
| HMC-X | 13.487 | 15.551 | 14.613 | 14.439 | 14.595 | 13.499 | |
Fig. 9 shows the N2 adsorption–desorption isotherms and corresponding pore size distributions of H-X and HMC-X. The N2 adsorption–desorption isotherms of HPMC is a typical type II isothermal curve without a hysteresis loop, and with the proceeding of reaction, the isothermal curve of H-X does not change significantly (Fig. 9a), indicating the reaction time very slightly affects the formation of mesoporous structure of hydrochar. Moreover, the typical IV isothermal curves of opal and HMC-X contain an H3 hysteresis loop (Fig. 9b), indicating the thin-layered wedgy pore channels of HMC-X contain loose particles. The narrower hysteresis loop suggests a part of hydrochar entered the pores of opal and has been adsorbed onto opal. The BJH pore size curves show the pore sizes of HPMC, H-105, H-120, H-150, H-180 and H-240 are 3.9, 3.6, 3.2, 3.2, 3.5 and 3.7 nm, respectively (Fig. 9c). Pore size analysis of HMC-X shows the pore size of opal is about 3.7 nm, but the HMC-105, HMC-120, HMC-150, HMC-180 and HMC-240 all show double peaks, corresponding to pore sizes of ∼2.5 and 9 nm, respectively (Fig. 9d). With the proceeding of reaction, the pore sizes of H-X first decrease and then increase. With the presence of opal, the appearance of double peaks in HMC-X might be attributed to the binding between opal and hydrochar during reactions.
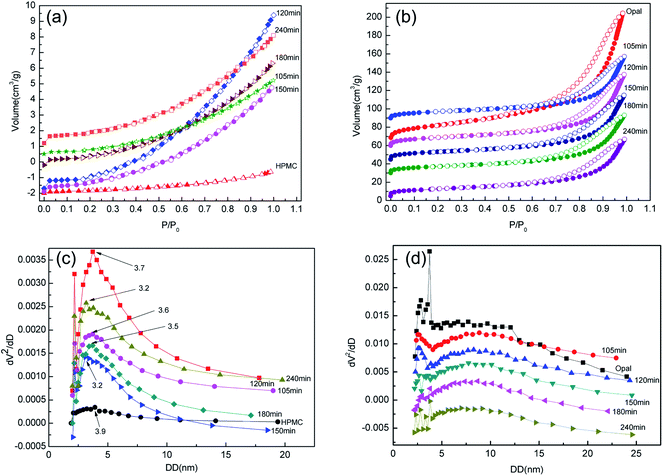 | ||
| Fig. 9 (a) N2 adsorption–desorption isotherms of H-X; (b) N2 adsorption–desorption isotherms of HMC-X; (c) pore size distrubution of H-X and (d) pore size distrubution of HMC-X. | ||
Composition and pH of HTC filtrates
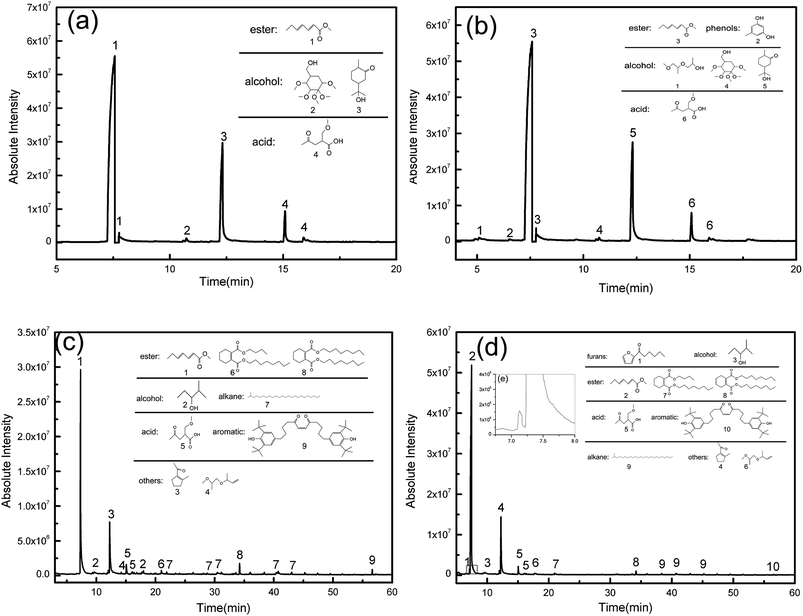
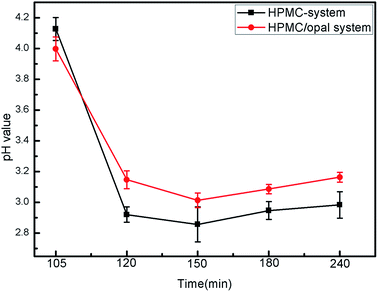
The effects of opal on HPMC hydrolysis were investigated by analyzing the liquid-phase composition after HTC using GC-MS in Fig. 10. After 120 min of HTC in the HPMC system, the resulting filtrate composed of acidic substances, alcohols and esters (the structure of detected substances shows in Fig. 10a). After 120 min of reaction in the HPMC/opal system, the filtrate is also detected with orcinol and 2-propanol, 1-(2-(2-methoxy-1-methylethoxy)-1-methylethoxy), in addition to the components found in the HPMC systems (Fig. 10b). Since orcinol has a phenolic structure, its formation might be due to the opal-promoted cyclic condensation of hydrolysis products. Moreover, due to differences of raw materials and experimental parameters, no formic acid, acetic acid, levulinic acid or glucose are detected in the HPMC system as reported before.4,12,25,39 After 180 min of reaction, the components detected in the HPMC system and HPMC/opal system are very similar, including ester, acidic substances, alkanes, alcohols, aromatic substances and other substances (Fig. 10c and d). The presence of aromatic substances indicates the hydrolysis products of HPMC could further dehydrate into aromatically-structured hydrochar.11 However, the difference between HPMC system and HPMC/opal system is the presence of furans at the addition with opal (the zoom in box area shows in Fig. 10d). The detected furans in HPMC/opal system suggests that opal may promote the formation of furan substances.With the prolonging of time, the ingredient of acid substance (2-(methoxymethyl)-4-oxopentanoic acid) and esters (hepta-2,4-dienal, methyl acetate) do not change. However the alcohols with ring structure disappear. Above alcohols maybe transform into phenol derivatives (aromatic substance) through dehydration and condensation with the proceeding of reaction.40 The formation of esters with ring structure and 1-(2-methyl-1-cyclopentenyl)ethanone is done by the cyclization and dehydration of hydrolysis products with the prolonging of time.41,42 Moreover, pH of filtrate in HPMC/opal systems is always higher than that of the HPMC systems (Fig. 11). GC-MS confirms the filtrates of the HPMC system and HPMC/opal system during carbonization both contained acidic substances. Thus, the higher pH in the filtrate of the HPMC/opal systems can be attributed to the fact that the presence of opal restrains the formation of acidic substances during HTC. It is worthy of noting that the production of some toxic compounds is unavoidable during HTC process. The various toxic compounds can be formed such as phenol, furfural, phenol and furan derivatives and polycyclic aromatic hydrocarbon (PAHs) during hydrothermal carbonization biomass.43,44 It is important to develop the separation process technology to make best use of above substance.45 Moreover, the toxic gas like CO, N2O, CH2O can also be produced during HTC process.46 Because the HPMC does not contain phosphorus, chlorine or sulfur, the mineral acid could not form during this process. The polycyclic aromatic hydrocarbon (PAHs), furfural and furan derivatives are potential toxicity of the compounds, so the hydrochar included these compounds will be harmful in application of environmental fields.47
Mechanism of hydrochar formation
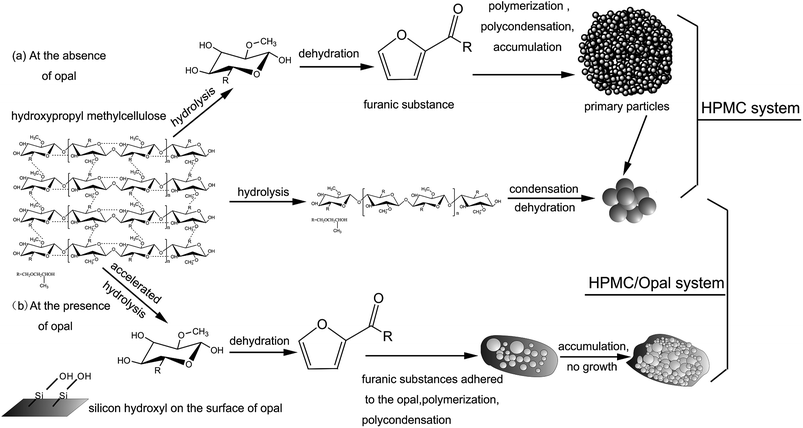
Cellulose hydrolysis occurs because the increased ion product of OH− and H+ under hydrothermal conditions endowed water with both weak acidity and weak basicity and thereby higher reactivity, which promotes the hydrolysis of biomass.24,25 As reported, at the hydrothermal condition of 230 °C, first the reactive cellulose is only partially dissolved or converted to colloidal substance, and the subsequent dissolved cellulose hydrolyzes into water-soluble or hydrophobic low polymers (oligosaccharide) and glucose.3–5 As hydrothermal reaction proceeded, the low polymers are further decomposed into organic acids (formic acid, acetic acid, levulinic acid), which generate the hydronium ions leading to a rapid decline of pH to 3 in the water solution.28 The presence of acidic substances promotes the fracture of hydrogen bonds inside HPMC molecules and accelerates the further hydrolysis of cellulose hydrolysis products. In this period, the water-soluble hydrolysis products further dehydrates and polycondenses into hydrophobic organic matters, which then aggregates into hydrochar.18,25,37GC-MS shows without catalyst or harsh hydrothermal conditions, HPMC would not largely hydrolyze into glucose, fructose or other low polymers (oligosaccharide).5 Fig. 12 shows the conversion pathways of substances during the HTC of HPMC. At early procedure of HTC, the large molecular chains of HPMC first hydrolyze into small-molecular cellulose-like intermediates. As time proceeded, the intermediates are structurally broken into nano- or micron-scale cellulose fragments (carbon frame pyrolysis).4 These cellulose fragments are further converted, through intramolecular condensation, dehydration and decarbonization, into hydrochar with aromatic networks structure, which has been confirmed by FT-IR (Fig. 3). In other words, the conversion from major part of HPMC to hydrochar is a direct solid-phase to solid-phase conversion; this process is like the direct pyrolysis of lignocellulose into hydrochar with aromatic structure.3 During HTC, only a small part of HPMC directly hydrolyzes into glucose and fructose.11,37 Then glucose and fructose hydrolyzes into water-soluble intermediates (furans), which are converted through dehydration, polymerization and polycondensation into hydrophobic original particles, which then aggregate and grow up to form spherical hydrochar with hydrophobic aromatic structure.12,25,37
Due to the existence of opal, the forming mechanism of large spherical hydrochar is very like that of the HPMC system, but the forming mechanism of nanoscale spherical hydrochar adsorbed onto opal surfaces is different from that of the HPMC system. GC-MS has covered the presence of furans in the filtrates. The above experimental phenomena and other reported experimental results lead to our speculations. Owing to the large specific surface area and better absorption ability, opal superficially adsorbs abundant furans, but its surface silicon hydroxyl group could dehydrate with furans, which tightens the binding between opal and furans.31,32 Meanwhile, cross-linking carbon between surface furans can also be formed from the dehydration between active terminal groups (hydroxy terminal, hydrogen terminal), or namely the formation of furan rings.11,12 As HTC proceeded, polycondensation between cross-linking carbons gradually occurs, leading to the formation of spherical hydrochar.5,11,38 SEM shows the surface hydrochar particles are 20–100 nm in size, and the nanoscale particles can be formed because opal adsorption reduces the surface energy of hydrochar and inhibits particle aggregation.
The experimental results show that the opal has obvious promoting effect on HPMC hydrothermal carbonization. The study has an exploratory role in selection of natural biomass in follow-up experiments. Also, the study forms scientific understanding of natural mineral associated biomass between inorganic and organic components in the process of carbonization influenced each other. Further, this paper provides a scientific basis for the preparation of new carbon materials for the controlled carbonization of more minerals coexisted in biomass systems.
Conclusions
By investigating the effects of opal on HTC of HPMC, we found dehydration reaction of HPMC mainly occurred within 105–120 min, afterwards, the hydrochar polycondensation and carbonization were gradually intensified. The pH of hydrothermal filtrate in HPMC systems was about 3, and the presence of opal inhibited the formation of acidic substances in the filtrates. The presence of opal significantly accelerated the dehydration, dehydroxylation and small-molecule dissolution during the hydrothermal reactions. The addition of opal made the aromatic hydrochar appear earlier in the solid products, and accelerated the formation of hydrochar. The presence of opal was contributive to the formation of hydrothermal carbon nanospheres (20–100 nm) in the hydrochar. It is confirmed that minerals could significantly promote HTC of biomass. These findings help to further understand how minerals affect the HTC of biomass, the structures of solid products, and the mechanism of biomass conversion.Conflicts of interest
There are no conflicts of interest to declare.Acknowledgements
We acknowledged the funding support from the financial support of the National Natural Science Foundation of China (NSFC, grant No. 41472035 and 41702036) and Project of Science and Technology Department (Jilin Province, grant No. 20170201002GX).Notes and references
- C. He, A. Giannis and J. Wang, Conversion of sewage sludge to clean solid fuel using hydrothermal carbonization: Hydrochar fuel characteristics and combustion behavior, Appl. Energy, 2013, 111, 257–266 CrossRef.
- X. Lu, B. Jordan and N. D. Berge, Thermal conversion of municipal solid waste via hydrothermal carbonization: Comparison of carbonization products to products from current waste management techniques, Waste Management, 2012, 32, 1353–1365 CrossRef PubMed.
- S. Kang, X. Li, J. Fan and J. Chang, Characterization of hydrochars produced by hydrothermal carbonization of lignin, cellulose, d-xylose, and wood meal, Ind. Eng. Chem. Res., 2012, 51, 9023–9031 CrossRef.
- C. Falco, F. Perez Caballero, F. Babonneau, C. Gervais, G. Laurent, M. M. Titirici and N. Baccile, Hydrothermal carbon from biomass: structural differences between hydrothermal and pyrolyzed carbons via 13C solid state NMR, Langmuir, 2011, 27, 14460–14471 CrossRef PubMed.
- C. Falco, N. Baccile and M. M. Titirici, Morphological and structural differences between glucose, cellulose and lignocellulosic biomass derived hydrothermal carbons, Green Chem., 2011, 13, 3273–3281 RSC.
- M. M. Titirici and M. Antonietti, Chemistry and materials options of sustainable carbon materials made by hydrothermal carbonization, Chem. Soc. Rev., 2010, 39, 103–116 RSC.
- Q. Wu, W. Li, J. Tan, Y. Wu and S. Liu, Hydrothermal carbonization of carboxymethylcellulose: One-pot preparation of conductive carbon microspheres and water-soluble fluorescent carbon nanodots, Chem. Eng. J., 2015, 266, 112–120 CrossRef.
- X. Lu, P. J. Pellechia, J. R. V. Flora and N. D. Berge, Influence of reaction time and temperature on product formation and characteristics associated with the hydrothermal carbonization of cellulose, Bioresour. Technol., 2013, 138, 180–190 CrossRef PubMed.
- Y. Yu and H. Wu, Characteristics and precipitation of glucose oligomers in the fresh liquid products obtained from the hydrolysis of cellulose in hot-compressed water, Ind. Eng. Chem. Res., 2009, 48, 10682–10690 CrossRef.
- A. Bandura and S. Lvov, The ionization constant of water over wide ranges of temperature and density, J. Phys. Chem. Ref. Data, 2006, 35, 15–30 CrossRef.
- M. Zhang, H. Yang, Y. Liu, X. Sun, D. Zhang and D. Xue, Hydrophobic precipitation of carbonaceous spheres from fructose by a hydrothermal process, Carbon, 2012, 50, 2155–2161 CrossRef.
- M. Sevilla and A. Fuertes, The production of carbon materials by hydrothermal carbonization of cellulose, Carbon, 2009, 47, 2281–2289 CrossRef.
- Y. Xue, B. Gao, Y. Yao, M. Inyang, M. Zhang, A. R. Zimmerman and K. S. Ro, Hydrogen peroxide modification enhances the ability of biochar (hydrochar) produced from hydrothermal carbonization of peanut hull to remove aqueous heavy metals: Batch and column tests, Chem. Eng. J., 2012, 200–202, 673–680 CrossRef.
- C. Kammann, S. Ratering, C. Eckhard and C. Müller, Biochar and hydrochar effects on greenhouse gas (carbon dioxide, nitrous oxide, and methane) fluxes from soils, J. Environ. Qual., 2012, 41, 1052–1066 CrossRef PubMed.
- I. H. Hwang, H. Aoyama, T. Matsuto, T. Nakagishi and T. Matsuo, Recovery of solid fuel from municipal solid waste by hydrothermal treatment using subcritical water, Waste Management, 2012, 32, 410–416 CrossRef PubMed.
- R. Sun, L. Sun, Y. Chun and Q. Xu, Catalytic performance of porous carbons obtained by chemical activation, Carbon, 2008, 46, 1757–1764 CrossRef.
- Q. Wang, H. Li, L. Chen and X. Huang, Monodispersed hard carbon spherules with uniform nanopores, Carbon, 2001, 39, 2011–2214 CrossRef.
- J. G. Lynam, C. J. Coronella, W. Yan, M. T. Reza and V. R. Vasquez, Acetic acid and lithium chloride effects on hydrothermal carbonization of lignocellulosic biomass, Bioresour. Technol., 2011, 102, 6192–6199 CrossRef PubMed.
- R. Rinaldi and F. Schuth, Acid hydrolysis of cellulose as the entry point into biorefinery schemes, ChemSusChem, 2009, 2, 1096–1107 CrossRef PubMed.
- J. G. Lynam, M. T. Reza, V. R. Vasquez and C. J. Coronella, Effect of salt addition on hydrothermal carbonization of lignocellulosic biomass, Fuel, 2012, 99, 271–273 CrossRef.
- P. R. Patwardhan, J. A. Satrio, R. C. Brown and B. H. Shanks, Influence of inorganic salts on the primary pyrolysis products of cellulose, Bioresour. Technol., 2010, 101, 4646–4655 CrossRef PubMed.
- K. Raveendran, G. Anuradda and K. C. Khilar, Influence of mineral matter on biomass pyrolysis characteristics, Fuel, 1995, 74, 1812–1822 CrossRef.
- L. M. Wu, C. H. Zhou, D. S. Tong, W. H. Yu and H. Wang, Novel hydrothermal carbonization of cellulose catalyzed by montmorillonite to produce kerogen-like hydrochar, Cellulose, 2014, 21, 2845–2857 CrossRef.
- M. Möller, F. Harnisch and U. Schröder, Hydrothermal liquefaction of cellulose in subcritical water-the role of crystallinity on the cellulose reactivity, RSC Adv., 2013, 3, 11035–11044 RSC.
- M. Sevilla and A. B. Fuertes, Chemical and structural properties of carbonaceous products obtained by hydrothermal carbonization of saccharides, Chem.–Eur. J., 2009, 15, 4195–4203 CrossRef PubMed.
- M. Moreno-Recio, J. Santamaría-González and P. Maireles-Torres, Brönsted and Lewis acid ZSM-5 zeolites for the catalytic dehydration of glucose into 5-hydroxymethylfurfural, Chem. Eng. J., 2016, 303, 22–30 CrossRef.
- Y. Deng, J. Li, T. Qian, W. Guan, Y. Li and X. Yin, Thermal conductivity enhancement of polyethylene glycol/expanded vermiculite shape-stabilized composite phase change materials with silver nanowire for thermal energy storage, Chem. Eng. J., 2016, 295, 427–435 CrossRef.
- M. T. Reza, E. Rottler, L. Herklotz and B. Wirth, Hydrothermal carbonization (HTC) of wheat straw: Influence of feedwater pH prepared by acetic acid and potassium hydroxide, Bioresour. Technol., 2015, 182, 336–344 CrossRef PubMed.
- Y. Jia and B. Wang, Mineralogy and thermal analysis of natural pozzolana opal shale with nano-pores, J. Wuhan Univ. Sci. Technol., 2017, 32, 532–537 CrossRef.
- Y. Li, H. Xiao, M. Chen, Z. Song and Y. Zhao, Absorbents based on maleic anhydride-modified cellulose fibers/diatomite for dye removal, J. Mater. Sci., 2014, 49, 6696–6704 CrossRef.
- M. Li, Z. Wu and H. Kao, Study on preparation and thermal properties of binary fatty acid/diatomite shape-stabilized phase change materials, Sol. Energy Mater. Sol. Cells, 2011, 95, 2412–2416 CrossRef.
- S. Karaman, A. Karaipekli, A. Sarı and A. Biçer, Polyethylene glycol (PEG)/diatomite composite as a novel form-stable phase change material for thermal energy storage, Sol. Energy Mater. Sol. Cells, 2011, 95, 1647–1653 CrossRef.
- J. Dobor, K. Perényi, I. Varga and M. Varga, A new carbon–diatomite earth composite adsorbent for removal of heavy metals from aqueous solutions and a novel application idea, Microporous Mesoporous Mater., 2015, 217, 63–70 CrossRef.
- G. Sheng, S. Yang, J. Sheng, J. Hu, X. Tan and X. Wang, Macroscopic and microscopic investigation of Ni(II) sequestration on diatomite by Batch, XPS, and EXAFS techniques, Environ. Sci. Technol., 2011, 45, 7718–7726 CrossRef PubMed.
- A. J. R. Anaya, M. Ouzzine, M. A. Lillo-Ródenas and A. L. Solano, Spherical carbons: Synthesis, characterization and activation processes, Carbon, 2014, 68, 296–307 CrossRef.
- S. Saka and T. Ueno, Chemical conversion of various celluloses to glucose, Cellulose, 1999, 6, 177–191 CrossRef.
- Y. Qi, M. Zhang, L. Qi and Y. Qi, Mechanism for the formation and growth of carbonaceous spheres from sucrose by hydrothermal carbonization, RSC Adv., 2016, 6, 20814–20823 RSC.
- M. M. Titirici, M. Antonietti and N. Baccile, Hydrothermal carbon from biomass: a comparison of the local structure from poly- to monosaccharides and pentoses/hexoses, Green Chem., 2008, 10, 1204–1212 RSC.
- X. Lu, J. R. V. Flora and N. D. Berge, Influence of process water quality on hydrothermal carbonization of cellulose, Bioresour. Technol., 2014, 154, 229–239 CrossRef PubMed.
- H. Liu, M. Ma and X. Xie, New materials from solid residues for investigation the mechanism of biomass hydrothermal liquefaction, Ind. Crops Prod., 2017, 108, 63–71 CrossRef.
- W. Yang, X. Li, Z. Li, C. Tong and L. Feng, Understanding low-lipid algae hydrothermal liquefaction characteristics and pathways through hydrothermal liquefaction of algal major components: Crude polysaccharides, crude proteins and their binary mixtures, Bioresour. Technol., 2015, 196, 99–108 CrossRef PubMed.
- L. Arteaga-Pérez, O. Cápiro, A. Delgado, S. Martín and R. Jiménez, Elucidating the role of ammonia-based salts on the preparation of cellulose-derived carbon aerogels, Chem. Eng. Sci., 2017, 161, 80–91 CrossRef.
- R. Garlapalli, B. Wirth and M. Reza, Pyrolysis of hydrochar from digestate: Effect of hydrothermal carbonization and pyrolysis temperatures on pyrochar formation, Bioresour. Technol., 2016, 220, 168–174 CrossRef PubMed.
- M. Mihajlović, J. Petrović, S. Maletić, M. Isakovski, M. Stojanović, Z. Lopičić and S. Trifunović, Hydrothermal carbonization of Miscanthus × giganteus: Structural and fuel properties of hydrochars and organic profile with the ecotoxicological assessment of the liquid phase, Energy Convers. Manage., 2018, 159, 254–263 CrossRef.
- S. Nizamuddin, H. Baloch, G. Griffin, N. Mubarak, A. Bhutto, R. Abro, S. Mazari and B. Ali, An overview of effect of process parameters on hydrothermal carbonization of biomass, Renewable Sustainable Energy Rev., 2017, 73, 1289–1299 CrossRef.
- B. Erlach, B. Harder and G. Tsatsaronis, Combined hydrothermal carbonization and gasification of biomass with carbon capture, Energy, 2012, 45, 329–338 CrossRef.
- H. Lyu, Y. He, J. Tang, M. Hecker, Q. Liu, P. D. Jones, G. Codling and J. P. Giesy, Effect of pyrolysis temperature on potential toxicity of biochar if applied to the environment, Environ. Pollut., 2016, 218, 1–7 CrossRef PubMed.
| This journal is © The Royal Society of Chemistry 2018 |

