 Open Access Article
Effects of multiwalled carbon nanotubes on CH4 hydrate in the presence of tetra-n-butyl ammonium bromide
Dong-Liang Liabcd,
Shu-Mei Shengabcde,
Ye Zhangabcde,
De-Qing Liang *abcd and
Xiao-Ping Wuf
aGuangzhou Institute of Energy Conversion, Chinese Academy of Sciences, Guangzhou 510640, China
bCAS Key Laboratory of Gas Hydrate, Guangzhou 510640, China
cGuangdong Provincial Key Laboratory of New and Renewable Energy Research and Development, Guangzhou 510640, China
dGuangzhou Center for Gas Hydrate Research, Chinese Academy of Sciences, Guangzhou 510640, China. E-mail: liangdq@ms.giec.ac.cn; Fax: +86 20870576 69
eNano Science and Technology Institute, University of Science and Technology of China, Suzhou 215123, China
fSchool of Earth and Space Sciences, University of Science and Technology of China, Hefei 230026, China
First published on 14th March 2018
Abstract
Hydrate formation is an important technology for gas storage and transportation. In this work, the effect of multiwalled carbon nanotubes (MWCNTs) on CH4 hydrate formation was examined by determining the phase equilibrium conditions and kinetics characteristics of a mixed system of CH4, tetra-n-butyl ammonium bromide (TBAB), and MWCNTs. The phase equilibrium was examined in the temperature range of 286.13–293.04 K and the pressure range of 0.55–6.56 MPa for various mass fractions of MWCNTs (0.004, 0.1, 0.5, and 1.0 wt%). In the CH4 + TBAB system, the presence of MWCNTs was found to shift the phase equilibrium conditions to a lower temperature by about 1 K compared with those in the absence of MWCNTs. However, the concentration of MWCNTs had little effect on the phase equilibrium conditions. When the concentration of MWCNTs was 1.0 wt%, the addition of MWCNTs reduced the induction time of hydrate formation by 79.5%. When the concentration of MWCNTs was 0.1 wt%, the addition of MWCNTs enhanced the hydrate growth rate by 61.5%. Powder X-ray diffraction patterns revealed that hydrates with orthorhombic structures (corresponding to TBAB·38H2O with 3D cages) were formed in the systems with and without MWCNTs. Moreover, peaks corresponding to MWCNTs were not observed in the patterns of the hydrates and the addition of MWCNTs had no influence on the structure and type of hydrate. Thus, MWCNTs were not incorporated into the hydrate cages.
1. Introduction
Natural gas hydrates or gas hydrates are ice-like crystalline solids composed of water molecules (host) and gas molecules (guest) that exist at certain temperatures and pressures. In these hydrates, gas molecules, such as CH4, CO2, N2, and H2, are caged in water molecule cavities that are connected by hydrogen bonds. There are three common hydrate structures: structure I (sI), structure II (sII), and structure H (sH), which depend on the size and nature of the gas molecules.1,2 In 1940, Fowler et al. found that some quaternary ammonium salts could form hydrates at room temperature and atmospheric pressure.3 Subsequently, Jeffrey determined X-ray crystal structures of this kind of hydrate and found that the cages were composed of both water molecules and anions.4 These types of organic hydrates have been termed as semiclathrate hydrates. Recently, many researchers have focused on semiclathrate hydrates owing to their possible applications in gas storage and transportation, gas separation, etc.5–8Hydrate technology, as an emerging approach for solidifying natural gas, is considered an alternative to liquefied natural gas (LNG) or compressed natural gas (CNG) technologies for natural gas storage and transportation.9 The application of hydrate technology to gas storage and transportation has several advantages compared with CNG and LNG, including lower cost, improved safety, and higher efficiency.10,11 However, there are several technical problems that restrict the industrial application of hydrate technology, such as the long induction time for hydrate formation, the slow rate of hydrate formation, and the low temperature and high pressure conditions required for hydrate formation. In order to overcome these bottlenecks, researchers have developed physical methods, including stirring, bubbling, and spraying,12–14 and chemical methods, including adding surfactants such as tetrahydrofuran (THF), tetra-n-butyl ammonium bromide (TBAB), cyclopentane (CP), and sodium dodecyl sulfate (SDS).15–20 These methods have made obvious contributions, but cannot meet the requirements for industrial application of hydrate technology.
Nanofluids, which have efficient thermal conductivity, have been applied to hydrate technology to reduce the induction time of hydrate formation.9,21 The addition of nano-copper to HFC134a (CH3FCF3) gas hydrates (sII) was first reported by Li et al.22 The results indicated that the addition of nano-copper particles promoted not only mass transfer but also heat transfer during the formation and dissociation of HFC134a hydrates, that is, the presence of nano-copper made it faster to form hydrates. Park et al.23 examined the effect of low mass fractions of multiwalled carbon nanotubes (MWCNTs) (0.001, 0.002, 0.003, 0.004, 0.005, and 0.006 wt%) on CH4 hydrate (sI). The results showed that the phase equilibrium curve shifted to higher temperatures by about 1 K relative to the pure water system and the induction time decreased remarkably. Moreover, an increase of nearly 300% in the amount of gas consumed was observed at an MWCNT concentration of 0.004 wt%. Yu et al.24 investigated the effect of graphite nanoparticles on the phase equilibrium of CO2 hydrate (sI). They concluded that the presence of nanoparticles shifted the equilibrium curves to lower temperatures by about 1 K, but the concentration of nanofluids had no effect on the phase equilibrium. Lim et al.25 studied the CH4 + THF + oxidized multiwalled carbon nanotubes (OMWCNTs) system and found that OMWCNTs had no effect on the phase equilibrium, both in pure water and in THF aqueous solution (sII). However, the presence of THF and OMWCNTs increased the amount of gas consumed by up to 5.2 times compared with that in the pure water system at 3.4 K subcooling and also decreased the induction time of hydrate formation considerably. All these studies confirmed that nanofluids have a positive effect on the induction time of hydrate formation. However, there is no agreement on the shift of the phase equilibrium curves. According to the experimental results in the literature, we conjecture that the effect of MWCNTs on the phase equilibrium conditions may be related to the type of gas or the structure of the hydrate. However, to the best of our knowledge, phase equilibrium data related to the effect of MWCNTs on semiclathrate hydrates is not available in the literature.
In this work, we conducted a series of experiments to examine CH4 hydrate in TBAB aqueous solution in the presence of different mass fractions of MWCNTs (0.0, 0.004, 0.1, 0.5, and 1.0 wt%). The concentration of TBAB was 38.5 wt% in accordance with the literature.26,27 The purpose of this work was to elucidate the effects of MWCNTs on the phase equilibrium and the formation dynamics of semiclathrate hydrates, and provide fundamental data that can be applied to gas storage and transportation applications.
2. Experimental section
2.1 Materials
CH4 (99.9% purity, Guangzhou Yigas Gases Co. Ltd.) and TBAB (>98.0% purity, Tokyo Chemical Industry, Japan) were used in these experiments. The MWCNTs used in this study (95% purity, bulk density of 0.1 g cm−3, Tokyo Chemical Industry, Japan) were tubular in shape with diameters of <10 nm, lengths of 5–15 μm, and surface areas of 100–160 m2 g−1. To prepare the solutions, TBAB and MWCNTs were weighed using an electronic balance with an uncertainty of ±0.1 mg. Deionized water with a resistivity of 18 MΩ cm was obtained in the laboratory.2.2 Treatment and characterization of pristine MWCNTs
2.3 Experimental apparatus
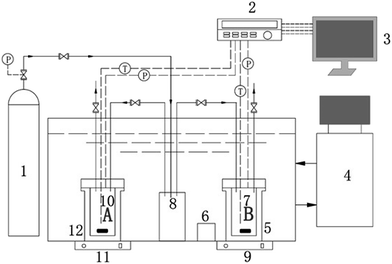
A schematic of the apparatus used in this work is shown in Fig. 1. The apparatus comprised two cylindrical vessels made of #316 stainless steel, each with a total volume of 100 mL and a maximum work pressure of 25 MPa. The vessels were immersed in a thermostatic bath (Tian Heng THD-2030). The inner temperature and pressure of each vessel were monitored using a platinum resistance thermometer (PT100) with a precision of ±0.1 K and a pressure transducer (CYB-20S) with a precision of ±0.02 MPa, respectively. The aqueous solutions inside the cells were driven by a magnetic stirrer (Mei Ying Pu 98-2) throughout the experiments. The experimental temperature and pressure data were collected every 10 s using an Agilent data acquisition system and saved to a computer.2.4 Experimental procedure
Before each experiment, the vessel was washed with deionized water once and then with the experimental suspension three times. The vessel was charged with approximately 30 mL of the experimental suspension and then the air in the system was evacuated using a vacuum pump. After setting the initial temperature of the thermostatic bath to 298.15 K, the desired pressure of CH4 gas was introduced into the buffer tank. When the gas temperature was stable, the magnetic stirrer was turned on at a speed of 600 rpm and the vessel was pressurized to the initial desired pressure. The temperature of the thermostatic bath was set to a lower value (ensuring that the subcooling temperature exceeded 10 K) to form the hydrate. During the cooling process, a sharp decrease in pressure along with a sudden increase in temperature indicated the formation of the hydrate. In order to form a sufficient amount of hydrate, the bath was maintained at a stable temperature for 4 h. Subsequently, the temperature of the system was increased gradually by controlling the temperature of the thermostatic bath. Initially, the temperature was increased in large steps. Once the pressure increased steeply, indicating the beginning of hydrate dissociation, the temperature was increased in steps of 0.1 K, with each temperature maintained for 4 h to achieve an equilibrium state. After dissociation of the hydrate was complete, the temperature was increased in steps of 0.2 K. Finally, the pressure–temperature (P–T) diagram of hydrate formation and dissociation was plotted. The point at which the slope of the P–T curve sharply changed was considered as the hydrate dissociation point.32,34,35
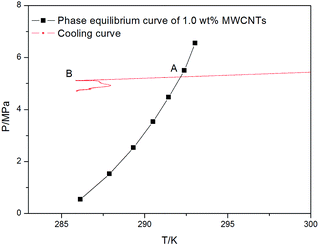
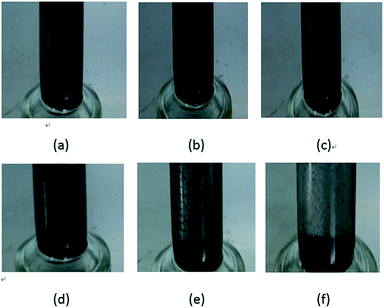
In this study, the induction time was defined as the time that elapses from the moment the initial equilibrium state is formed to the time a certain detectable number of hydrate-forming gas molecules are consumed.37 Fig. 2 and 3 show the cooling curve and the change in temperature and pressure over time for 1.0 wt% MWCNTs at 5.5 MPa with a subcooling of 6 K, respectively. The time elapsed between points A and B is defined as the induction time in Fig. 2 which corresponds to the time between C and D in Fig. 3.
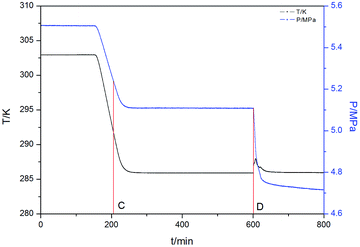 | ||
| Fig. 3 The change in temperature and pressure over time for 1.0 wt% MWCNTs at 5.5 MPa and a subcooling of 6 K. | ||
Molar gas consumption rates can be obtained according to the following equation:
| r = dn/dt | (1) |
The method of calculating the amount of gas consumed was introduced in a previous report.38 The volume of gas in the reactor is assumed to be constant. Therefore, the consumption of methane gas to form the hydrate is related to the pressure drop. The total amount of gas consumed at time t is determined using the following equation.
 | (2) |
3. Results and discussion
3.1 Characterization of MWCNTs
3.2 Phase equilibrium
The validity of the experimental apparatus and the method applied to acquire phase equilibrium data were checked by comparing the CH4 + H2O phase equilibrium data with literature data.30,41,42 Table 1 lists the phase equilibrium data for CH4 hydrate in pure water. As shown in Fig. 6, the equilibrium pressures and temperatures obtained in this work are in good agreement with the literature values, indicating that the apparatus and method applied in this study are reliable.| T/K | P/MPa |
|---|---|
| 281.5 | 6.05 |
| 281.8 | 6.25 |
| 283.1 | 7.11 |
| 284.5 | 8.41 |
| 285.6 | 9.56 |
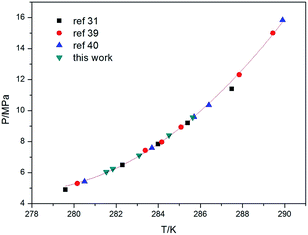 | ||
| Fig. 6 Comparison of the phase equilibrium data for CH4 hydrate in pure water obtained in this work with literature data. | ||
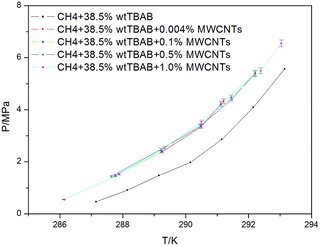
The phase equilibrium data for CH4 + 38.5 wt% TBAB + MWCNTs (0.004, 0.1, 0.5, and 1.0 wt%) are shown in Fig. 7. The phase equilibrium data for CH4 + 38.5 wt% TBAB are found in the literature.26 The data obtained as the average of three measurements are presented in Table 2. As shown in Fig. 7, compared with the CH4 + 38.5 wt% TBAB system, a significant upward shift in the formation pressure of the CH4 and TBAB semiclathrate is observed at each temperature for the CH4 + 38.5 wt% TBAB + MWCNTs systems. This result means that the pressure required for hydrate formation in nanoparticle suspensions is higher than that in TBAB aqueous solution. In other words, the nanoparticles have a negative effect on the thermodynamics of gas hydrate formation.
| wMWCNTs/wt% | T/K | P/MPa |
|---|---|---|
| 0.004 | 289.26 | 2.39 |
| 290.51 | 3.36 | |
| 291.21 | 4.33 | |
| 0.1 | 287.77 | 1.47 |
| 289.23 | 2.39 | |
| 290.48 | 3.36 | |
| 291.12 | 4.22 | |
| 292.20 | 5.38 | |
| 0.5 | 287.64 | 1.45 |
| 289.21 | 2.48 | |
| 290.47 | 3.38 | |
| 291.47 | 4.41 | |
| 292.21 | 5.41 | |
| 1.0 | 286.13 | 0.55 |
| 287.89 | 1.52 | |
| 289.33 | 2.53 | |
| 290.50 | 3.53 | |
| 291.45 | 4.47 | |
| 292.39 | 5.50 | |
| 293.04 | 6.56 |
Similar to the CO2 and graphite nanoparticle suspension system,24 this phenomenon can be explained as follows. MWCNTs in water increase the disorder of the water molecules, which results in an increase of the system entropy. Hence, the formation of hydrate crystal cavities requires more hydrogen bond energy, which leads to an increase of the temperature and pressure of hydrate formation. In addition, some larger MWCNTs have tubular structures that can reduce the activity of water and increase the pressure of hydrate formation. However, our result does not agree with the conclusions reported for the CH4 + MWCNTs suspension system (sI).25 In fact, the hydrate structure for the CH4 + 38.5 wt% TBAB + MWCNTs systems was different from that of the CH4 + MWCNTs suspension system. As a result, the thermodynamic function of the MWCNTs may be related to the type of gas and hydrate.
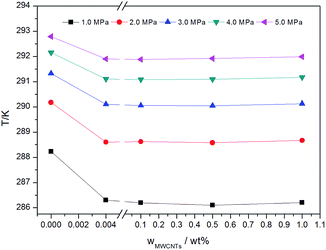
As shown in Fig. 7, the concentration of MWCNTs had little effect on the phase equilibrium of gas hydrate formation. In order to show this phenomenon clearly, the phase equilibrium data are plotted as a function MWCNT concentration in Fig. 8. As shown, the equilibrium conditions do not exhibit a gradual shift with increasing MWCNT concentration. Instead, an abrupt change is observed at a low MWCNT concentration (0.004 wt%). These results are in agreement with those in different porous media, such as nano-copper,22 graphite nanoparticles,24 silica gel,43 and porous glass.44 However, the existence of agglomerated MWCNTs owing to van der Waals interactions between the nanotubes makes the dispersion of MWCNTs in matrices difficult, limiting their solubility in water.45 As described previously, dissolved MWCNTs increase the system entropy by increasing the disorder of the water molecules. Thus, more hydrogen bond energy is required for hydrate crystal cavity formation, which increases the pressure of hydrate formation.24,46 However, once the MWCNT mass fraction is larger than the maximum solubility of MWCNTs, increasing the mass fraction further has a negligible influence on the system.
3.3 Induction time and gas consumption rate
Fig. 9 shows the induction times for different MWCNT concentrations (0.0, 0.004, 0.008, 0.1, and 1.0 wt%) at a subcooling of 6 K and a pressure of 5.5 MPa. Although there is an uncertainty in the induction time of each experimental group, we found that the presence of MWCNTs reduces the induction time obviously compared with the system without MWCNTs at the same subcooling. For example, the average induction time of the control system is 968.4 min, whereas the induction time of the system with 1.0 wt% MWCNTs is 198.2 min. Thus, in this case, the presence of MWCNTs shortened the hydrate formation time by 79.5%. Generally, the average induction time decreased as the concentration of MWCNTs increased, except in the case of 0.1 wt% MWCNTs. This discrepancy can be explained by the uncertainty in the induction time. The results of our experiment agreed with the conclusions of other studies.22,47 Methane hydrate nucleation is an exothermic process. This process is faster when the heat is dissipated, and carbon nanotubes have been found to have good thermal conductivity.9,48 In addition, the presence of MWCNTs increases the surface area for nucleation sites for hydrate formation.49 Furthermore, heterogeneous nucleation is more likely to occur than homogenous nucleation.50 Therefore, nucleation of methane hydrate is easier and faster in the presence of MWCNTs.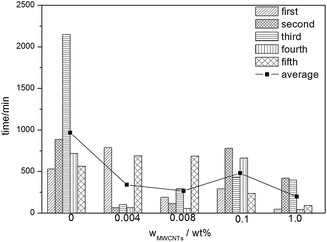 | ||
| Fig. 9 Induction times for different MWCNT concentrations at a subcooling of 6 K and a pressure of 5.5 MPa. | ||
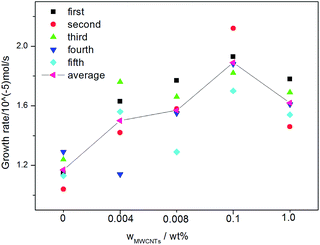
Fig. 10 shows that the average growth rates of the systems with MWCNTs are higher than that of the control system (1.17 × 10⁻⁵ mol s−1). The average gas consumption rate was 1.50 × 10⁻⁵ mol s−1 at 0.004 wt% MWCNTs, and as the concentration of MWCNTs increased, the average gas consumption rate first increased to a maximum of 1.89 × 10⁻⁵ mol s−1 at 0.1 wt% MWCNTs and then decreased to 1.62 × 10⁻⁵ mol s−1 at 1.0 wt% MWCNTs. Pasieka et al. investigated the effect of hydrophobic and hydrophilic MWCNTs on methane hydrate growth kinetics.51 They found that the methane hydrate growth rate increased with increasing concentrations of hydrophobic MWCNTs and then reached a plateau. Further, at low hydrophilic MWCNT loadings, the growth rate sharply increased by 16.34% at 0.1 ppm MWCNTs, then rapidly decreased to the baseline value at 1 ppm MWCNTs, and then increased almost linearly with increasing MWCNT concentration. However, all these experiments were conducted at low MWCNT concentrations (≤10 ppm). In this work, with the increase of the concentration of carbon nanotubes, the growth rate of methane hydrate firstly increases and then decreases. Renault-Crispo et al. recently investigated the CO2 + TBAB + oxygen-functionalized multi-walled carbon nanotubes (OMWCNTs) system.52 They showed that the addition of OMWCNTs could enhance the gas consumption rate of the TBAB gas hydrate system when the induction time was short and when the induction time was more than 1 h, the average gas consumption rate of the systems with and without OMWCNTs were not statistically different. In this work, however, it was not found the regular conclusion between average gas consumption rate and induction time.
3.4 PXRD analysis
Fig. 11 shows the PXRD patterns of CH4 hydrates formed in the absence and presence of different concentrations of MWCNTs, pure CH4 hydrate, and pristine MWCNTs. The PXRD patterns of all the hydrate samples are consistent with orthorhombic Pmma structures.53,54 The peaks at 2θ = 7.11°, 8.57°, 11.1°, 16.4°, 17.2°, and 18.4° were assigned to Miller indices (h k l) of 010, 200, 210, 220, 202, and 401, respectively. In the PXRD pattern of pristine MWCNTs, the peaks at 2θ = 25.85° and 43.43° were assigned to the Miller indices (h k l) of 002 and 100.55,56 In Fig. 11, asterisks indicate the peaks corresponding to pure CH4 hydrate. Judging from the PXRD pattern and the conditions required for methane hydrate formation, there is no pure methane hydrate in the semiclathrate systems. As shown by the red dotted line in Fig. 11, there is no apparent MWCNT peak in the hydrate systems containing MWCNTs. According to the PXRD analysis, MWCNTs may not participate in the construction of the hydrate cavities and have no effect on the type of TBAB + CH4 hydrate formed. Microinteractions between the hydrate crystals and MWCNTs, as well as those between MWCNTs, only influence the thermal conductivity and the activity of the suspension.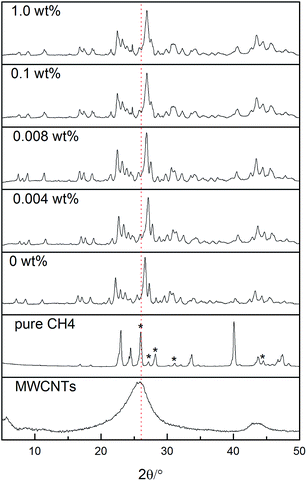 | ||
| Fig. 11 PXRD patterns of CH4 hydrates with and without MWCNTs and pristine MWCNTs. The asterisks indicate peaks corresponding to pure CH4 hydrate. | ||
4. Conclusion
This paper has presented the effects of adding MWCNTs to a CH4 + TBAB system on CH4 hydrate formation. The presence of MWCNTs reduced the induction time. Moreover, the phase equilibrium conditions for CH4 hydrates were shifted to lower temperatures by about 1 K in the presence of MWCNTs relative to the CH4 + TBAB system. However, above a concentration of 0.004 wt%, the presence of MWCNTs had no significant effect on the phase equilibrium conditions. The PXRD patterns showed that the semiclathrate hydrates formed in the absence and presence of MWCNTS both had orthorhombic structures. Moreover, MWCNTs were likely not involved in the construction of the hydrate cavities. Thus, the microinteractions that exist between the hydrate crystals and the MWCNTs, as well as between MWCNTs, only influenced the thermal conductivity and the activity of the suspension. Therefore, the addition of MWCNTs is an effective way of increasing the speed of hydrate formation without affecting the structure of hydrate.Conflicts of interest
There are no conflicts to declare.Acknowledgements
The work was supported by the National Natural Science Foundation of China (51474197 and 51661165011) and the National Key Research and Development Plan of China (No. 2016YFC0304002).References
- E. D. Sloan, Clathrate Hydrates of Natural Gas, ed. M. Dekker, 1998 Search PubMed.
- E. D. Sloan Jr, Nature, 2003, 426, 353–359 CrossRef PubMed.
- D. L. Fowler, W. V. Loebenstein, D. B. Pall and C. A. Kraus, J. Am. Chem. Soc., 1940, 62, 1140–1142 CrossRef CAS.
- G. A. Jeffrey, Acc. Chem. Res., 1969, 2, 344–352 CrossRef CAS.
- N. Mayoufi, D. Dalmazzone, A. Delahaye, P. Clain, L. Fournaison and W. Fürst, J. Chem. Eng. Data, 2011, 56, 2987–2993 CrossRef CAS.
- L. Shi and D. Liang, J. Chem. Eng. Data, 2015, 60, 2749–2755 CrossRef CAS.
- L. L. Shi and D. Q. Liang, Fluid Phase Equilib., 2015, 386, 149–154 CrossRef CAS.
- L. P. Sales Silva, D. Dalmazzone, M. Stambouli, P. Arpentinier, A. Trueba and W. Fürst, J. Chem. Thermodyn., 2016, 102, 293–302 CrossRef CAS.
- L. Dongliang, P. Hao and L. Deqing, Int. J Heat Mass Transfer, 2017, 104, 566–573 CrossRef.
- H. Kanda, Economic Study on Natural Gas Transportation with Natural Gas Hydrate (NGH) Pellets. 23rd world gas conference, Amsterdam, 2006 Search PubMed.
- S. Y. Lee and G. D. Holder, Fuel Process. Technol., 2001, 71, 181–186 CrossRef CAS.
- M. Yang, W. Jing, P. Wang, L. Jiang and Y. Song, Fluid Phase Equilib., 2015, 401, 27–33 CrossRef CAS.
- P. Linga, R. Kumar, J. D. Lee, J. Ripmeester and P. Englezos, Int. J. Greenhouse Gas Control, 2010, 4, 630–637 CrossRef CAS.
- Y. T. Luo, J. H. Zhu, S. S. Fan and G. J. Chen, Chem. Eng. Sci., 2007, 62, 1000–1009 CrossRef CAS.
- E. Brown, M. N. Khan, D. Salmin, J. Wells, S. L. Wang, C. J. Peters and C. A. Koh, J. Nat. Gas Sci. Eng., 2016, 35, 1435–1440 CrossRef CAS.
- D. Mech, G. Pandey and J. S. Sangwai, Fluid Phase Equilib., 2015, 402, 9–17 CrossRef CAS.
- D. Mech and J. S. Sangwai, J. Chem. Eng. Data, 2016, 61, 3607–3617 CrossRef CAS.
- D. Posteraro, J. Pasieka, M. Maric and P. Servio, J. Nat. Gas Sci. Eng., 2016, 35, 1579–1586 CrossRef CAS.
- M. J. Yang, W. Jing, P. F. Wang, L. Jiang and Y. C. Song, Fluid Phase Equilib., 2015, 401, 27–33 CrossRef CAS.
- N. Ye and P. Zhang, J. Chem. Eng. Data, 2014, 59, 2920–2926 CrossRef CAS.
- M. T. Pettes and L. Shi, Adv. Funct. Mater., 2009, 19, 3918–3925 CrossRef CAS.
- J. P. Li, D. Q. Liang, K. H. Guo, R. Z. Wang and S. S. Fan, Energy Convers. Manage., 2006, 47, 201–210 CrossRef CAS.
- S.-S. Park, S.-B. Lee and N.-J. Kim, J. Ind. Eng. Chem., 2010, 16, 551–555 CrossRef CAS.
- Y. S. Yu, S. D. Zhou, X. S. Li and S. L. Wang, Fluid Phase Equilib., 2016, 414, 23–28 CrossRef CAS.
- S.-H. Lim, S. B. Riffat, S.-S. Park, S.-J. Oh, W. Chun and N.-J. Kim, Int. J. Energy Res., 2014, 38, 374–379 CrossRef CAS.
- D. Li, J. Du, S. Fan, D. Liang, X. Li and N. S. Huang, J. Chem. Eng. Data, 2007, 52, 1916–1918 CrossRef CAS.
- H. Oyama, W. Shimada, T. Ebinuma, Y. Kamata, S. Takeya, T. Uchida, J. Nagao and H. Narita, Fluid Phase Equilib., 2005, 234, 131–135 CrossRef CAS.
- B. Tohidi, R. W. Burgass, A. Danesh, K. K. Østergaard and A. C. Todd, Ann. N. Y. Acad. Sci., 2000, 912, 924–931 CrossRef CAS.
- Y. J. Lee, T. Kawamura, Y. Yamamoto and J. H. Yoon, J. Chem. Eng. Data, 2015, 57, 3543–3548 CrossRef.
- W.-Z. Wu, J.-A. Guan, X.-D. Shen, L.-L. Shi, Z. Long, X.-B. Zhou and D.-Q. Liang, J. Chem. Eng. Data, 2016, 61, 3498–3503 CrossRef CAS.
- X.-D. Shen, Z. Long, L.-l. Shi and D.-Q. Liang, J. Chem. Eng. Data, 2015, 60, 3392–3396 CrossRef CAS.
- Z. Long, X. Zhou, D. Liang and D. Li, J. Chem. Eng. Data, 2015, 60, 2728–2732 CrossRef CAS.
- X. Long, Y. Wang, X. Lang, S. Fan and J. Chen, J. Chem. Eng. Data, 2016, 61, 3897–3901 CrossRef CAS.
- Z. T. Ward, C. E. Deering, R. A. Marriott, A. K. Sum, E. D. Sloan and C. A. Koh, J. Chem. Eng. Data, 2015, 60, 403–408 CrossRef CAS.
- L.-L. Shi, D.-Q. Liang and D.-L. Li, J. Chem. Thermodyn., 2014, 68, 322–326 CrossRef CAS.
- Q. Wu and B. Zhang, J. Nat. Gas Chem., 2010, 19, 446–451 CrossRef CAS.
- S.-D. Zhou, Y.-S. Yu, M.-M. Zhao, S.-L. Wang and G.-Z. Zhang, Energy Fuels, 2014, 28, 4694–4698 CrossRef CAS.
- X.-D. Shen, L.-L. Shi, Z. Long, X.-B. Zhou and D.-Q. Liang, J. Mol. Liq., 2016, 223, 672–677 CrossRef CAS.
- D. Y. Peng and D. B. Robinson, Ind. Eng. Chem. Fundam., 1976, 15, 92–94 Search PubMed.
- Y. Song, F. Wang, G. Liu, S. Luo and R. Guo, Energy Fuels, 2017, 31, 1850–1857 CrossRef CAS.
- J. Nixdorf and L. R. Oellrich, Fluid Phase Equilib., 1997, 139, 325–333 CrossRef CAS.
- A. H. Mohammadi, R. Anderson and B. Tohidi, AIChE J., 2005, 51, 2825–2833 CrossRef CAS.
- W. Zhang, J. W. Wilder and D. H. Smith, J. Phys. Chem. B, 2003, 107, 13084–13089 CrossRef CAS.
- T. Uchida, T. Ebinuma, S. Takeya, A. Jiro Nagao and H. Narita, J. Phys. Chem. B, 2002, 106, 820–826 CrossRef CAS.
- C. H. Park, E. Tocci, E. Fontananova, M. A. Bahattab, S. A. Aljlil and E. Drioli, J. Membr. Sci., 2016, 514, 195–209 CrossRef CAS.
- S.-P. Kang, J.-W. Lee and H.-J. Ryu, Fluid Phase Equilib., 2008, 274, 68–72 CrossRef CAS.
- S. Arjang, M. Manteghian and A. Mohammadi, Chem. Eng. Res. Des., 2013, 91, 1050–1054 CrossRef CAS.
- M. Xing, J. Yu and R. Wang, Int. J. Heat Mass Transfer, 2015, 88, 609–616 CrossRef CAS.
- H. Najibi, M. M. Shayegan and H. Heidary, J. Nat. Gas Sci. Eng., 2015, 23, 315–323 CrossRef CAS.
- D. Kashchiev and A. Firoozabadi, J. Cryst. Growth, 2002, 243, 476–489 CrossRef CAS.
- J. Pasieka, S. Coulombe and P. Servio, Chem. Eng. Sci., 2013, 104, 998–1002 CrossRef CAS.
- J.-S. Renault-Crispo, S. Coulombe and P. Servio, Energy, 2017, 128, 414–420 CrossRef CAS.
- M. Oshima, M. Kida and J. Nagao, J. Chem. Eng. Data, 2016, 61, 3334–3340 CrossRef CAS.
- S. Muromachi, Y. Yamamoto and S. Takeya, Korean J. Chem. Eng., 2016, 33, 1917–1921 CrossRef CAS.
- L. Zhao, W. L. Liu, L. D. Zhang, J. S. Yao, W. H. Xu, X. Q. Wang and Y. Z. Wu, Colloids Surf., A, 2013, 423, 69–76 CrossRef CAS.
- C. Oopathump, O.-U. Kheowan, A. Charoenphakdee, A. Harnwunggmoung, S. M. Smith and C. B. Smith, Ceram. Int., 2017, 43, 17086–17092 CrossRef CAS.
| This journal is © The Royal Society of Chemistry 2018 |

