 Open Access Article
Hydrolysis dynamics for batch anaerobic digestion of elephant grass
Gaixiu Yang,
Yongming Sun,
Lianhua Li,
Pengmei Lv ,
Xiaoying Kong
 and
Dalong Huang
Guangzhou Institute of Energy Conversion, Key Laboratory of Renewable Energy, Guangdong Key Laboratory of New and Renewable Energy Research and Development, Chinese Academy of Sciences, Guangzhou 510640, China. E-mail: huangdl@ms.giec.ac.cn
First published on 20th June 2018
Abstract
Elephant grass might be a potential source of fine chemical precursors and bioenergy. In the present study, we investigated the dynamics of hydrolysis of elephant grass. Three models were used to fit the hydrolysis rate constants—flat, spherical, and cylindrical models. The hydrolysis rate constants obtained using the spherical model presented the best fit between the experimental and theoretical values. Furthermore, we determined the secondary reinforcement points and interventions that can be introduced to speed up the hydrolysis process. Our findings will provide information for studies on the hydrolysis of elephant grass and promote its application in the biogas industry as an alternative biofuel.
1 Introduction
Currently, the excess and inappropriate use of fossil fuels has resulted in considerable social and environmental problems, such as accelerated global non-renewable resource depletion, air pollution, energy crisis, global warming, and climate change. The world's primary energy consumption had reached 13![[thin space (1/6-em)]](https://www.rsc.org/images/entities/char_2009.gif) 371.0 million tons of oil equivalents in 2012, increasing by 52.3% over the last 20 years, according to the IEA report.1 The world is facing a severe shortage of energy and unprecedented challenges, necessitating the development of sustainable technologies to meet the rising energy demands.
371.0 million tons of oil equivalents in 2012, increasing by 52.3% over the last 20 years, according to the IEA report.1 The world is facing a severe shortage of energy and unprecedented challenges, necessitating the development of sustainable technologies to meet the rising energy demands.
Recent studies have focused on identifying low-cost, renewable lignocellulosic residues that can be obtained from municipal waste, forest residues, and energy crops, as sustainable alternatives to fossil fuel. Furthermore, biomass has received considerable interest as a promising feedstock for the production of bioenergy. Energy crops such as gramineous crops, elephant grass,2,3 switchgrass,4 and reed canary grass5 can be used to produce biofuel via processes such as combustion, gasification, and liquefaction.6
Elephant grass (Pennisetum purpureum), also known as Napier grass, originated in subtropical Africa and has been introduced to most tropical and subtropical countries. The stem of elephant grass can grow over 3 m in height, and its annual production rate reaches up to 88 Mg of dry matter per hectare.7 It has been widely cultivated and used owing to its high biomass production and low water and nutrient. It can be grown without any nutrient or fertilizer input as reported by Flores et al.8 Furthermore, due to its short agricultural cycle, the grass can be harvested five to six times per year.9 Currently, elephant grass is grown widely in Hainan, Guangdong, Guangxi, Hunan, Sichuan, and Yunnan Provinces of China. Except for being used as animal fodder, it is also a potential source of bioenergy owing to its high growth potential and stem with solid center, similar to that in maize, corn stover10 and sugar cane. All of this makes elephant grass becomes a promising source of lignocellulosic biomass due to its high growth potential, biomass yield, limited requirement for cultivation land and high rates of carbon dioxide absorption.
Anaerobic digestion (AD) technology is an efficient method to obtain energy from crops. The CH4-rich biogas produced is suitable for energy and can alleviate the excessive use of fossil fuels. As part of an integrated waste management system, AD contributes to the mitigation of greenhouse gas emission by reducing methane emission that occurs when waste materials are dumped in landfills. Thus, AD provides an efficient way to utilize energy grass. In the US and Europe, energy crops such as switchgrass, miscanthus and reed canary grass, have been used as feedstock for AD since the mid-1980s.11–13 In China, vetiver grass, smooth cordgrass, and comfrey are the main energy grasses that have been used for AD.14
It is known that AD can be described as a sequential process that involves the following steps: hydrolysis, acidogenesis, acetogenesis, and methanogenesis. Hydrolysis is known to be a critical process-(rate-determining step) of AD, resulting in a low methane production when complex substrates, such as lignocellulosic materials, are used as feedstocks.15
The rigid structure of elephant grass limits its utilization by microbes,16 which significantly restricts the biogas production efficiency of energy grass. Pretreatment is an essential part for improving the hydrolysis efficiency, which has been the deemed as an effective method to improve the lignocellulose digestion efficiency and biogas production by breaking the lignin seal, disrupting the crystalline structure of cellulose, and making cellulose more accessible to the enzymes or microbes. However, it is difficult to accurately determine the pretreatment parameters just through experiments. Thus, it is necessary to introduce modified kinetics models that elucidate the hydrolysis of elephant grass, which will improve the digestion efficiency and biogas production.
Several models are mainly being used to describe the hydrolysis kinetics of organic material, such as first-order, Contois and Monod, which are then combined to form mechanistic models. A typical hydrolysis kinetics is considerably complex and have many limitations, as mentioned by Borja17 and Valentini.18 For instance, the Monod equation can be used to describe the hydrolysis process of soluble organic particles; however, it is not applicable for particulate organic matter. Hu et al.19 indicated that the Contois equation is more suitable to describe the kinetics of pilot-scale processes than the Monod equation.
The first-order kinetics presents a good application in modeling the hydrolysis process of particulate organic matter. However, for complex substrates, the first-order kinetics should be modified to account for the hardly degradable material. Vavilin et al. developed a model that incorporated the colonization of cellulose particles by a pre-existing cellulose-bound bacterial population, with the associated progressive reduction in particle size due to cellulose hydrolysis. The model assumed that the pre-existing cellulose-bound biomass population is solely responsible for particle colonization.20 Rotter et al. developed a new model to simulate cellulose hydrolysis, which uniquely incorporated the ability of free-floating bacteria to colonize cellulose particles by attachment through contact in solution.21 For further optimization of anaerobic digestion, Biernacki et al. analyzed biogas production with commonly used substrates, including grass, maize, and green weed silage, together with industrial glycerine by Weender analysis/van Soest method, and a simulation study was conducted, based on the International Water Association's (IWA) Anaerobic Digestion Model No. 1 (ADM1). The optimization led to a precise prediction of kinetics of anaerobic degradation of complex substrates.22 Currently, the hydrolysis kinetic models for elephant grass have not been well studied. Therefore, establishing hydrolysis kinetic models for elephant grass is essential, considering its importance in bioenergy production.
In the present study, the hydrolysis kinetics of perennial elephant grass grown in South China was investigated. In order to avoid the inevitable loss of easily hydrolyzed and degraded sugars and hemicellulose and the production of fermentation inhibitors (such as furfural, fatty acids and aromatic compounds), the degradation rule of the substrate was studied by the introduction of modified hydrolysis kinetic models. Three models—flat, spherical, and cylindrical models—were used to fit the hydrolysis rate constants. The spherical model exhibited the best fit between experimental and theoretical values. Furthermore, to speed up the hydrolysis reaction, the secondary reinforcement points that can be intervened were determined. The findings of the present study might promote the use of energy grass in biogas industry.
2 Materials and methods
2.1 Characteristics of feedstock
Perennial elephant grass was manually harvested from a field in the north campus of South China University of Technology, Guangzhou, China. The raw material mainly contained cellulose (29.27%), hemicellulose (26.61%), and lignin (17.99%). The content of total solid (TS) and volatile solid (VS) of the feedstock was 15.16% and 12.81%, respectively, and the ratio of VS/TS was 0.85, indicating that the digestible content in the feedstock was very high. The mass fraction of C and N elements was 40.94% and 0.737%, respectively, and the ratio of C/N was 55.55. The optimum range of C/N ratio for anaerobic fermentation is 25–32. The acidification of anaerobic fermentation occurs at a high ratio of C/N and is restrained by ammonia nitrogen when the ratio of C/N is too low. Hence, the addition of appropriate amount of ammonium bicarbonate to the fermentation broth enables the adjustment of this ratio. The calorific value of the feedstock was 16![[thin space (1/6-em)]](https://www.rsc.org/images/entities/char_2009.gif) 566.2 kJ kg−1.
566.2 kJ kg−1.
2.2 Inoculated sludge
The inoculum, sieved through a 1 mm mesh to remove large particles, was obtained from a mesophilic anaerobic digestion reactor fed with swine manure (Boluo, Guangdong, China). The pH, TS content, and VS content of the inoculum were 7.30, 3.59%, and 2.32%, respectively.2.3 Experimental setup and procedure
The experiment was performed in batches in 500 mL glass bottles at 310 K in a thermostatic water bath in duplicates. The digesters were flushed with N2 gas for 3 min to remove oxygen. All the bottles were then sealed with butyl rubber stoppers attached to exhaust pipes, and the air outlets were sealed with water. All the bottles were filled with 300 g of inoculum and 100 g of crushed feedstock; 2.5% ammonium bicarbonate was added to improve the buffer capacity, which also served as a supplementary nitrogen source. During the experiment, all the reactors were manually shaken twice a day. The experiments were conducted for over 20 d.2.4 Analysis methods
The content of C, N, H, and S was measured using a Vario EL elemental analyzer (Elementar Corporation, Germany). The compositional analysis was carried out following the procedure described by the National Renewable Energy Laboratory (NREL).23 The HPLC system (Waters 2698, USA) equipped with a sugar column (SH1011, Shodex) was used to measure the sugar concentration at 323 K with 5 mM H2SO4 as the mobile phase, at the flow rate of 0.5 mL min−1. The pH was determined using a pH meter (pHS-3C; China). Standard analytical methods were followed to determine the content of TS and VS in the inoculum and fresh and silage feedstock.24 The fermentation material was dried in an oven at 378 K until constant weight was achieved, and then the TS content was determined. Subsequently, the raw materials were burned at 823 K to a constant weight in order to determine the content of VS. The VOC content was also measured using a gas chromatography-mass spectrometer (GC-MS) (Agilent 7890/5975C-GC/MS). The calorific value was determined using an automatic calorimeter (C2000, IKA, Germany).2.5 Kinetic models for hydrolysis
The hydrolysis kinetic models for elephant grass were developed based on improved first-order hydrolysis models reported previously, such as flat, cylindrical, and spherical models.25Flat model
 | (1) |
Cylindrical model
 | (2) |
Spherical model
 | (3) |
3 Results and discussion
3.1 Hydrolysis
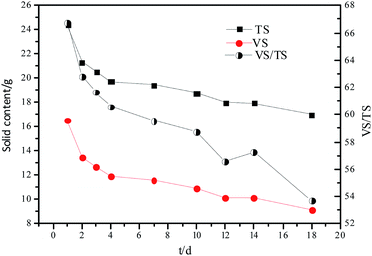
The results of hydrolysis of organic particles are presented in Table 1. The results showed that on day 1, the content of TS, VS, TS concentration and the ratio of VS/TS of the hydrolysate were 24.77 g, 16.53 g, 61.93 g TS L−1, and 66.72, respectively. With time, the organic compounds were hydrolyzed, and the content of TS, VS, and TS concentration decreased to 19.42 g, 11.57 g, and 59.58 g TS L−1, respectively, on day 7. In a parallel experiment, the addition of alkali or acid increased the content of TS, VS, and TS to 20.27 g, 11.81 g, and 58.25 g TS L−1, respectively, on day 10 (data not shown). This indicates that the addition of alkali or acid accelerates the hydrolysis reaction.| Time (d) | TS/mass (g) | VS/mass (g) | VS/TS | TWRM (g) | TS concentration (g TS L−1) | VS concentration (g VS L−1) |
|---|---|---|---|---|---|---|
| a TWRM = total weight of the raw material. | ||||||
| 1 | 24.38 | 16.53 | 67.80 | 401.95 | 61.93 | 41.32 |
| 2 | 21.33 | 13.48 | 63.20 | 405.91 | 53.63 | 33.69 |
| 3 | 20.54 | 12.69 | 61.78 | 397.39 | 51.45 | 31.72 |
| 4 | 19.75 | 11.90 | 60.25 | 397.04 | 49.12 | 29.76 |
| 7 | 19.42 | 11.57 | 59.58 | 397.71 | 48.55 | 28.92 |
| 10 | 18.76 | 10.91 | 58.16 | 395.24 | 47.38 | 27.50 |
| 12 | 17.99 | 10.14 | 56.36 | 392.90 | 44.8 | 25.34 |
| 14 | 17.98 | 10.13 | 56.34 | 394.00 | 44.25 | 25.32 |
| 18 | 16.98 | 9.13 | 53.77 | 382.90 | 42.48 | 22.82 |
The changes in TS and VS contents and VS/TS ratio with time are shown in Fig. 1. The hydrolytic process was faster during the first few days owing to the rapid hydrolysis of the easily hydrolyzable organic particles, subsequently, the less biodegradable organic particles were hydrolyzed.
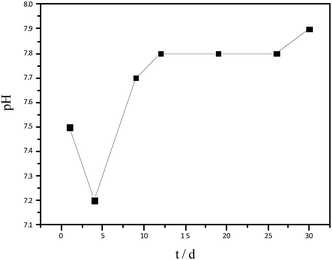
The variation in pH of hydrolysate has been shown in Fig. 2. At the beginning of hydrolysis, a slight acidification occurred, therefore, the pH of the hydrolysate reduced to 7.2. With time, the production of acid was inhibited and thereby the pH increased again, reaching a steady value of 7.9 on day 12. The pH, maintained between 7.2–7.9, was within the normal range for AD.
3.2 Hydrolysis constants
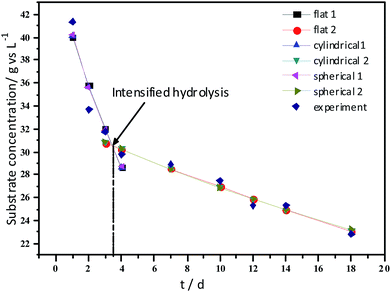
Experimental results and hydrolysis constants for the flat, cylindrical, and spherical models. The hydrolysis rate constants of the three models—flat, cylindrical, and spherical—were calculated according to the changes in the concentration of degradable organic particle (Fig. 3); which were 0.02947 d−1 (r = 0.8962), 0.03423 d−1 (r = 0.9030), and 0.03665 d−1 (r = 0.9072), respectively. The spherical model presented the best fit between the experimental and theoretical values. This demonstrates that these hydrolysis kinetic models can't effectively reveal the whole hydrolysis process of elephant grass. A deviation between the experimental and theoretical values occurred because of the disparity of hydrolysis rates in the process. There was an obvious inflection point on day 3.5 during the hydrolysis of elephant grass. This could be ascribed to that the major components of elephant grass including cellulose, hemicellulose and lignin play an important role in determining the hydrolysis rate.26 Cellulose could be hydrolyzed to glucose whereas, the hydrolysis of hemicellulose yields xylose, arabinose, glucose, mannose and galactose. Thus, the hydrolysis rate constant of oligosaccharide and some easily hydrolysable hemicellulose of elephant grass was high, while that of cellulose and hardly hydrolyzable hemicellulose was low. However, it is almost impossible to hydrolyze lignin. Therefore, in order to reflect the reaction process more accurately, the hydrolysis process was attempted to be modeled by a two-step approach with piecewise fitting using the three models (Fig. 4–7); the two steps were denoted as the first and second hydrolyses.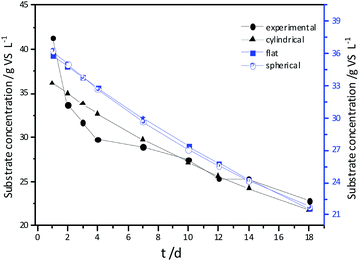 | ||
| Fig. 3 Experimental results and hydrolysis constants for the flat, cylindrical and spherical models. | ||
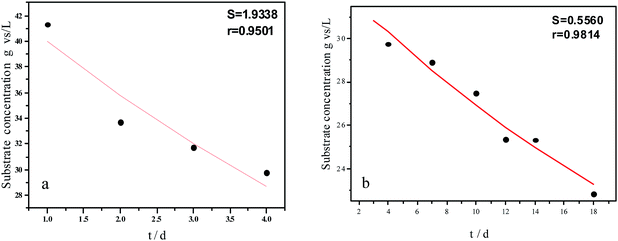 | ||
| Fig. 5 Hydrolysis constants for the first (a) and second hydrolysis processes (b) for the flat model. | ||
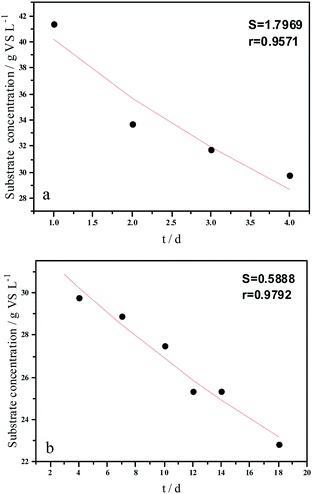 | ||
| Fig. 6 Hydrolysis constants for the first (a) and second hydrolysis processes (b) for the cylindrical model. | ||
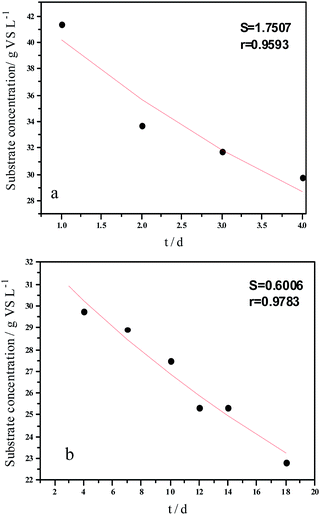 | ||
| Fig. 7 Hydrolysis constants for the first (a) and second hydrolysis processes (b) for the spherical model. | ||
The experimental results and hydrolysis rate constants obtained using the theoretical models for elephant grass showed the following: first, the theoretical values exhibited a good curve-fit (the expected values were similar to the experimental values). Second, the first and second hydrolysis rate constants can be obtained by notable inflection of the hydrolysis rate constants on day 3.5. Before 3.5 d, the hydrolysis rate constant was high because of the rapid hydrolysis of the easily hydrolysable organic particles, such as oligosaccharide and some easily hydrolyzable hemicellulose, thus, the VS concentration decreased significantly during this period. Subsequently, the cellulose and hardly hydrolyzable hemicellulose began to be hydrolyzed and hence the hydrolysis rate decreased after 3.5 d, therefore, the decreasing trend of VS concentration became slower. From Table 1, a conclusion can be obtained that, 3.5 d before hydrolysis, the degradation ratio of the VS reached 27.89%, which was 62.30% that of the whole hydrolysis process. After 3.5 d, the hydrolysis rate dropped with the accumulation of hardly degradable organics, such as lignin. Therefore, the intersection of the two stages due to the disparity of hydrolysis rates in the process can be considered as the secondary reinforcement (intensified hydrolysis) point for elephant grass hydrolysis. Measures such as the addition of alkali or acid to the solid of the fermentation can be taken at this point to accelerate the hydrolysis process, this will be evaluated by us in the future. The hydrolysis rate constants of elephant grass for the first and second hydrolysis processes can be calculated from the three models (Fig. 5–7) as shown in Table 2. According to the results calculated from the spherical model, the hydrolysis rate constant of elephant grass was fast as much as 0.1376 d−1 before 3.5 d and thereafter reduced to 0.02183 d−1.
| Hydrolysis parameter | Models | ||||
|---|---|---|---|---|---|
| Flat model | Cylindrical model | Spherical model | |||
| a k1 and k2 are the first and second hydrolysis rate constants, respectively. r is the correlation coefficient. | |||||
| Before 3.5 d | Hydrolysis constant (d−1) | k1 | 0.1111 | 0.1300 | 0.1376 |
| r | 0.9501 | 0.9571 | 0.9593 | ||
| After 3.5 d | Hydrolysis constant (d−1) | k2 | 0.0191 | 0.0211 | 0.02183 |
| r | 0.9814 | 0.9792 | 0.9783 | ||
4 Conclusions
In the present study, the hydrolysis dynamics of elephant grass was investigated by a two-step approach. Three models were used to fit the hydrolysis rate constants—flat, spherical, and cylindrical models. The curve fits of the three models for elephant grass hydrolysis dynamics to the measured data suggested that the spherical model was the optimal one with the first and second hydrolysis rate constants of 0.1376 (r = 0.9593) and 0.02183 (r = 0.9783), respectively. In addition, the secondary reinforcement point for the hydrolysis of elephant grass (3.5 d) caused by a disparity of hydrolysis rates in the process was also determined to accelerate the hydrolysis process, this might play an important role in accelerating the hydrolysis of elephant grass. The findings of the present study might form the basis for the AD of energy grasses, especially elephant grass. Furthermore, the findings might benefit studies on elephant grass hydrolysis process, thus promoting its application in biogas industry as an alternative biofuel.Conflicts of interest
There are no conflicts to declare.Acknowledgements
The study was supported by the National Key Research and Development Program of China (2017FYD0800801); Bureau of International Cooperation, Chinese Academy of Sciences (182344KYSB20170009); Science and Technology Planning Project of Guangdong Province (2017A050501049, 2017B020238002); Natural Science Foundation of Guangdong (2017A030310280) and Science and Technology Program of Guangzhou (201707010201).References
- G. Zhen, X. Lu, T. Kobayashi, Y.-Y. Li, K. Xu and Y. Zhao, Appl. Energy, 2015, 148, 78–86 CrossRef.
- M. Pérez-Boada, A. Prieto, P. Prinsen, M.-P. Forquin-Gomez, J. C. del Río, A. Gutiérrez, Á. T. Martínez and C. B. Faulds, Bioresour. Technol., 2014, 167, 469–475 CrossRef PubMed.
- P. Prinsen, A. Gutiérrez and J. C. del Río, J. Agric. Food Chem., 2012, 60, 6408–6417 CrossRef PubMed.
- D. Pimentel and T. W. Patzek, Nat. Resour. Res., 2005, 14, 65–76 CrossRef.
- T. Březinová and J. Vymazal, Ecol. Eng., 2015, 80, 62–68 CrossRef.
- X. Zhao, L. Zhang and D. Liu, Biotechnol. J., 2010, 5, 493–504 CrossRef PubMed.
- C. Somerville, H. Youngs, C. Taylor, S. C. Davis and S. P. Long, Science, 2010, 329, 790–792 CrossRef PubMed.
- R. A. Flores, S. Urquiaga, B. J. R. Alves, L. S. Collier and R. M. Boddey, Eng. Agric., 2012, 32, 831–839 Search PubMed.
- R. Saikia, B. Baruah, D. Kalita, K. K. Pant, N. Gogoi and R. Kataki, Bioresour. Technol., 2018, 253, 304–314 CrossRef PubMed.
- M. Zeng, E. Ximenes, M. R. Ladisch, N. S. Mosier, W. Vermerris, C. P. Huang and D. M. Sherman, Biotechnol. Bioeng., 2012, 109, 390–397 CrossRef PubMed.
- G. Koçar and N. Civaş, Renewable Sustainable Energy Rev., 2013, 28, 900–916 CrossRef.
- M. P. Robbins, G. Evans, J. Valentine, I. S. Donnison and G. G. Allison, Prog. Energy Combust. Sci., 2012, 38, 138–155 CrossRef.
- F. Cattaneo, P. Di Gennaro, L. Barbanti, C. Giovannini, M. Labra, B. Moreno, E. Benitez and C. Marzadori, Appl. Soil Ecol., 2014, 84, 213–222 CrossRef.
- L. Lianhua, Z. Feng, S. Yongming, Y. Zhenhong, K. Xiaoying, Z. Xianyou and N. Hongzhi, Bioresour. Technol., 2014, 173, 439–442 CrossRef PubMed.
- N. T. Xuyen, D. P. V. Sanchez, T. H. Kim, H. Il Park, M. Yun and Y. H. Lee, J. Mater. Chem., 2010, 20, 5468–5473 RSC.
- G. Yang and J. Wang, Bioresour. Technol., 2018, 255, 7–15 CrossRef PubMed.
- R. Borja, A. Martin, E. Sanchez, B. Rincón and F. Raposo, Process Biochem., 2005, 40, 1841–1847 CrossRef.
- A. Valentini, G. Garuti, A. Rozzi and A. Tilche, Water Sci. Technol., 1997, 36, 239–246 CrossRef.
- W. Hu, K. Thayanithy and C. Forster, Process Biochem., 2002, 37, 965–971 CrossRef.
- V. A. Vavilin, S. V. Rytov and L. Y. Lokshina, Bioresour. Technol., 1996, 56, 229–237 CrossRef.
- B. E. Rotter, D. A. Barry, J. I. Gerhard and J. S. Small, Bioresour. Technol., 2008, 99, 5738–5748 CrossRef PubMed.
- P. Biernacki, S. Steinigeweg, A. Borchert and F. Uhlenhut, Bioresour. Technol., 2013, 127, 188–194 CrossRef PubMed.
- A. Sluiter, B. Hames, R. Ruiz, C. Scarlata, J. Sluiter, D. Templeton and D. Crocker, Technical Report NREL, 2008, TP-510-42618 Search PubMed.
- APHA, Standard Methods for the Examination of Water and Wastewater, American Public Health Association, DC, USA, 18th edn, 1998 Search PubMed.
- L. Guotao, P. Xuya, L. Tengrui, J. Chuanxin, W. Xiang and C. Zhijian, Acta Sci. Circumstantiae, 2007, 27, 1227–1232 Search PubMed.
- W. Prapinagsorn, S. Sittijunda and A. Reungsang, Energies, 2017, 10, 1654 CrossRef.
| This journal is © The Royal Society of Chemistry 2018 |

