 Open Access Article
Green synthesis of amphiphilic carbon dots from organic solvents: application in fluorescent polymer composites and bio-imaging†
Jiangjiang Gu a,
Xinle Lib,
Donghua Hua,
Yanfeng Liua,
Guiyang Zhanga,
Xudong Jiaa,
Wenyu Huang
 *b and
Kai Xi
 *a
*a
aDepartment of Polymer Science & Engineering, Nanjing University, Nanjing 210093, PR China. E-mail: xikai@nju.edu.cn
bDepartment of Chemistry, Iowa State University, Ames, Iowa 50011, USA. E-mail: whuang@iastate.edu
First published on 3rd April 2018
Abstract
Carbon dots (CDs) have sparked tremendous attention due to their unique properties and vast potential in diverse fields. Herein, we report a green and cost-effective hydrothermal route for the synthesis of a series of CDs from readily available organics solvents. Since the organics were completely recyclable after the separation of CDs, this method holds immense potential for the large-scale synthesis of CDs. We found the DMF-CDs and DMAc-CDs possessed amphiphilicity and the diameter of amphiphilic DMF-CDs was ca. 3.5 nm with a narrow distribution. Moreover, these amphiphilic CDs emitted blue light under UV irradiation (365 nm) and the quantum yield could reach more than 30%. Due to their good solubility in organic solvent, DMF-CDs were successfully imbedded into polymers (i.e., PS and PMMA), which revealed their potential in painting, coating, and optical devices. In addition, benefiting from high quantum yield and low cytotoxicity, the DMF-CDs in aqueous media were used as fluorescent probes in living cells, which demonstrated their great potential in bio-imaging.
1. Introduction
Carbon dots (CDs) or carbon quantum dots, with a typical diameter below 10 nm, have emerged as potent metal-free fluorescent nanomaterials in the past decade. Due to their electronic transfer property,1 bandgap transitions,2 and surface defects,3 CDs exhibit an emission dependence on the excitation wavelength or surface passivation.4 Compared to the conventional semiconductor quantum dots,5 CDs possess the distinctive advantages of chem high biocompatibility,6 good water-solubility, low cytotoxicity,7 functional diversity,8 convenient synthesis, and low cost.9 A great deal of research endeavors have been devoted to the synthesis of CDs. A myriad of top-down approaches have been developed for the synthesis of CDs. However, these methods typically require toxic chemical reagents and special equipment (e.g., microwave irradiation,10 laser ablation,11 etc.) in the exfoliation process. Instead, bottom-up approaches, such as sovlothermal carbonization of glucose, chitosan, glycol, and citric acids, have spurred significant attention recently.12 Despite significant advances have been made in this area, it is of continuous and considerable interest to develop fluorescent CDs in an efficient, facile and green manner.On the other hand, CDs have been widely exploited in biological applications such as cell imaging,13 biosensors,14 ions testing,15 and drug delivery,16 because of their good biocompatibility, robust chemical stability, and high resistance to photobleaching. In these applications CDs were designed to be soluble in aqueous media.
Besides aforementioned biological applications by water-soluble CDs, amphiphilic CDs, which receive relative less attention, could open up new applications in hydrophobic environments as well. For example, considering the excellent photoluminescence, low cost and biocompatibility, CDs are excellent alternative of current organic printing dyes in printing industries. However, the current methods for the synthesis of amphiphilic CDs are always associated with low yield and high cost, which severely restrains their further utilization in printing, fluorescent composites synthesis and biology related applications.
In this context, we report the synthesis of a series of CDs through a facile, one-step hydrothermal treatment of N,N′-dimethylformamide (DMF), N,N′-dimethylacetamide (DMAc) and other organic solvents. With this approach, amphiphilic DMF-CDs were achieved with simultaneous surface passivation and tunable fluorescence emission. This synthetic route offers multiple advantages. First, it represents a rare example of simple synthesis of amphiphilic CDs from the readily available organic solvents for the first time, which is an appealing approach from the perspective of energy and cost. Remarkably, the organic solvents were completely recyclable after the separation of CDs and by-products were not observed, which could achieve high atomic efficiency, one of the core focuses in green chemistry. Last, the surface passivation of DMF-CDs took place simultaneously in the hydrothermal process, rendering intrinsic fluorescence emission. Due to the good solubility in polar organic solvents (i.e., DMF), the as-synthesized DMF-CDs could be easily doped into polymer materials and the resultant CDs-polymers composites exhibit high fluorescent properties. Furthermore, the DMF-CDs demonstrate excellent biocompatibility and there is no appreciable cytotoxicity observed.
2. Experimental
2.1. Chemicals and materials
N,N′-dimethylformamide (DMF), xylene, N,N′ dimethylacetamide (DMAc), n-hexane and cyclohexane were purchased from Sinopharm Chemical Reagent Co. Ltd. (Shanghai, China). Polystyrene (PS) and polymethyl methacrylate (PMMA) were purchased from Aladdin (California, USA). MCF-7 cells were obtained from the Institute of Biochemistry and Cell Biology, Shanghai Institute for Biological Sciences of Chinese Academy of Science (Shanghai, China). Distilled water was used in all the experiment. All the chemicals were used without further purification.2.2. Synthesis of the amphiphilic CDs
Typically, DMF (20 mL) was added to a polyphenol autoclave (50 mL) and heated at 260 °C for 12 hours. After solvothermal reaction, the autoclave was cooled to room temperature and the solution was rotary evaporated to obtain CDs. The distillate was collected to recycle the reagents for the successive runs. The other CDs were synthesized by analogous procedures in which DMF was replaced by DMAc, xylene, n-hexane and cyclohexane.2.3. Characterization of amphiphilic CDs
Transmission electron microscopy (TEM) and high-resolution transmission electron microscopy (HRTEM) images were recorded on JEOL JEM-1011 and JEOL JSM-2100, respectively. The CDs were drop-cast onto 400-mesh carbon-coated Cu grids followed by drying in open air at room temperature. The fluorescence spectra of the CDs were recorded on a FluoroMax-4 spectrofluorometer (Horiba Scientific, Japan). X-ray diffraction (XRD) pattern was performed by using a D8 Advance X-ray diffractometer (Bruker) with Cu Kα radiation. Raman spectra were acquired on a Lab RAM Aramis spectrometer (Horiba Scientific, Japan). Fourier transform infrared (FTIR) spectra were measured on Vector-22 spectrometer (Bruker) ranging from 500 to 4000 cm−1, and the samples were dispersed in KBr pellets. Ultraviolet-visible (UV-vis) absorption of the CDs solution was obtained using an UV-1800(PC) UV-vis spectrophotometer (Mapada). X-ray photoelectron spectroscopy (XPS) measurements were performed on a PHI 5000 VersaProbe spectrometer (UlVAC-PHI, Japan). The fluorescence confocal images were obtained using a Leica TCS SP5 confocal scanning microscope (Leica Microsystems, Heidelberg GmbH, Mannheim, Germany). The specimens were excited at 488 nm, and the emission was detected from 500 to 530 nm.2.4. Preparation of DMF-CDs-polymer composite
0, 0.04, 0.16 and 0.2 mg of DMF-CDs were separately added into 5 mL of DMF together with 1 g of PMMA or PS. After the polymer was dissolved, the solution was transferred into a watch glass and dried at 60 °C.2.5. Cell imaging of DMF-CDs
MCF-7 cells were incubated in the plates with glucose and 1 mL Dulbecco's modified Eagle's medium (DMEM) at 37 °C for 24 h. 0.25 mL of DMF-CDs aqueous solution (3 mg mL−1) was added into the medium and the final concentration of DMF-CDs were 0.6 mg mL−1. The cells were cultured with the CDs at 37 °C for 2 h, and washed with the physiological extracellular buffer (ECB: 135 mM NaCl, 5 mM KCl, 1 mM CaCl2, 1 mM MgCl2, 10 mM HEPES, and 10 mM glucose, pH 7.4) for three times prior to taking the fluorescence image. The fluorescence intensity of the cells was measured using the fluorescence confocal microscope.2.6. Cell toxicity of DMF-CDs
MCF-7 cells (105 cells per mL) in DMEM with glucose were cultured in a 96-well microplate (100 μL per well) for 6 h at 37 °C with 5% CO2. Then 100 μL of the DMF-CDs solution with different concentrations was introduced into the microplate to acquire the final concentrations of 1, 10, 100, 1000 μg mL−1 for the culturing of cells for 24 h. The cells were washed with phosphate-buffered saline (PBS, pH 7.4). 20 μL of 5 mg mL−1 MTT and 100 μL of DMEM were added to cell wells for 4 h. After removing the culture medium with MTT, 150 μL of DMSO was added. The obtained mixture was shaken for 10 min at room temperature. The optical density (OD) of the mixture was measured at 490 nm in the En-Spire multimode plate reader. The cell viability was calculated according to the given equation:where ODs and ODc refer to OD of samples and control groups, respectively.
2.7. Quantum yield measurements
The quantum yield of amphiphilic CDs was measured by the equation below:where s and r refer to sample and reference. The reference quinine sulfate was dissolved in 0.1 M H2SO4, of which the quantum yield was 0.54 at 360 nm.17 I is the integrated emission intensity of fluorescent spectra from 380 to 700 nm at the excited wavelength of 360 nm. A represents UV-vis absorbance at 360 nm, which is from 0.1 to 0.01 in the 1 cm quartz absorbance cell. η refers to the refractive index which is listed in Table S1 of the ESI†.
2.8. Stability test of DMF-CDs
1 mL of DMF-CDs solution (0.2 mg mL−1) was diluted by 2 mL of distilled water, which serves as the blank sample. Also 2 mL of DMF-CDs solution (0.2 mg mL−1) was diluted by 2 mL HCl (0.2 mg mL−1), sodium hydroxide solution (0.2 mg mL−1), 5 mg mL−1 ferric nitrate solution, and 5 mg mL−1 copper sulfate solution, separately. As a result, the five samples were DMF-CDs solution (0.1 mg mL−1) with blank, HCl (pH 1), NaOH (pH 13), Fe(NO3)3 (2.5 mg mL−1), and Cu(NO3)2 (2.5 mg mL−1) solution. Then the fluorescent emission spectra of the above samples was tested and compared.3. Results and discussion
Following the procedure depicted in Scheme 1, we prepared a variety of CDs from different organic solvents (Table S2†), implying the generality of this method. We speculate that the formation of CDs involves three steps, including decomposition, oxidation/carbonization, and surface passivation. Taking DMF-CDs as a representative example, DMF was decomposed into carbon monoxide and dimethylamine in the first step.18 Since the autoclave was airtight and the temperature was high, the decomposition products of DMF molecules was oxidized, carbonized and turned into CDs directly.19 Finally, the external surface of CDs was passivated via covalent bonding of amine-containing agents.20 The effect of hydrothermal temperature on the formation of CDs was explored. As shown in Fig. S1† (ESI), the lower temperature led to the decrease of fluorescence, while no fluorescence was observed when the reaction temperature was 120 °C. This result indicated that the temperature played a key role in the formation of CDs. | ||
| Scheme 1 Schematic illustration of the preparation of DMF-CDs and the cyclic process of DMF and DMF-CDs. | ||
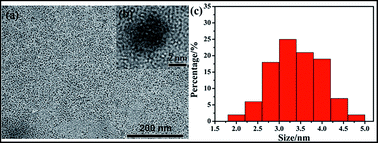
We found that the synthesized DMF-CDs were small and monodisperse, as revealed by transmission electron microscopy (TEM) image in Fig. 1a. No lattice structure was observed in the HRTEM image (Fig. 1b), indicating amorphous dots were formed. Fig. 1c showed the average diameter of the CDs is 3.5 ± 1.0 nm by measuring 100 particles. The XRD pattern of DMF-CDs (Fig. S2, ESI†) showed a broad diffraction peak at 27.3°, which revealed the amorphous crystal structure of DMF-CDs and conformed to the result of HRTEM.21 Raman spectra exhibited weak D band at around 1314 cm−1 and strong G band at 1600 cm−1 (Fig. S3, ESI†), which were related to sp3 carbon and the stretching vibration of C![[double bond, length as m-dash]](https://www.rsc.org/images/entities/char_e001.gif) C bonds, respectively.22 This result indicated the hybrid form of the carbon atoms in DMF-CDs was mainly disordered sp2.23
C bonds, respectively.22 This result indicated the hybrid form of the carbon atoms in DMF-CDs was mainly disordered sp2.23
The fluorescence spectra of the solution were measured to investigate the optical property of DMF-CDs. Under ultraviolet (UV) illumination at 365 nm, DMF-CDs showed an intense blue color (Fig. S4b, ESI†), indicating DMF-CDs had a good fluorescent property. The fluorescence spectra of the solution displayed wavelength-dependent excitation and broad emissions (Fig. S4c, ESI†).4 With the excitation wavelength increasing from 320 to 440 nm, the emission wavelength increased from 420 to 500 nm. Such excitation-dependent photo luminescent behavior was consistent with previously reported CDs, which was probably due to the defect sites from the surface passivation.4a The quantum yields of the CDs were summarized in Table S2.† The DMF-CDs and DMAc-CDs exhibited the high yields of 33.9% and 31.8%, which were superior to CDs derived from organic solvents in the previous reports (Table S3, ESI†). On the contrary, the quantum yields of CDs prepared from other nitrogen-free solvents (i.e., xylene, n-hexane and cyclohexane) were much lower (<13%, Table S2, ESI†). Given the fact that quantum yield of CDs are readily influenced by the composition,24 we infer that the intrinsic nitrogen in DMF and DMAc could account for the high quantum yields of DMF-CDs and DMAc-CDs.25
In an effort to explore the chemical structure and functional groups on DMF-CDs, UV-vis and FT-IR analyses were performed. The UV-vis absorption spectrum of DMF-CDs had a strong peak centered at 320 nm (Fig. 2a), typically corresponding to the n–p* transition of the C![[double bond, length as m-dash]](https://www.rsc.org/images/entities/char_e001.gif) O bond.26 The FTIR spectrum of DMF-CDs (Fig. 2b) shows an intense peak at 1600 cm−1, indicating the stretch vibration of carbonyl groups. Additionally, the peaks of other functional groups can be observed in DMF-CDs spectrum, evidenced by their characteristic vibrations centered at 3420 cm−1 (O–H stretching), 2920 cm−1 (sp3 C–H stretch), 1380 cm−1 (sp3 C–H bending) and 1270 cm−1(C–O stretching). To gain a further insight of the surface composition of CDs, XPS analyses were conducted and the DMF-CDs displayed much lower nitrogen content than DMF in the overall XPS spectra (Fig. 2c). The atomic ratio of N/C in DMF is 1/3 and it became very low in DMF-CDs. The XPS of C1s spectrum (Fig. 2d) was deconvoluted into three bands with the binding energy of 284.6, 286, 286.6 eV, corresponding to C
O bond.26 The FTIR spectrum of DMF-CDs (Fig. 2b) shows an intense peak at 1600 cm−1, indicating the stretch vibration of carbonyl groups. Additionally, the peaks of other functional groups can be observed in DMF-CDs spectrum, evidenced by their characteristic vibrations centered at 3420 cm−1 (O–H stretching), 2920 cm−1 (sp3 C–H stretch), 1380 cm−1 (sp3 C–H bending) and 1270 cm−1(C–O stretching). To gain a further insight of the surface composition of CDs, XPS analyses were conducted and the DMF-CDs displayed much lower nitrogen content than DMF in the overall XPS spectra (Fig. 2c). The atomic ratio of N/C in DMF is 1/3 and it became very low in DMF-CDs. The XPS of C1s spectrum (Fig. 2d) was deconvoluted into three bands with the binding energy of 284.6, 286, 286.6 eV, corresponding to C![[double bond, length as m-dash]](https://www.rsc.org/images/entities/char_e001.gif) C/C–C, C–N, and C
C/C–C, C–N, and C![[double bond, length as m-dash]](https://www.rsc.org/images/entities/char_e001.gif) O, respectively. The N1s spectrum (Fig. S5a, ESI†) exhibited two peaks at 400.2 and 398.6 eV, which were assigned to N–H and C–N–C groups, respectively. For the O1s spectrum of DMF-CDs (Fig. S5b, ESI†), the two peaks at 530.4 and 529.6 eV were attributed to C–OH/C–O–C and C
O, respectively. The N1s spectrum (Fig. S5a, ESI†) exhibited two peaks at 400.2 and 398.6 eV, which were assigned to N–H and C–N–C groups, respectively. For the O1s spectrum of DMF-CDs (Fig. S5b, ESI†), the two peaks at 530.4 and 529.6 eV were attributed to C–OH/C–O–C and C![[double bond, length as m-dash]](https://www.rsc.org/images/entities/char_e001.gif) O, respectively. On the basis of the combined results from UV-vis, FTIR and XPS measurements, the as-prepared DMF-CDs have various functional groups such as N–H, C–O–C, C
O, respectively. On the basis of the combined results from UV-vis, FTIR and XPS measurements, the as-prepared DMF-CDs have various functional groups such as N–H, C–O–C, C![[double bond, length as m-dash]](https://www.rsc.org/images/entities/char_e001.gif) O on the external surface due to the surface passivation with DMF during the synthesis. These functional groups impart good amphiphilic properties of DMF-CDs without further chemical modification.
O on the external surface due to the surface passivation with DMF during the synthesis. These functional groups impart good amphiphilic properties of DMF-CDs without further chemical modification.
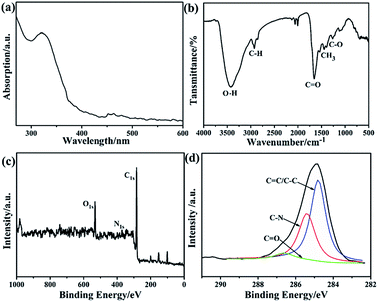 | ||
| Fig. 2 (a) UV-vis absorption and (b) FT-IR spectra of DMF-CDs; (c) XPS survey of DMF-CDs; (d) XPS fitting of C1s in DMF-CDs. | ||
In order to investigate the chemical stability and the effect of metal ions on the emission of the DMF-CDs, we measured their fluorescence under different pH or in the presence of Fe3+/Cu2+ ions. As shown in Fig. 3, there is no significant loss (less than 5%) in the fluorescence intensity of DMF-CDs. The result showed that the DMF-CDs possessed high ion and pH stability and could emit stable fluorescence in different solutions.
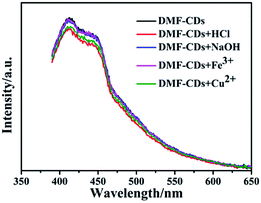 | ||
| Fig. 3 Emission spectra (excited at 360 nm) of DMF-CDs in hydrochloric acid, sodium hydroxide, ferric nitrate and copper sulphate solutions. | ||
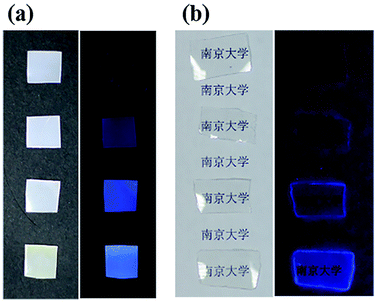
Since the DMF-CDs were synthesized in/from DMF, the DMF-CDs are readily soluble in DMF. Considering DMF is a good solvent for dissolving polymers, we resort to dope CDs into polymers, such as polymethylmethacrylate (PMMA) and polystyrene (PS), with the aim to explore the potential of using amphiphilic CDs as fluorescent inks. As shown in Fig. 4, PS and PMMA films emit blue light after loading CDs. Increasing the concentration of DMF-CDs lead to enhanced intensity of emitting light from the polymers. No fluorescence light was observed from the bare polymers, indicating the DMF-CDs are the only fluorescence source. Impressively, these CDs-polymer composites are highly stable and emitted blue fluorescent light without obvious decay even after one year. The addition of hydrochloric acid, sodium hydroxide, ferric nitrate and copper sulfate solution, had negligible effect on the intensity of fluorescence. On the basis of the above results, the DMF-CDs-polymer composites were quite stable in different solutions. All these results uncover the important potential of DMF-CDs as promising ink for printing.
By virtue of their strong fluorescence and tunable excitation and emission wavelength, CDs emerged as promising candidates in optical bio-imaging. We sought to evaluate the cytotoxicity of the DMF-CDs, which have the highest quantum yield in the present study. The DMF-CDs were dispersed into water with ultrasonic treatment for 10 min to obtain the aqueous CD solution. Notably, the photoluminescence emission spectra and particle size of DMF-CDs did not show obvious changes in H2O compared to that in DMF (Fig. S6 and S7, ESI†). DMF-CDs were introduced into the cells and the cells emitted green light upon 490 nm excitation (Fig. 5). The observation of fluorescence at cells confirmed that the DMF-CDs were water-soluble, and could be uptaken into the cells. The cytotoxicity of the carbon dots was tested (Fig. S8, ESI†) and the DMF-CDs rendered extremely low toxicity below 100 μg mL−1. In addition, there was no obvious morphological cell change observed after incubation with the CDs, further demonstrating their prominent biocompatibility. The abovementioned results unambiguously imply that the DMF-CDs, featuring low toxicity and high quantum yield, hold great potential in biological applications, such as bio-imaging and protein analysis by deposit.
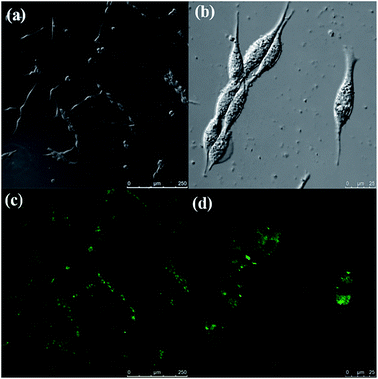 | ||
| Fig. 5 Representative (a and b) bright field and (c and d) fluorescence microphotographs of MCF-7 cells labelled with DMF-CDs. | ||
4. Conclusions
In conclusion, we have successfully prepared a series of CDs via a green one-step hydrothermal synthesis route without any catalyst, additives or by-products in a recycle manner. Among the CDs series, DMF- and DMAc-CDs possess amphiphilic feature and enhanced quantum yields, presumably due to the presence of nitrogen. The prepared DMF-CDs have small size with a narrow size distribution. Moreover, the oxygen/nitrogen doped structure derived from simultaneous surface passivation endows them with strong and excitation-dependent fluorescence. Due to the amphiphilic feature, remarkable luminescence stability, and good biocompatibility, DMF-CDs could be readily doped into the polymers and the robust CDs-polymers composites exhibited high fluorescence. Additionally, the DMF-CDs were appropriately uptaken by cells with low cytotoxicity, thus demonstrating their potential for fluorescent cellular imaging. This green method opens up fascinating opportunities for the large-scale synthesis of CDs with the immense potential in fluorescent composites synthesis and biological imaging.Conflicts of interest
There are no conflicts of interest to declare.Acknowledgements
This study was supported by the Fundamental Research Funds for the Central Universities (No. 1104020505, 020514380111) and the Postgraduate Research and Innovation Project of Jiangsu Province (2014, No. KYLX_0030).Notes and references
- V. Strauss, J. T. Margraf, C. Dolle, B. Butz, T. J. Nacken, J. Walter, W. Bauer, W. Peukert, E. Spiecker, T. Clark and D. M. Guldi, J. Am. Chem. Soc., 2014, 136, 17308 CrossRef CAS PubMed.
- G. Eda, Y.-Y. Lin, C. Mattevi, H. Yamaguchi, H.-A. Chen, I. S. Chen, C.-W. Chen and M. Chhowalla, Adv. Mater., 2010, 22, 505 CrossRef CAS PubMed.
- J. Shen, Y. Zhu, C. Chen, X. Yang and C. Li, Chem. Commun., 2011, 47, 2580 RSC.
- (a) Y.-P. Sun, B. Zhou, Y. Lin, W. Wang, K. A. S. Fernando, P. Pathak, M. J. Meziani, B. A. Harruff, X. Wang, H. Wang, P. G. Luo, H. Yang, M. E. Kose, B. Chen, L. M. Veca and S.-Y. Xie, J. Am. Chem. Soc., 2006, 128, 7756 CrossRef CAS PubMed; (b) Y. Song, S. Zhu and B. Yang, RSC Adv., 2014, 4, 27184 RSC.
- A. P. Alivisatos, Science, 1996, 271, 933 CAS.
- (a) D. Hazarika and N. Karak, Green Chem., 2016, 18, 5200 RSC; (b) J. Gu, W. Wang, Q. Zhang, Z. Meng, X. Jia and K. Xi, RSC Adv., 2013, 3, 15589 RSC.
- J. Gu, D. Hu, W. Wang, Q. Zhang, M. Zhen, X. Jia and X. Kai, Biosens. Bioelectron., 2015, 68, 27 CrossRef CAS PubMed.
- A. M. Craciun, A. Diac, M. Focsan, C. Socaci, K. Magyari, D. Maniu, I. Mihalache, L. M. Veca, S. Astilean and A. Terec, RSC Adv., 2016, 6, 56944 RSC.
- (a) X. Zhou, S. Guo, P. Zhong, Y. Xie, Z. Li and X. Ma, RSC Adv., 2016, 6, 54644 RSC; (b) A. A. Ensafi, S. H. Sefat, N. Kazemifard, B. Rezaei and F. Moradi, Sens. Actuators, B, 2017, 253, 451 CrossRef CAS.
- H. Zhu, X. Wang, Y. Li, Z. Wang, F. Yang and X. Yang, Chem. Commun., 2009, 5118 RSC.
- S.-L. Hu, K.-Y. Niu, J. Sun, J. Yang, N.-Q. Zhao and X.-W. Du, J. Mater. Chem., 2009, 19, 484 RSC.
- (a) Z.-C. Yang, M. Wang, A. M. Yong, S. Y. Wong, X.-H. Zhang, H. Tan, A. Y. Chang, X. Li and J. Wang, Chem. Commun., 2011, 47, 11615 RSC; (b) S. Sahu, B. Behera, T. K. Maiti and S. Mohapatra, Chem. Commun., 2012, 48, 8835 RSC; (c) Y. Yang, J. Cui, M. Zheng, C. Hu, S. Tan, Y. Xiao, Q. Yang and Y. Liu, Chem. Commun., 2012, 48, 380 RSC; (d) M. Zhou, Z. Zhou, A. Gong, Y. Zhang and Q. Li, Talanta, 2015, 143, 107 CrossRef CAS PubMed.
- B. Kong, A. Zhu, C. Ding, X. Zhao, B. Li and T. Yang, Adv. Mater., 2012, 24, 5844 CrossRef CAS PubMed.
- (a) Y. Wang, W. Qi and Y. Song, Chem. Commun., 2016, 52, 7994 RSC; (b) M. Li, F. Xu, H. Li and Y. Wang, Catal. Sci. Technol., 2016, 6, 3670 RSC; (c) Q. Lu, J. Deng, Y. Hou, H. Wang, H. Li, Y. Zhang and S. Yao, Chem. Commun., 2015, 51, 7164 RSC.
- (a) Z. Yang, X. Zheng, Z. Li and J. Zheng, Analyst, 2016, 141, 4757 RSC; (b) G. Li, N. Lv, W. Bi, J. Zhang and J. Nia, New J. Chem., 2016, 40, 10213 RSC.
- M. Zheng, S. Liu, J. Li, D. Qu, H. Zhao, X. Guan, X. Hu, Z. Xie, X. Jing and Z. Sun, Adv. Mater., 2014, 26, 3554 CrossRef CAS PubMed.
- W. H. Melhuish, J. Phys. Chem., 1961, 65, 229 CrossRef CAS.
- (a) J. Muzart, Tetrahedron, 2009, 65, 8313 CrossRef CAS; (b) S. Liu, J. Tian, L. Wang, Y. Zhang, Y. Luo, A. M. Asiri, A. O. Al-Youbi and X. Sun, RSC Adv., 2012, 2, 4632 RSC.
- (a) J. Deng, Q. Lu, N. Mi, H. Li, M. Liu, M. Xu, L. Tan, Q. Xie, Y. Zhang and S. Yao, Chem.–Eur. J., 2014, 20, 4993 CrossRef CAS PubMed; (b) J. Gu, D. Hu, J. Huang, X. Huang, Q. Zhang, X. Jia and K. Xi, Nanoscale, 2016, 8, 3973 RSC.
- (a) L. Sai, J. Chen, Q. Chang, W. Shi, Q. Chen and L. Huang, RSC Adv., 2017, 7, 16608 RSC; (b) J. Chen, Q. Wang, J. Zhou, W. Deng, Q. Yu, X. Cao, J. Wang, F. Shao, Y. Li, P. Ma, M. Spector, J. Yu and X. Xu, Nanoscale, 2017, 9, 10820 RSC.
- B. Fang, P. Wang, Y. Zhu, C. Wang, G. Zhang, X. Zheng, C. Ding, J. Gu and F. Cao, RSC Adv., 2018, 8, 7377 RSC.
- V. B. Kumar, A. K. Sahu, A. S. M. Mohsin, X. Li and A. Gedanken, ACS Appl. Mater. Interfaces, 2017, 9, 28930 CAS.
- W. Zhu, J. Zhang, Z. Jiang, W. Wang and X. Liu, RSC Adv., 2014, 4, 17387 RSC.
- (a) Y. Dong, H. Pang, H. B. Yang, C. Guo, J. Shao, Y. Chi, C. M. Li and T. Yu, Angew. Chem., Int. Ed., 2013, 52, 7800 CrossRef CAS PubMed; (b) X. Zhai, P. Zhang, C. Liu, T. Bai, W. Li, L. Dai and W. Liu, Chem. Commun., 2012, 48, 7955 RSC.
- J. Hou, W. Wang, T. Zhou, B. Wang, H. Li and L. Ding, Nanoscale, 2016, 8, 11185 RSC.
- C. Shen, Y. Sun, J. Wang and Y. Lu, Nanoscale, 2014, 6, 9139 RSC.
Footnote |
| † Electronic supplementary information (ESI) available. See DOI: 10.1039/c8ra01085d |
| This journal is © The Royal Society of Chemistry 2018 |


