 Open Access Article
Creative Commons Attribution 3.0 Unported Licence
Synthesis and plugging behavior of fluorescent polymer microspheres as a kind of conformance control agent in reservoirs
Hongbin Yang a,
Leilei Hu*b,
Chao Chena,
Yongbo Gaoa,
Xuechen Tanga,
Xia Yina and
Wanli Kang
 *a
*a
aSchool of Petroleum Engineering, China University of Petroleum (East China), Qingdao 266580, People's Republic of China. E-mail: kangwanli@126.com
bSchool of Environmental and Municipal Engineering, North China University of Water Resources and Electric Power, Zhengzhou 450045, People's Republic of China. E-mail: huleilei449@163.com
First published on 15th March 2018
Abstract
The fluorescent polymer microsphere is a newly developed chemical agent for conformance control in reservoirs. In this paper, one kind of fluorescent polymer microspheres P(AM-BA-RhB) was synthesized via the inverse suspension polymerization method with Rhodamine B as a fluorescence functional monomer. Laboratory experiments were performed to characterize the morphology, fluorescent property, swelling property and plugging behavior of fluorescent polymer microspheres. The experimental results showed that the polymer microspheres P(AM-BA-RhB) displayed stable fluorescence performance in solutions containing metal ions at pH values between 3.0 and 10.0. The swelling property was not dramatically affected by the Rhodamine B embedded in the polymer microspheres by grafting. Both a visual micromodel test and sand-pack tubes experiment demonstrated that the fluorescent polymer microspheres could pass directly or by deformation through porous media and get into the in-depth formation. The injection pressure showed the phenomenon of “Wave-type Variation”. Three plugging behaviors such as piston plugging, protruding plugging and fingering plugging were put forward. The introduction of fluorescent polymer microspheres could provide one method to research the conformance control and EOR mechanism of polymer microspheres in the reservoirs.
1. Introduction
According to previous reports, reservoirs with induced fractures or high permeability channels, commonly called thief zones or streaks due to extensive water flooding, are quite common in mature oil reservoirs. Low efficiency of the injected water, which would lead to excessive water production and rapid production decline, has become one of the most crucial problems in the late stage of development for mature oilfields.1–3 Therefore, it is important for the petroleum industry to develop more reliable techniques such as “green” water shut-off or conformance control. Gels have been introduced as water plugging agents to mitigate this problem.1,4–8 The gel application plug fractures and redirects water from high permeable zones to low-permeability areas. A new trend in gel treatments is using polymer microspheres since they can overcome some distinct drawbacks inherent in in situ gelation systems.9–12 The polymer microsphere is a kind of viscoelastic conformance control agent with three-dimensional structure and can absorb the formation water and migration in the porous medium of the reservoirs under the injection pressure.13–15 Field test results in Shengli, Dagang and Jidong Oilfields in China showed that polymer microsphere was a promising conformance control agent in the development of heterogeneous reservoirs, especially the fractured reservoirs.16–18 Hua and Lin et al. investigated the shape, size, rheological properties, plugging properties, profile control mechanism and oil displacement mechanism of the nanoscale polymer microspheres. They found that polymer microspheres could reduce water permeability because the microspheres adsorbed, accumulated and bridged in the pore throat, and the adsorbed layers would be collapsed under the pressure, entering deep into the reservoir due to the good deformation properties of the microspheres.13 Yao and Wang et al. researched the effects of ionic strength on the transport and retention of polyacrylamide microspheres in porous media.19 Yang and Kang et al. researched the mechanism and influencing factors on the initial particle size and swelling capability of polymer microspheres from the synthesis and reservoir condition.20 Yang and Xie et al. optimized the injection parameters of polymer microspheres and polymer composite flooding system, and they found that the composite system could better improve polymer flooding at the displacement rate of 3.5 m d−1 and the injection volume of 530 mg L−1 PV.21During the application of polymer microspheres, polymer solution was injected into the reservoir along with polymer microspheres.21,22 Due to the same amide functional groups in polymer microspheres and polymer solutions, the conventional concentration method of polymer microspheres such as starch–cadmium iodide method, chemiluminescent nitrogen method, ammonia electrode method and organic carbon content method were not accurate.23–25
So it is difficult to research the plugging behavior and conformance control mechanism from a quantitative perspective. For these reasons, fluorescent polymer microspheres could overcome the limits of conventional methods and achieve the real-time detection of polymer microspheres concentration and the distribution of polymer microspheres in the reservoir during the flooding process. Fluorescent polymer microspheres have a dual function, one is the conformance agent and the other is the oil field tracer. The oil field tracer will be a new application of fluorescent polymer microspheres in the development of oilfields.
Under most circumstances, fluorescent polymer microspheres are physically dyed through absorption or embedment, which results to the problem of dye leakage and limits the field applications of these fluorescent polymer microspheres. To avoid dye leakage, dyes could be covalently incorporated into polymer microsphere by the inverse suspension polymerization.26–28 Rhodamine B (RhB), which has been widely used in medicine, environmental protection, textiles, colored glass, and cosmetics etc., is a commonly used commercial fluorescent dye.29–32
Herein, we report one kind of fluorescent polymer microspheres P(AM-BA-RhB) acted as a novel conformance control agent. The fluorescent polymer microspheres were covalently dyed with Allyl Rhodamine B by inverse suspension polymerization. The polymer microsphere was characterized by fluorescence microscope, environmental scanning electron microscope (ESEM) and scanning electronic microscopy (SEM). The effects of salinity and temperature on the swelling property of the polymer microsphere were studied by weighing method. In addition, in order to define the scope of application, the fluorescence spectroscopy was used to investigate the effects of pH and ionic species on the fluorescence intensity of the polymer microsphere. In order to monitor the concentration of fluorescent polymer microspheres, the relationship between fluorescence intensity and concentration of fluorescent polymer microspheres was established. On the basis of these results, the plugging behavior of the polymer microsphere was investigated using core flooding test and visual micromodel. These researches provide theoretical support for the further study of fluorescent polymer microspheres in the application of oilfields.
2. Experimental section
2.1 Materials
Allyl Rhodamine B (RhB) was synthesized by the method illustrated in ref. 33. Sorbitan Monostearate (Span 60), purchased from Shanghai Shanpu Chemical Co., Ltd. (Shanghai, China), was used as an oil phase dispersant. Anhydrous sodium carbonate (Na2CO3), supplied by Shanghai Hongguang Chemical Plant (Shanghai, China), was employed as an electrolyte. N, N′-Methylenebisacrylamide (MBA) was purchased from Tianjin Kemiou Chemicals Ltd. (Tianjin, China) and used as a cross-linking agent. Ammonium persulfate (APS, used as water-soluble initiator), acrylamide (AM) monomer, anhydrous ethanol and other reagents used were all analytical-reagent grade, obtained from Sinopharm Chemicals Ltd. (Shanghai, China).2.2 Synthesis and purification of fluorescent polymer microspheres
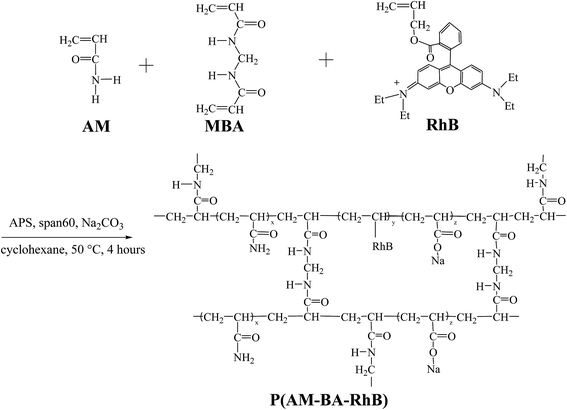
The polymerization was conducted in a 250 mL four-neck flask. The flask was equipped with mechanical stirrer, reflux condenser and a constant temperature water bath. The fluorescent polymer microsphere P(AM-BA-RhB) was prepared via inverse suspension polymerization using cyclohexane as the continuous phase and Span-60 as the nonionic polymeric surfactant (Fig. 1). 0.07 g MBA, 14.06 g AM, and Na2CO3 were dissolved in 40 mL distilled water; this solution was immediately poured into 60 mL of cyclohexane (containing 0.005 g Allyl Rhodamine B and 0.45 g Span 60) which was previously purged with dry nitrogen steam in the flask. Air was flushed from the reactor by introducing nitrogen until the entire process completed. After aqueous droplets in continuous phase appeared, 10 mL APS aqueous solution (75 g L−1) was added to continuous phase to initiate polymerization. The polymerization lasted for 4 h at 50 °C. After the prescribed time, fluorescent polymer microsphere appeared when stirring was stopped. Then, the precipitates were washed with large amounts of anhydrous ethanol and filtered with qualitative filter paper. The product was dried in a vacuum oven at 45 °C for 24 h. The conventional polymer microsphere of P(AM-BA) was prepared by the same process as described above, without adding the Allyl Rhodamine B in the reaction system.2.3 Characterization methods
FT-IR spectra of fluorescent polymer microsphere P(AM-BA-RhB), conventional polymer microsphere P(AM-BA), and acrylamide monomer were measured with a Nicolet model NEXUS670 spectrometer with samples prepared on KBr pellets.The surface morphology of these fluorescent polymer microspheres was observed by inverse fluorescence microscope (Leica DMI 3000B, Germany) and scanning electron microscopy (SU8010, HITACHT, Japan).
The average particle size of fluorescent polymer microsphere before and after swelling was determined at room temperature by RISE-2006 laser particle size analyzer provided by Jinan Runzhi Technology Co., Ltd of China.
The fluorescence spectra of fluorescent polymer microsphere were obtained from the Fluoromax-4 spectrometer (Horiba JobinYvon, American).
Environment Scanning Electron Microscope (ESEM) images were taken by FEI Quanta 200 FEG (FEI Company, Holland) to observe the structure of fluorescent polymer microsphere after swelling.
To measure the swelling ratio of fluorescent polymer microspheres, a tea bag (i.e., a 100 mesh nylon screen) containing pre-weighed dry samples was immersed entirely in brine water (1 g L−1 NaCl). After being hydrated in brine water for various times, the swollen fluorescent polymer microspheres were allowed to drain by taking the teabag from the brine, followed by removal of excess surface water using filter paper. The swelling ratio, Sw was calculated from the following equation:20
| Sw = (m1 − m0)/m0 | (1) |
2.4 Plugging behavior experiments of fluorescent polymer microspheres
3. Results and discussion
3.1 Structure characterization of the fluorescent polymer microspheres P(AM-BA-RhB)
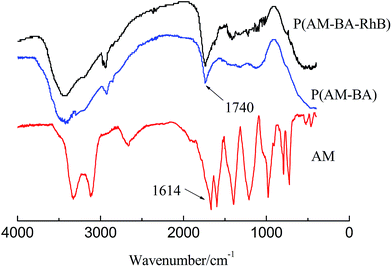
Fig. 4 shows FT-IR spectra of fluorescent polymer microspheres P(AM-BA-RhB), conventional polymer microspheres P(AM-BA) and acrylamide (AM). The double peak, within the range of 3100 and 3500 cm−1 in the spectrum of AM, is attributed to the amide unit and is not available in the spectra of P(AM-BA) and P(AM-BA-RhB). The N–H stretching vibration peak appeared at 3400 cm−1, indicating the presence of acrylamide units within the polymer microspheres composed of P(AM-BA) and P(AM-BA-RhB). Furthermore, the C![[double bond, length as m-dash]](https://www.rsc.org/images/entities/char_e001.gif) O bending vibration absorption peak shifted from 1600 cm−1 for AM to 1740 cm−1 for P(AM-BA), suggesting that the amide is partially hydrolyzed to the carboxyl.34 The peak of 670 cm−1 is attributed to the bending vibration of aromatic hydrogen. As the trace amount of Allyl Rhodamine B is on the side chains, other characteristic peaks of Allyl Rhodamine B are weak, such as the benzene ring skeleton, methyl and methylene.
O bending vibration absorption peak shifted from 1600 cm−1 for AM to 1740 cm−1 for P(AM-BA), suggesting that the amide is partially hydrolyzed to the carboxyl.34 The peak of 670 cm−1 is attributed to the bending vibration of aromatic hydrogen. As the trace amount of Allyl Rhodamine B is on the side chains, other characteristic peaks of Allyl Rhodamine B are weak, such as the benzene ring skeleton, methyl and methylene.
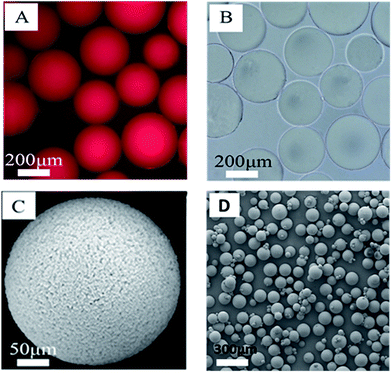
The morphology of the polymer gel was researched by a fluorescence microscope (Fig. 5A and B), a scanning electron microscope (Fig. 5C and D) and an environment scanning electron microscope (Fig. 6). Fig. 6 gives the particle size analysis and three-dimensional cross-linked networks of fluorescent polymer microspheres P(AM-BA-RhB) before and after swelling at 25 °C. As showed in Fig. 5, the fluorescent polymer microspheres P(AM-BA-RhB) are spherical particles and can swell many times due to absorbing a lot of water (see Fig. 5D and C). As the fluorescent polymer microspheres P(AM-BA-RhB) contact with brine water, the water molecules can go into the internal network under the action of inside and outside osmotic pressure, stretching the molecular chain of the network structure, enlarging the volume of polymer microspheres. The three-dimensional cross-linked networks can be obviously observed in Fig. 5C and 6. It can be seen that the average particle sizes of fluorescent polymer microspheres P(AM-BA-RhB) before and after swelling are 125.7 μm and 215.6 μm, respectively (see Fig. 6). Moreover, from Fig. 5A and B we can see that the swollen polymer microspheres P(AM-BA-RhB) have fluorescent property. The polymer microspheres emit red fluorescence under UV light and the polymer microspheres show some colourless and transparent balls under the ordinary light.
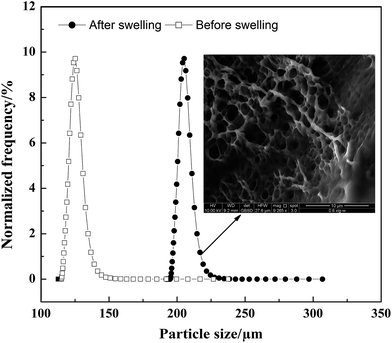 | ||
| Fig. 6 Particle size distribution and three-dimensional cross-linked networks of fluorescent polymer microspheres P(AM-BA-RhB) before and after swelling (1% NaCl, 25 °C). | ||
3.2 Fluorescent property of fluorescent polymer microspheres P(AM-BA-RhB)
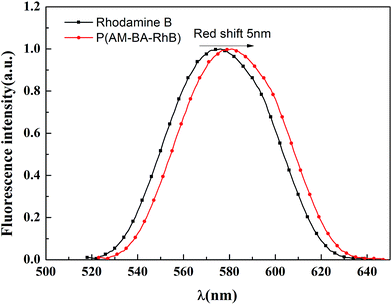
Fig. 7 shows the fluorescent emission spectra of Rhodamine B and fluorescent polymer microspheres P(AM-BA-RhB) in brine water. It can be observed that the max emission peak of Rhodamine B and P(AM-BA-RhB) were 575 nm and 580 nm, respectively. We find that the emission spectra of fluorescent monomer Rhodamine B moved towards to the long-wavelength band when the Rhodamine B was grafted to the structure of polymer microspheres P(AM-BA-RhB). This means red shift has taken place. The reason why red shift occurred was that when fluorescent monomer Rhodamine B was grafted to polymer microspheres, the conjugation effect of fluorescent monomer Rhodamine B increased, the energy of electron transition decreased and the fluorescence emission wavelength became longer. Martínez et al. also found that the fluorescence spectrum will be changed when the fluorescent dye was embedded in the polymer gel by grafting or coating.35Fig. 8a shows the effect of pH on the fluorescence intensity of fluorescent polymer microspheres P(AM-BA-RhB) in brine water at the wavelength λex = 505 nm. When pH < 3, the fluorescence intensity of fluorescent polymer microspheres P(AM-BA-RhB) solution varies with the change of pH. However, the fluorescence intensity remains unchanged when the pH is in the range of 3–10. When pH equals to 1.0, the dispersed solution was strong acid solution and the carboxyl of RhB can't ionize. Because the carboxyl group, which was a strong electron-withdrawing group, may quench the fluorescence of RhB. This caused weak fluorescent property of RhB. The carboxyl of RhB began to ionize and the degree of ionization increased gradually with the increase of pH value. Thus, the electronic absorption ability became weak and the fluorescence enhanced gradually. When the pH value is close to 3.0, the carboxyl of RhB has been completely ionization, the quenching effect disappeared and fluorescence intensity reached the maximum value (see Fig. 8a). When the pH was greater than 3.0, the fluorescence intensity changed little with the increase of pH value. RhB fluorescence intensity presented undulating fluctuation due to the high sensitivity of fluorescence spectrometer. It can conclude that the fluorescent polymer microspheres P(AM-BA-RhB) can be used in the brine water environment with pH greater than 3.0.
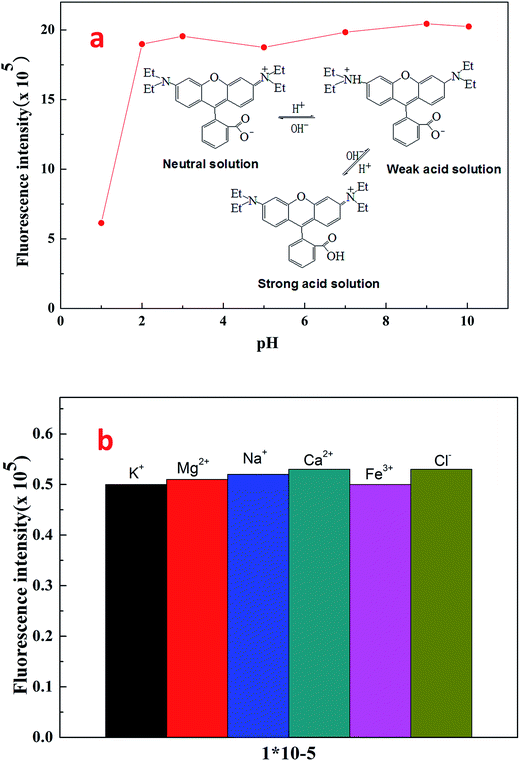 | ||
| Fig. 8 Effect of pH and ionic species on the fluorescence intensity of fluorescent polymer microspheres P(AM-BA-RhB) in brine water. | ||
Following the general procedure, the effect of ionic species on the fluorescence intensity of fluorescent polymer microspheres P(AM-BA-RhB) was studied (see Fig. 8b). The response of the fluorescent polymer microspheres P(AM-BA-RhB) to solutions containing ionic species such as Na+, K+, Mg2+, Ca2+, and Fe3+ was investigated. The results indicated that the ionic species had little influence on the fluorescence intensity. When the fluorescent monomer RhB was grafted to the network structure of polymer microspheres, the fluorescence properties were reduced by the influence of the reservoir condition. So the fluorescent polymer microspheres P(AM-BA-RhB) were suitable for the brine water containing these ionic species.
3.3 Swelling property of fluorescent polymer microspheres P(AM-BA-RhB)
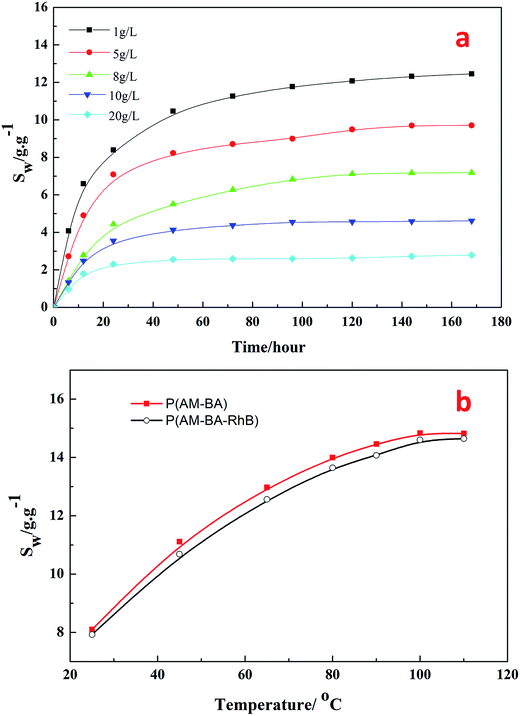
Fig. 9a shows the swelling ratio of fluorescent polymer microspheres P(AM-BA-RhB) in the brine water with different concentrations of NaCl (1, 5, 8, 10, 20 g L−1) at 90 °C. Within 40 hours of hydration, the swelling ratio increased rapidly at an early stage and gradually leveled off. The swelling ratio reached to the maximum after 175 hours. This indicates that brine water can penetrate into the matrix of the fluorescent polymer microspheres. In fact, the fluorescent polymer microspheres are cross-linked particles with a three-dimensional network structure and many free hydrophilic groups (–CONH2) inside. Polar brine water molecules can be bond to these groups easily through hydrogen bonding, leading to a significant increase in the hydrated particle size of fluorescent polymer microspheres. While the concentrations of NaCl increased from 1 to 20 g L−1, the swelling ratio decreased from 12 to 2 at the equilibrium stage. These results illustrate that the fluorescent polymer microspheres P(AM-BA-RhB) maintain good salt tolerance at high temperature, 90 °C in this case.Fig. 9b shows the effect of temperature on the swelling ratio of two different polymer microspheres P(AM-BA-RhB) and P(AM-BA) in the brine water with various temperature form 25 to 110 °C. When the temperature increased from 25 to 110 °C, the swelling ratio increased from 8 to 14 times at the equilibrium stage. The two polymer microspheres displayed excellent thermal stability because of the three-dimensional network structures in the polymer microspheres.
Furthermore, there is no obvious difference between the swelling ratios of the two kinds of polymer microspheres (see Fig. 9b). This result suggests that swelling property has not been dramatically affected by the fluorescent functional groups embedded in the polymer microspheres by grafting or coating. Essentially, this result could be attributed to the low content of the fluorescent functional groups.
3.4 Method of measuring the concentration of fluorescent polymer microspheres
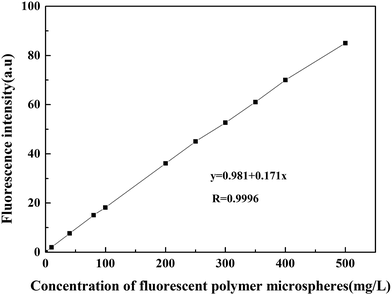
After studying the swelling property and fluorescence property of fluorescent polymer microspheres, the detection method of measuring the concentration of fluorescent polymer microspheres was discussed in this part. This could provide methods for the research of plugging behavior study of fluorescent polymer microspheres.| Number | Actual value | Test value | Relative error/% |
|---|---|---|---|
| 1 | 15.5 | 15.3 | −1.23 |
| 2 | 30.0 | 30.4 | 1.33 |
| 3 | 152.5 | 153.7 | 0.79 |
| 4 | 225.0 | 222.9 | −0.93 |
| 5 | 330.5 | 326.7 | −1.15 |
| 6 | 450.0 | 451.5 | 0.33 |
3.5 Plugging behavior of fluorescent polymer microspheres
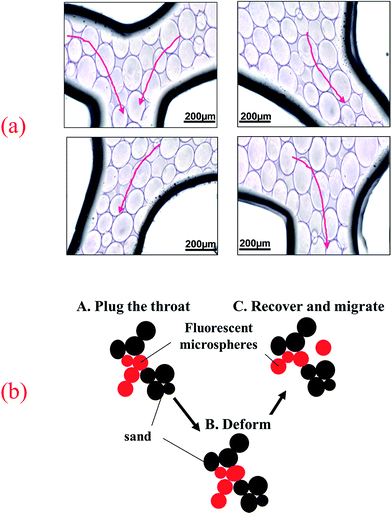 | ||
| Fig. 11 (a) The migration behavior of fluorescent polymer microspheres in the porous medium of visual micromodel and (b) migration schematic diagram. | ||
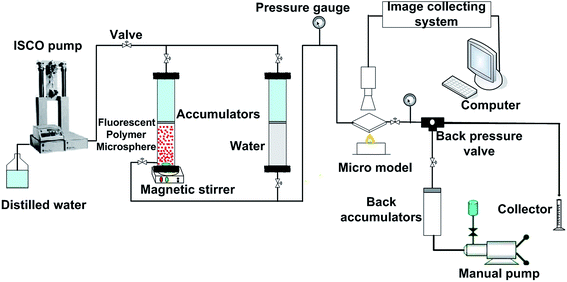
Fig. 11b illustrated the migration schematic diagram of fluorescent polymer microspheres. When fluorescent polymer microspheres were being injected, the particles preferentially entered the high permeability zone. Fluorescent polymer microspheres can pass directly or by deformation through the porous media and enter the in-depth formation. When the size of the fluorescent polymer microsphere is much larger than the pore throat size, the fluorescent polymer microspheres will be trapped at the entrance of the pore throat and directly plug the high permeability channel. When the size of fluorescent polymer microsphere is a little larger than the pore throat size but not very much, the polymer gel can be deformed and pass through the pore throat. Moreover, the deformable polymer microspheres can revert to their original shape after entering a larger pore. Additionally, when the size of fluorescent polymer microsphere is smaller than the pore throat size, two or more fluorescent polymer microspheres will be stranded in the pore space and bridge onto the pore throat. Once the bridge is formed and consolidated, the newly arriving fluorescent polymer microspheres accumulate upstream from bridged pores (see Fig. 11b), thus decreasing the following fluid flow rate and yielding fluid diversion effects. When the size of fluorescent polymer microsphere is too smaller than the pore throat size, fluorescent polymer microspheres will easily pass through the pore throat and enter the in-depth formation. In conclusion, the fluorescent polymer microspheres can be deformed and pass through pores easily, so they can enter the in-depth formation and plug the high permeability channels.
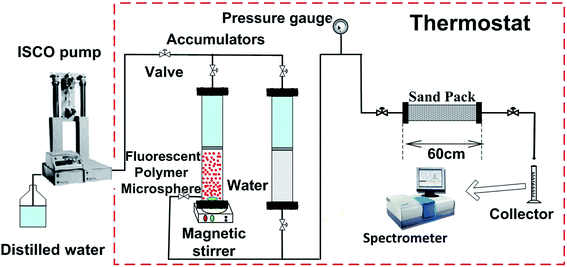
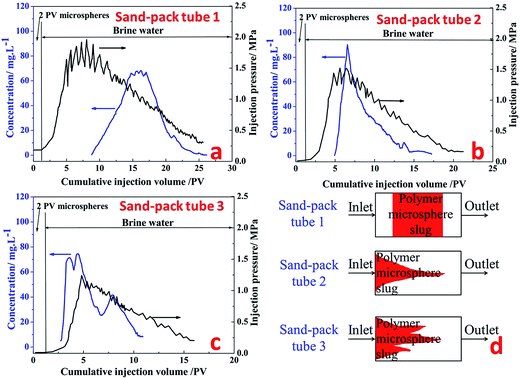
Sand-pack tube 1. Fig. 12a shows the production concentration curve and injection pressure curve of fluorescent polymer microspheres in sand-pack tube 1 with permeability of 12 μm2. It can be seen from Fig. 12a that the subsequent brine water injection pressure is constantly rising and fluctuating after 2 PV injections of fluorescent polymer microspheres, and finally the injection pressure reaches a peak of 1.9 MPa at 7.3 PV. Then the injection pressure drops slowly in the fluctuation, and at the same time the occurrence of fluorescent microspheres was monitored at the outlet of the tube. With the continuous injection of brine water, the injection pressure begins to decrease slowly, and the concentration of fluorescent polymer microspheres at the outlet increases first and then decreases. Through the observation of the produced concentration curve of the fluorescent polymer microspheres, it can be found that when the injection volume gets to 8–14 PV, the microspheres concentration rises from 0 to 70 mg L−1; from 14 PV to 17 PV, the microspheres concentration consists a platform with concentration of 70 mg L−1; after 18 PV injection, the fluorescent polymer microspheres concentration begins to decline.
The injection pressure keeps rising in a general trend and drops occasionally within a large range at the brine water injection stage, which is defined as “Wave-type Variation”.18 In fact, when the swollen fluorescent polymer microspheres were injected into the tube, they were adsorbed and accumulated on sand surfaces at the beginning. The pressure increased due to blocking pores near the inlet. Moreover, with higher injection volume of fluorescent polymer microspheres, fluorescent polymer microspheres accumulated faster, leading to more rapid pressure increase. Since the swollen fluorescent polymer microspheres have a certain degree of deformation, they could deform under pressure and move to the next pore. This is indicated by the fluctuation when the pressure increased during swollen fluorescent polymer microspheres injection and the pressure continued to rise with large fluctuations.36
Sand-pack tube 2. Fig. 12b shows the production concentration curve and injection pressure curve of fluorescent polymer microspheres in sand-pack tube 2 with permeability of 27 μm2. It can be seen from Fig. 12b that after 2 PV injections of fluorescent polymer microspheres, the subsequent water injection pressure is constantly rising and fluctuating as well, whereas the peak value of injection pressure is 1.5 MPa. Then the injection pressure drops slowly again in the fluctuation, and before the injection pressure getting the peak value, the occurrence of fluorescent polymer microspheres was monitored at the outlet of the tube. Through observation of the produced concentration curve of the microspheres, we can find that the concentration curve of fluorescent polymer microspheres shows a sharp peak. It is different from the production curve in Fig. 12a.
Sand-pack tube 3. Fig. 12c shows the production concentration curve and injection pressure curve of fluorescent polymer microspheres in sand-pack tube 3 with permeability of 36 μm2. It can be seen from Fig. 12c that the subsequent water injection pressure is constantly rising with fluctuation as well after 2 PV injections of fluorescent polymer microspheres, whereas the peak value of injection pressure is 1.25 MPa. Then the injection pressure drops slowly again in the fluctuation, and before the injection pressure getting the peak value, the occurrence of fluorescent polymer microspheres was also monitored at the outlet of the tube. Through observation of the produced concentration curve of the microspheres, it is found that the concentration curve of fluorescent polymer microspheres shows three sharp peaks. It is different from the production curves in Fig. 12a and b.
It is noteworthy that the fluorescent polymer microspheres production concentration reaches a platform from 14 PV to 17 PV in the sand-pack tube 1, which indicates that the fluorescent polymer microspheres are produced at a certain high-concentration for a period of time. And it is assumed that the microspheres mainly move parallel to the piston in the sand-pack tube 1 (see Fig. 12d). This is named as “piston plugging”. In the sand-pack tube 2, the concentration curve of fluorescent polymer microspheres shows one peak at 6 PV, indicating that the fluorescent polymer microspheres move along a large-pore channel, and this is called “protruding plugging” (see Fig. 12d). However, in the sand-pack tube 3, there are three peaks in the production concentration of fluorescent polymer microspheres, indicating that the fluorescent polymer microspheres are transported through three large channels, which is called “fingering plugging” (see Fig. 12d). Due to the difference of fracture distribution in the reservoirs, fluorescent polymer microspheres have different plugging behavior. The slug design of polymer microspheres should fully consider the plugging behavior in the reservoirs.
4. Conclusions
In this study, a kind of fluorescent polymer microspheres P(AM-BA-RhB) acted as a novel conformance control agent was proposed. Laboratory experiments have been conducted to understand the structure characterization, fluorescent property, swelling property and plugging behavior of fluorescent polymer microspheres. The major conclusions that can be drawn from this study are as follows:(1) The fluorescent polymer microspheres P(AM-BA-RhB), which can fluoresce under ultraviolet irradiation, was synthesized via the inverse suspension polymerization method. The fluorescence functional monomer of Rhodamine B was uniformly distributed inside the polymer microspheres. When the Rhodamine B was grafted on the structure of polymer microspheres P(AM-BA-RhB), the red shift occurred. The fluorescent polymer microspheres retained their fluorescent properties after swelling in the metal ions containing solution at the pH 3.0–10.0.
(2) The fluorescent polymer microspheres P(AM-BA-RhB) were spherical particles with an average particle size of 125.7 μm. This kind of microspheres was composed of three-dimensional cross-linked networks and had good swelling property in high salinity and high temperature conditions. With the increase of salinity, the swelling ratio decreased. And the swelling ratio increased with the increase of the formation temperature. The swelling property was not dramatically affected by the fluorescent functional groups embedded in the polymer microspheres by grafting or coating.
(3) The linear equation between fluorescence intensity and concentration of fluorescent polymer microspheres P(AM-BA-RhB) was constructed. According to this linear equation, the concentration of fluorescent polymer microspheres in the production liquid can be detected quantitatively through the fluorescence intensity value.
(4) Visual micromodel test and sand-pack tubes experiment of fluorescent polymer microspheres showed that the fluorescent polymer microspheres can pass directly or by deformation through porous media and enter the in-depth formation. The injection pressure showed the phenomenon of “Wave-type Variation”. Three plugging behaviors such as piston plugging, protruding plugging and fingering plugging were put forward. These results were useful for the slug design of polymer microspheres in the field application.
Conflicts of interest
The authors declare no competing financial interest.Acknowledgements
The work was supported by the China Postdoctoral Science Foundation (2017M612378), Shandong Provincial Natural Science Foundation, China (ZR2017LEE001), the National Natural Science Foundation of China (51774309), Special Support for Post-doctoral Creative Funding in Shandong Province (201702026), the Fundamental Research Funds for the Central Universities (18CX02166A), Scientific Research Fund for Introducing Scholars of China University of Petroleum (YJ201601088) and Qingdao Postdoctoral Application Research Project (2016222).References
- A. K. Alhuraishawy, B. Bai, A. Imqam and M. Wei, Fuel, 2018, 214, 342–350 CrossRef CAS.
- E. Sharifpour, M. Riazi and S. Ayatollahi, Ind. Eng. Chem. Res., 2015, 54, 11236–11246 CrossRef CAS.
- H. Jia, W. Pu, J. Zhao and F. Jin, Ind. Eng. Chem. Res., 2010, 49, 9618–9624 CrossRef CAS.
- G. Zhao, C. Dai, M. Zhao and Q. You, J. Appl. Polym. Sci., 2014, 131, 39946 CrossRef.
- G. Zhao, C. Dai, Q. You, M. Zhao and J. Zhao, J. Sol-Gel Sci. Technol., 2013, 65, 392–398 CrossRef CAS.
- C. Dai, G. Zhao, Q. You and M. Zhao, J. Appl. Polym. Sci., 2014, 131, 40154 Search PubMed.
- C. Dai, G. Zhao, Q. You and M. Zhao, J. Appl. Polym. Sci., 2014, 131, 39462 Search PubMed.
- J. Pu, J. Zhou, Y. Chen and B. Bai, Energy Fuels, 2017, 31, 13600–13609 CrossRef CAS.
- H. Yang, W. Kang, Y. Yu, Y. Lu, Z. Li, M. Wang and T. Liu, J. Appl. Polym. Sci., 2015, 132, 42278 Search PubMed.
- H. Yang, W. Kang, Z. Jian and Z. Bin, Colloids Surf., A, 2015, 487, 240–245 CrossRef CAS.
- C. Yao, G. Lei, J. Hou, X. Xu, D. Wang and T. S. Steenhuis, Ind. Eng. Chem. Res., 2015, 54, 10925–10934 CrossRef CAS.
- H. Yang, W. Kang, H. Wu, Y. Yu, Z. Zhu, P. Wang, X. Zhang and B. Sarsenbekuly, RSC Adv., 2017, 7, 8118–8130 RSC.
- Z. Hua, M. Lin, Z. Dong, M. Li, G. Zhang and J. Yang, J. Colloid Interface Sci., 2014, 424, 67–74 CrossRef CAS PubMed.
- M. Lin, G. Zhang, Z. Hua, Q. Zhao and F. Sun, Colloids Surf., A, 2015, 477, 49–54 CrossRef CAS.
- H. Yang, W. Kang, X. Yin, X. Tang, S. Song, Z. A. Lashari, B. Bai and B. Sarsenbekuly, Powder Technol., 2017, 313, 191–200 CrossRef CAS.
- T. Wan, R. Huang, Q. Zhao, L. Xiong, L. Luo, X. Tan and G. Cai, J. Appl. Polym. Sci., 2013, 130, 698–703 CrossRef CAS.
- C. Liu, X. Liao, M.-M. Chang, Y. Zhang, C. Mu, T. Li, R. Qin, R. Fu, X. Bie and J. Zheng, SPE 158293 presented at SPE Annual Technical Conference and Exhibition, San Antonio, Texas, USA, 8–10 October, 2012 Search PubMed.
- C. Yao, G. Lei, L. Li and X. Gao, Energy Fuels, 2012, 26, 5092–5101 CrossRef CAS.
- C. Yao, D. Wang, J. Wang, J. Hou, G. Lei and T. S. Steenhuis, Ind. Eng. Chem. Res., 2017, 56, 8158–8168 CrossRef CAS.
- H. Yang, W. Kang, S. Liu, B. Bai, J. Zhao and B. Zhang, J. Dispersion Sci. Technol., 2015, 36, 1673–1684 CrossRef CAS.
- J. Yang, X. Xie, J. Zhang, X. Zheng and Z. Wei, Pet. Explor. Dev., 2014, 41, 794–797 CrossRef.
- H. Yang, W. Kang, Y. Yu, X. Yin, P. Wang and X. Zhang, Powder Technol., 2017, 315, 477–485 CrossRef CAS.
- Q.-x. Ma, Z. Zhang, J.-s. Miao, Y. Guan, M. Xiao and Y. Guan, Chemistry & Bioengineering, 2010, 27, 80–82 CAS.
- S. Guan, H. Fan, J. Duan and C. Song, Journal of Daqing Petroleum Institute, 2007, 31, 110–112 CAS.
- M. Li, Journal of Huaqiao University (Natural Science), 2007, 28, 109–110 CAS.
- A. Nanthakumar, R. T. Pon, A. Mazumder, S. Yu and A. Watson, Bioconjugate Chem., 2000, 11, 282–288 CrossRef CAS PubMed.
- G. Bosma, C. Pathmamanoharan, E. H. A. de Hoog, W. K. Kegel, A. van Blaaderen and H. N. W. Lekkerkerker, J. Colloid Interface Sci., 2002, 245, 292–300 CrossRef CAS PubMed.
- R. S. Jardine and P. Bartlett, Colloids Surf., A, 2002, 211, 127–132 CrossRef CAS.
- C. Baggiani, L. Anfossi, P. Baravalle, C. Giovannoli, G. Giraudi, C. Barolo and G. Viscardi, J. Sep. Sci., 2009, 32, 3292–3300 CrossRef CAS PubMed.
- X. Bao, J. Shi, X. Nie, B. Zhou, X. Wang, L. Zhang, H. Liao and T. Pang, Bioorg. Med. Chem., 2014, 22, 4826–4835 CrossRef CAS PubMed.
- J. Kang, J. Yan, J. Liu, H. Qiu, X. Yin, X. Yang and E. Wang, Talanta, 2005, 66, 1018–1024 CrossRef CAS PubMed.
- C. C. Wang, A. N. Masi and L. Fernandez, Talanta, 2008, 75, 135–140 CAS.
- Q.-H. Liu, J. Liu, J.-C. Guo, X.-L. Yan, D.-H. Wang, L. Chen, F.-Y. Yan and L.-G. Chen, J. Mater. Chem., 2009, 19, 2018 RSC.
- W.-B. Yang, M. Xia, A. Li, L. Yang and Q. Zhang, React. Funct. Polym., 2007, 67, 609–616 CrossRef CAS.
- V. M. n. Martínez, F. L. p. Arbeloa, J. B. u. Prieto and I. L. p. Arbeloa, Jounal of Physical Chemistry B, 2005, 109, 7443–7450 CrossRef PubMed.
- Z. Hua, M. Lin, J. Guo, F. Xu, Z. Li and M. Li, J. Pet. Sci. Eng., 2013, 105, 70–75 CrossRef CAS.
| This journal is © The Royal Society of Chemistry 2018 |

