 Open Access Article
Predicting the electrical conductivity in polymer carbon nanotube nanocomposites based on the volume fractions and resistances of the nanoparticle, interphase, and tunneling regions in conductive networks
Zhenling Liua,
Wanxi Peng*a,
Yasser Zare b,
David Huic and
Kyong Yop Rhee*d
aSchool of Forestry, Henan Agricultural University, Zhengzhou, 450001, China. E-mail: pengwanxi@163.com
bYoung Researchers and Elites Club, Science and Research Branch, Islamic Azad University, Tehran, Iran
cDepartment of Mechanical Engineering, University of New Orleans, LA 70148, USA
dDepartment of Mechanical Engineering, College of Engineering, Kyung Hee University, Giheung, Yongin 446-701, Gyeonggi 449-701, Republic of Korea. E-mail: rheeky@khu.ac.kr; Fax: +82 31 202 6693; Tel: +82 31 201 2565
First published on 23rd May 2018
Abstract
Some limited models have been suggested to determine the conductivity of polymer carbon nanotube (CNT) nanocomposites (PCNTs). However, earlier models (e.g., the Kovacs model) cannot properly consider the roles of the interphase regions or tunneling properties on the percolation threshold and subsequent conductivity of PCNTs. In this paper, the Kovacs model is further developed by assuming that the CNT, interphase, and tunneling regions are separate phases. Also, some simple equations are provided to calculate the percolation threshold as well as the volume fractions and resistances of the CNT, interphase, and tunneling regions in conductive networks. The experimental conductivity results for several samples are compared with the predictions of the developed model. In addition, the calculations of the developed model at different parameter levels are explained and justified. The conductivity calculations show good agreement with the experimental data. Moreover, the developed model reasonably explains the roles of the different parameters on the conductivity. For example, long, thin, and straight CNTs efficiently improve the conductivity because they form large networks in the nanocomposites. Additionally, a thick interphase enlarges the conductive networks, resulting in a desirable conductivity. The conductivity of PCNTs only depends on the tunneling resistance; this is the case because the poor resistance/significant conductivity of the CNT and interphase regions do not influence the conductivity. The developed equations can replace conventional approaches for predicting the conductivity of nanocomposites.
1 Introduction
Polymer carbon nanotube (CNT) nanocomposites (PCNTs) are interesting because they show excellent conductivity. The electrical conductivity of CNTs reaches 106 S m−1, but polymer matrices usually show poorer conductivity values between 10−16 and 10−12 S m−1. However, adding very low concentrations of CNTs into polymer matrices can significantly increase their conductivity.1–8 Conductive polymer nanocomposites have the potential to be used in electronics, sensors, and actuators, as well as many other applications in the electronics industry.9,10 Conductivity in nanocomposites commonly occurs at a critical filler concentration, known as the percolation threshold, where nanoparticles form conductive networks within nanocomposites.11,12 The percolation level is experimentally determined by measuring the electrical conductivity at different filler concentrations. Earlier reports commonly related the percolation threshold to the size of the nanofiller material;13,14 however, the structure and dispersion quality of CNTs, in addition to the interphase properties, can also influence the percolation level.15,16The high surface area of nanoparticles per unit weight, as well as the strong interfacial interaction between the polymer matrix and nanofiller, create interphase regions in the polymer nanocomposites.17,18 These interphase regions are actually modified zones of the matrix, caused by the large surface area of nanoparticles and the strong interfacial interactions. Fig. 1 depicts a schematic illustrating the interphase regions that form around CNTs. The interphase thickness is defined as the thickness of the interphase zone formed between the nanoparticles and the polymer matrix. The extent of the interphase regions directly governs the mechanical properties of a nanocomposite.18–24 In addition, some authors have suggested that the interphase areas around nanoparticles can cause percolation networks to form before the nanoparticles actually join together.17,25–27 This means that the percolation networks initially form based on the interphase areas because the interphase regions surrounding CNTs can produce network structures before the nanoparticles are physically connected. Therefore, these interphase regions can reduce the percolation threshold of nanoparticles in nanocomposites. Interphase regions can help create large conductive networks in PCNTs, thereby influencing the electrical conductivity; however, earlier works have not investigated this topic.
It has been suggested that the main mechanism for the electrical conductivity in PCNTs is electron hopping, in which electrons in CNTs are conveyed by the tunneling effect.28–30 In this approach, neighboring CNTs produce conductivity via electron jumping and the tunneling effect depends on the tunneling properties between CNTs rather than their network (Fig. 1). Some micromechanics models were developed to account for the tunneling effect, agglomeration, and waviness of CNTs;31,32 however, the intricate and indistinct equations of these models are not useful in practice. There is not a simple model that can show the conductivity of polymer nanocomposites based on the properties of the conductive nanoparticles, interphase regions, and networks.
Kovacs et al.33 proposed a model to determine the conductivity of PCNTs by assuming the weight percentage, dimensions, and resistance of CNTs, as well as the tunneling effect. However, they did not consider the interphase regions in nanocomposites. In addition, they did not appropriately express the tunneling resistance or the fractions of the interphase and tunneling regions in the conductive networks. The Kovacs model correlates the conductivity to the volume fraction of all nanoparticles; however, only networked CNTs improve the conductivity of nanocomposites. In our study, the Kovacs model is further developed by assuming that the interphase and tunneling regions are separate phase in PCNTs. Simple equations express the volume fractions and the intrinsic resistances of the CNT, interphase, and tunneling regions in the conductive networks. Therefore, the developed model can predict the conductivity of nanocomposites by accounting for the interphase and tunneling spaces. The experimental conductivity results from several samples and parametric analysis were used to assess the developed model. The good agreement between experimental results and predictions, in addition to the accurate calculations of the developed model at different parameter levels, validate the developed model.
2 Theoretical expressions
Kovacs et al.33 suggested a simple model to determine the conductivity of PCNTs by assuming the tunneling mechanism as:
 | (1) |
The percolation threshold of randomly dispersed CNTs in PCNTs is given by:36
 | (2) |
The values of “V” and “Vex” in PCNTs containing random CNTs were suggested to be:36
| V = πR2l | (3) |
 | (4) |
The interphase layer around CNTs can accelerate the development of conductive networks in PCNTs. The interphase areas change the excluded volume as:
 | (5) |
Also, the large aspect ratio (length to diameter) of CNTs causes waviness in PCNTs, thereby reducing their effectiveness. An equivalent length (leq) is considered as the minimum distance between two ends of each nanotube, and the waviness parameter is defined as:
 | (6) |
If we assume that “leq” is the effective length of wavy CNTs (leq = l/u) in “Vex”, then:
 | (7) |
Now, the percolation threshold of CNTs when the roles of the interphase region and waviness are accounted for is suggested as:
 | (8) |
This equation can predict the percolation threshold in PCNTs.
Both the CNTs and the surrounding interphase can affect the size of networks, increasing the conductivity in nanocomposites.
The total volume fraction of the interphase region in PCNTs37 is calculated by:
 | (9) |
 | (10) |
Moreover, only a fraction of the nanotubes form the conductive networks after reaching the percolation threshold, while other CNTs are dispersed throughout the PCNT.
The fraction of percolated CNTs35 is calculated by:
 | (11) |
This is further developed by including the effective filler fraction:
 | (12) |
Using “f”, the volume fractions of CNT and interphase regions in the networks are expressed by:
| ϕN = fϕf | (13) |
| ϕiN =f(ϕeff − ϕf). | (14) |
Furthermore, tunneling regions are formed around the interphase areas surrounding CNTs. Consequently, the volume fraction of tunneling spaces in the networks is presented by:
 | (15) |
Now, the intrinsic resistances of all components are expressed.
The intrinsic resistance of CNTs is suggested as:
 | (16) |
 | (17) |
Based on this, the intrinsic resistance of wavy CNTs can be expressed as:
 | (18) |
In addition, previous articles have not suggested an equation for estimating the interphase conductivity in nanocomposites. It can be stated that the interfacial interactions between the polymer matrix and CNTs control the interphase conductivity. The interphase thickness in nanocomposites commonly indicates the extent of interfacial adhesion/interactions.39,40 Thus, the interphase conductivity can be expressed by the interphase thickness as:
 | (19) |
 | (20) |
Using this equation, the intrinsic resistance of interphase regions is expressed as:
 | (21) |
This shows that the interphase resistance inversely depends on the interphase thickness.
In addition, the tunneling resistance (Rt) is related to the resistances due to the CNTs and polymer matrix in the tunneling spaces. The tunneling resistance includes the resistances of the CNT fraction (R1) and polymer layer (R2) in the tunneling regions:
| Rt = R1 + R2. | (22) |
It has been suggested that “R1” can be described as:41
 | (23) |
“R2” can be defined as a function of the tunneling resistivity, tunneling distance, and contact area:
 | (24) |
Assuming the latter equations, the intrinsic tunneling resistance is:
 | (25) |
Finally, eqn (1) can be further developed by including the volume fractions and intrinsic resistances of the CNT, interphase, and tunneling areas in the conductive networks:
 | (26) |
When proper equations are inserted into eqn (26), the developed model can estimate the conductivity of PCNTs by assuming the effective interphase and tunneling properties.
3 Results and discussion
The developed model can predict the conductivity in PCNTs by assuming the CNT dimensions as well as the interphase, waviness, and tunneling effects.Fig. 2 illustrates the experimental and theoretical results for epoxy/multi-walled CNT (MWCNT) (R = 8 nm, l ≈ 30 μm, u = 1.2, and ϕp = 0.0002),42 poly(vinyl chloride) (PVC)/MWCNT (R = 8 nm, l ≈ 16 μm, u = 1.2, and ϕp = 0.0005),43 epoxy/single-walled CNT (SWCNT) (R = 1 nm, l ≈ 2 μm, u = 1.6, and ϕp = 0.0003)44 and polycarbonate (PC)/acrylonitrile butadiene styrene (ABS)/MWCNT (R = 5 nm, l ≈ 1.5 μm, u = 1.2, and ϕp = 0.002)45 samples. When the dimensions and percolation thresholds of CNTs are applied to eqn (8), the interphase thickness (t) values are calculated to be 5, 3, 3, and 5 nm for the epoxy/MWCNT, PVC/MWCNT, epoxy/SWCNT, and PC/ABS/MWCNT samples, respectively. These results show the formation of different interphase regions in the nanocomposites, which reduce the percolation level. Accordingly, the interphase regions act as percolation regions in PCNTs, significantly influencing the conductivity. The conductivity predictions made by the developed model show good agreement with the experimental data of reported samples, although some deviations are observed at high filler concentrations; this is due to poor dispersion and aggregation/agglomeration of the nanoparticles.46,47 Accordingly, the developed model is validated by the experimental measurements.
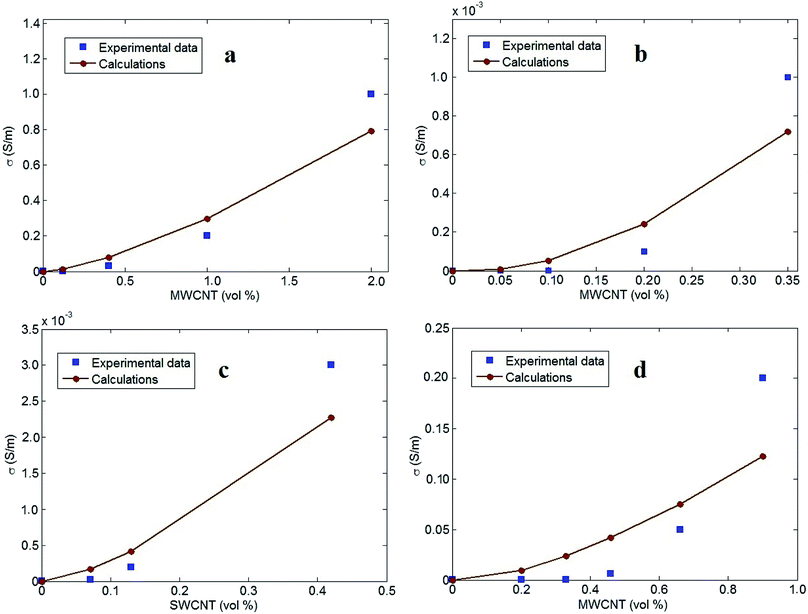 | ||
| Fig. 2 Experimental results and calculations by the developed model for (a) epoxy/MWCNT,42 (b) PVC/MWCNT,43 (c) epoxy/SWCNT44 and (d) PC/ABS/MWCNT45 samples. | ||
The values of (d, ρ) are also determined to be (2, 50), (5, 200), (4, 100), and (1, 10) (nm, ohm m) for the epoxy/MWCNT, PVC/MWCNT, epoxy/SWCNT, and PC/ABS/MWCNT samples, respectively. The tunneling distance changes from 2 to 5 nm for the reported samples, while the tunneling resistivity varies from 10 to 200 ohm m. These results reveal the different tunneling properties in the reported samples. The PC/ABS/MWCNT sample demonstrates the shortest tunneling distance and the lowest tunneling resistance, whereas the largest tunneling distance and the highest tunneling resistance are observed in the PVC/MWCNT nanocomposite. In addition, “x” has values of 10−4, 0.1, 0.01, and 10−6 for the epoxy/MWCNT, PVC/MWCNT, epoxy/SWCNT and PC/ABS/MWCNT samples, respectively. The smallest and highest values of “x” are exhibited in the PC/ABS/MWCNT and PVC/MWCNT samples, respectively.
The significance of the different parameters on the electrical conductivity of PCNTs is explained using the developed model. The average values of the parameters are ϕf = 0.01, R = 10 nm, l = 10 μm, t = 10 nm, σf = 105 S m−1, u = 1.2, d = 5 nm, ρ = 200 ohm m, and x = 0.01. Fig. 3 shows the roles of “ϕf” and “l” on the conductivity of nanocomposites, while maintaining the other factors at their average values. The highest conductivity (0.05 S m−1) is obtained with ϕf = 0.02 and l = 18 μm, but the conductivity decreases to about 0 at ϕf < 0.009 and l < 6 μm. Accordingly, both “ϕf” and “l” directly govern the conductivity of nanocomposites. In other words, a better conductivity is obtained with higher concentrations of long CNTs, whereas a low content of short CNTs does not improve the conductivity of nanocomposites.
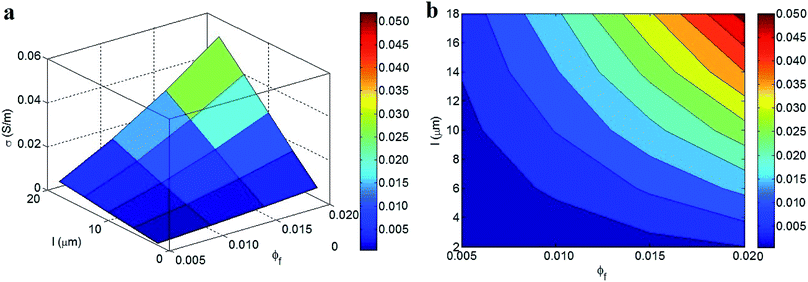 | ||
| Fig. 3 (a) 3D and (b) contour patterns for the influences of “ϕf” and “l” parameters on the conductivity of nanocomposites at average levels of other variables. | ||
The developed model demonstrates logical effects of “ϕf” and “l” on the conductivity. A high concentration of conductive fillers, above the percolation threshold, clearly creates large networks in the nanocomposite, thereby promoting conductivity. Alternatively, a low filler concentration cannot reach the percolation threshold and/or produces small networks that do not influence the conductivity. Moreover, larger CNTs lead to a smaller percolation threshold and produce larger networks in nanocomposites. Therefore, it is sensible to achieve a higher conductivity by using large CNTs. Similar impacts of “ϕf” and “l” on the conductivity of nanocomposites have been reported previously.16,48 As a result, the developed model reasonably predicts the roles of these parameters on the conductivity of PCNTs.
Fig. 4 demonstrates the effects of “R” and “u” on the conductivity of nanocomposites, while using average values of the other parameters. The highest conductivity (0.018 S m−1) is observed at R = 5 nm and u = 1, while the lowest conductivity (0.002 S m−1) is found at R = 45 nm and u = 1.5. These results indicate that both the CNT radius and waviness inversely influence the conductivity of nanocomposites. Therefore, a desirable conductivity can be obtained by using thin CNTs with small waviness, whereas thick and wavy CNTs reduce the conductivity of PCNTs.
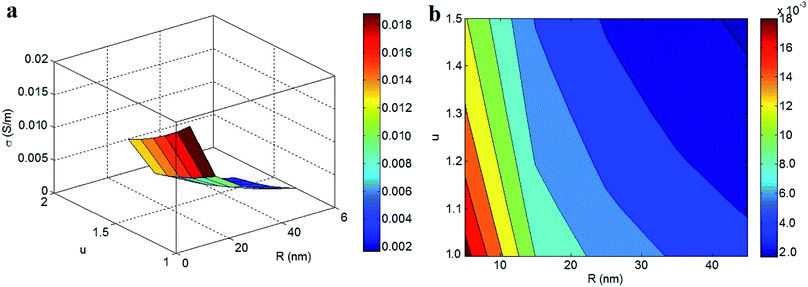 | ||
| Fig. 4 Roles of “R” and “u” parameters in the conductivity of nanocomposites at average levels of other parameters: (a) 3D and (b) contour plots. | ||
Thin and straight CNTs (no waviness) produce low percolation thresholds (eqn (8)) and high effective filler concentrations (eqn (10)). As a result, thin and straight CNTs produce larger networks in nanocomposites. Alternatively, CNTs with a larger thickness and higher waviness do not influence the conductivity as effectively; this is the case because they increase the percolation threshold and condense the interphase regions (eqn (9)). Thin and straight CNTs efficiently decrease the percolation level while the interphase zones enhance the conductivity of nanocomposites. Moreover, based on these explanations, the developed model properly predicts the impacts of “R” and “u” on the conductivity of nanocomposites.
The influences of “t” and “σf” on the conductivity of nanocomposites, as determined by the developed model, are shown in Fig. 5. The conductivity increases to 0.02 S m−1 at t > 32 nm, whereas the poorest conductivity (0.008 S m−1) is observed at t < 6 nm. Thus, the interphase thickness directly changes the conductivity of nanocomposites, even with different CNT conductivity values, indicating that the CNT conductivity does not affect the overall conductivity. These results show the important role of the interphase thickness on the conductivity of nanocomposites containing CNTs with varying conductivity.
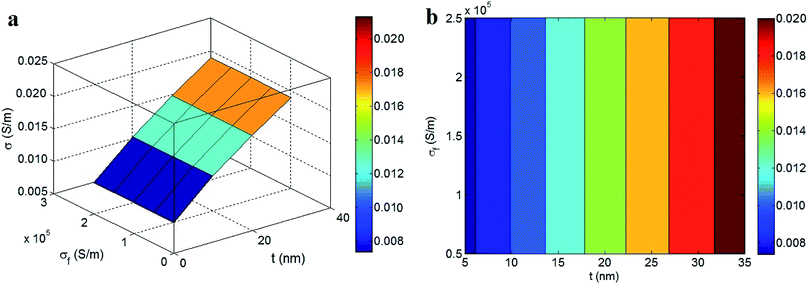 | ||
| Fig. 5 The roles of “t” and “σf” in the conductivity of nanocomposites by the developed model at average values of other parameters: (a) 3D and (b) contour designs. | ||
A thicker interphase around CNTs produces a lower percolation threshold in nanocomposites (eqn (8)); this is due to the fact that the interphase areas contribute to the conductive networks. Also, a thicker interphase produces a better interphase conductivity and a smaller interphase resistance in nanocomposites (eqn (19–21)). In other words, a thick interphase enlarges the conductive regions in nanocomposites, creating a low percolation threshold and large conductive networks. According to these observations, obtaining a higher conductivity by creating a thicker interphase is reasonable. Previous studies reported a similar trend between the conductivity of nanocomposites and the interphase thickness.16,48 However, a high filler conductivity significantly reduces the intrinsic resistances of the CNT and interphase regions (eqn (18) and (21)). In fact, a very high CNT conductivity (about 106 S m−1) produces very low resistances in the CNT and interphase regions, as compared to the tunneling resistance (eqn (25)). As a result, a high CNT conductivity overrides the influence of the CNT and interphase resistances on the conductivity of nanocomposites; thus, the conductivity of nanocomposites does not depend on the CNT conductivity. These results indicate that the developed model can successfully predict the conductivity of PCNTs. Therefore, it can be concluded that the conductivity suggested by the developed model only depends on the tunneling resistance; the low resistance values of the CNT and interphase regions do not have an effect.
Fig. 6 depicts the conductivities of nanocomposites calculated by the developed model at different levels of “d” and “ρ” while maintaining average values for the other parameters. The highest conductivity (0.05 S m−1) is produced at d = 2 nm and ρ = 100 ohm m, but the conductivity decreases to 0.003 S m−1 at d > 6 nm and ρ > 350 ohm m. Accordingly, a high conductivity is obtained with small values of “d” and “ρ”, signifying that the tunneling distance and tunneling resistivity adversely influence the conductivity of nanocomposites. A short tunneling distance and poor tunneling resistivity lead to a high conductivity in nanocomposites, and the conductivity is weakened by a larger tunneling distance and stronger tunneling resistivity. Thus, it is better to ensure short tunneling distances and poor tunneling resistivity to achieve a higher conductivity in PCNTs.
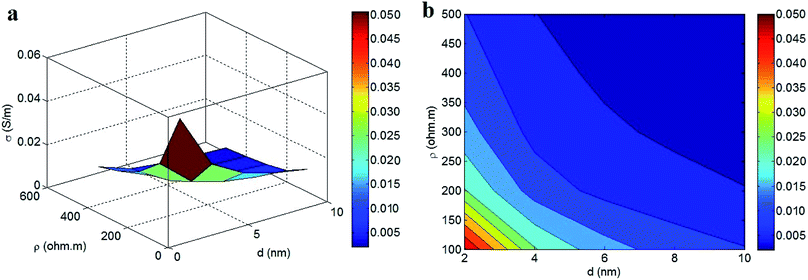 | ||
| Fig. 6 Expression of conductivity by the developed model at different levels of “d” and “ρ” parameters: (a) 3D and (b) contour plots. | ||
A large tunneling distance and the high tunneling resistivity due to the polymer matrix increase the intrinsic tunneling resistance (eqn (25)), which reduces the transportation of electrons through tunneling regions. Alternatively, a short tunneling distance and poor tunneling resistivity decrease the tunneling resistance, leading to more desirable conditions for electron transfer between adjacent CNTs. Therefore, the tunneling distance and resistivity directly affect the intrinsic tunneling resistance, as suggested by eqn (25). Since the conductivity of nanocomposites seriously depends on electron transfer through the tunneling regions, the tunneling distance and resistivity inversely control the conductivity.45,49,50 As a result, the developed model correctly reports the effects of the tunneling distance and resistivity on the conductivity of PCNTs.
Fig. 7 exhibits the predictions of the developed model at various values of “f” and “x”. The highest conductivity of 0.03 S m−1 is obtained at f = 0.7 and x < 0.017, while the conductivity is reduced to 0.004 S m−1 at f = 0.1. Accordingly, a high “f” and a low “x” are necessary to obtain desirable conductivity in nanocomposites. The presence of higher percentages of CNT and interphase regions in the networks and a low “x” exponent can improve the conductivity of nanocomposites, whereas a lower fraction of percolated CNTs cannot increase the conductivity. These results implicitly reveal that the conductivity of nanocomposites largely depends on the dimensions of the conductive networks.
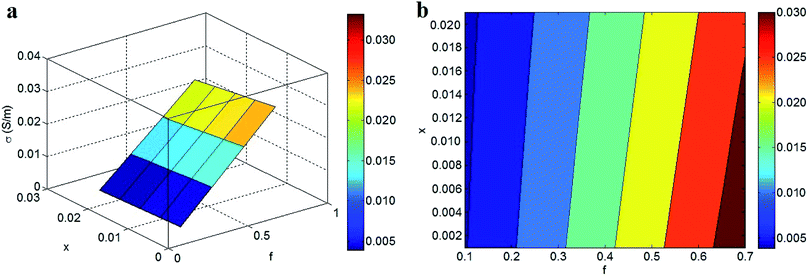 | ||
| Fig. 7 Dependences of conductivity on “f” and “x” parameters at average values of other factors: (a) 3D and (b) contour plots. | ||
A high “f” obviously increases the fractions of the nanoparticle (eqn (13)), interphase (eqn (14)), and tunneling (eqn (15)) regions in the conductive networks. In other words, a higher “f” creates larger networks containing CNTs, interphase regions, and tunneling spaces. Since large networks within nanocomposites can successfully transfer electrons, it is reasonable that a higher “f” produces superior conductivity in nanocomposites.
According to eqn (12), high filler concentrations, large interphase regions, and low percolation thresholds lead to increased values of “f”. Therefore, it is important to promote the interphase regions and decrease the percolation threshold at a constant filler fraction to produce a desired “f” value. However, the lower “f” caused by a thin interphase and high percolation threshold shortens the conductive networks and deteriorates the conductivity of nanocomposites. In addition, a high “x” exponent undesirably affects the conductivity of nanocomposites by suppressing the influences of the filler, interphase, and tunneling regions on the conductivity (eqn (26)). Accordingly, the developed model correctly reveals the effects of “f” and “x” on the conductivity of nanocomposites.
4 Conclusions
In this study, the Kovacs model was further developed by assuming that the CNT, interphase, and tunneling regions in PCNTs were separate phases. In addition, some equations were expressed to determine the volume fractions and resistances of these phases in the networks. The predictions of the developed model agreed well with the experimental data of several samples. Moreover, the developed model suggests reasonable impacts for all of the parameters on the conductivity. These results validate the ability of the developed model to predict the conductivity of PCNTs. A high conductivity is obtained with a high concentration of long, thin, straight CNTs; this is the case because the percolation threshold decreases and large networks are made under these conditions. A thicker interphase also produces a lower percolation threshold and a smaller interphase resistance in nanocomposites, thereby increasing the conductivity. However, using CNTs with high conductivity overrides the influences of the CNT and interphase resistances on the conductivity of PCNTs. Accordingly, the conductivity of PCNTs only depends on the tunneling resistance as a function of the tunneling properties. Thus, a better conductivity is obtained with shorter tunneling distances and poorer tunneling resistivity. In addition, a high value of “f” creates large networks in PCNTs that contain CNTs, interphase regions, and tunneling spaces, leading to an improvement in the conductivity.Conflicts of interest
There are no conflicts to declare.Nomenclature
| σ | Conductivity of PCNT |
| σf | CNT conductivity |
| Rf | Intrinsic resistance of CNT |
| σCNT | The conductivity of waved CNT |
| σi | Interphase conductivity |
| Rt | Tunneling resistance |
| R1 | Resistance of CNT fraction in tunneling spaces |
| R2 | Resistance of polymer in tunneling zones |
| l | CNT length |
| R | CNT radius |
| wf | Weight fraction of CNT in nanocomposite |
| x | An exponent |
| V | CNT volume |
| Vex | Excluded volume of nanoparticles |
| leq | Equivalent length of waved CNT |
| u | Waviness parameter |
| t | Interphase thickness |
| tm | Maximum interphase thickness |
| ϕp | Percolation threshold |
| ϕf | Filler volume fraction |
| f | The fraction of percolated CNT |
| ϕN | The volume fraction of CNT in the networks |
| ϕiN | The volume fraction of interphase regions in the networks |
| ϕtN | The volume fraction of tunneling spaces in the networks |
| d | Tunneling distance between adjacent CNT |
| ρ | Tunneling resistivity |
| S | Contact area between two CNT |
References
- W. Cai, M. Li, S. Wang, Y. Gu, Q. Li and Z. Zhang, Strong, flexible and thermal-resistant CNT/polyarylacetylene nanocomposite films, RSC Adv., 2016, 6, 4077–4084 RSC.
- T. Wu and B. Chen, Autonomous self-healing multiwalled carbon nanotube nanocomposites with piezoresistive effect, RSC Adv., 2017, 7, 20422–20429 RSC.
- C. Tsonos, N. Soin, G. Tomara, B. Yang, G. C. Psarras, A. Kanapitsas and E. Siores, Electromagnetic wave absorption properties of ternary poly(vinylidene fluoride)/magnetite nanocomposites with carbon nanotubes and graphene, RSC Adv., 2016, 6, 1919–1924 RSC.
- T. Kaur and A. Thirugnanam, Tailoring in vitro biological and mechanical properties of polyvinyl alcohol reinforced with threshold carbon nanotube concentration for improved cellular response, RSC Adv., 2016, 6, 39982–39992 RSC.
- J. B. Marroquin, K. Rhee and S. Park, Chitosan nanocomposite films: enhanced electrical conductivity, thermal stability, and mechanical properties, Carbohydr. Polym., 2013, 92, 1783–1791 CrossRef PubMed.
- L. Tzounis, M. Liebscher, A. Tzounis, E. Petinakis, A. Paipetis, E. Mäder and M. Stamm, CNT-grafted glass fibers as a smart tool for epoxy cure monitoring, UV-sensing and thermal energy harvesting in model composites, RSC Adv., 2016, 6, 55514–55525 RSC.
- A. Rostami, H. Nazockdast and M. Karimi, Graphene induced microstructural changes of PLA/MWCNT biodegradable nanocomposites: rheological, morphological, thermal and electrical properties, RSC Adv., 2016, 6, 49747–49759 RSC.
- Y. Zare, H. Garmabi and K. Y. Rhee, Structural and phase separation characterization of poly(lactic acid)/poly(ethylene oxide)/carbon nanotube nanocomposites by rheological examinations, Composites, Part B, 2018, 144, 1–10 CrossRef.
- Y. Zare and K. Y. Rhee, Prediction of tensile modulus in polymer nanocomposites containing carbon nanotubes (CNT) above percolation threshold by modification of conventional model, Current Applied Physics, 2017, 17, 873–879 CrossRef.
- J.-M. Zhu, Y. Zare and K. Y. Rhee, Analysis of the roles of interphase, waviness and agglomeration of CNT in the electrical conductivity and tensile modulus of polymer/CNT nanocomposites by theoretical approaches, Colloids Surf., A, 2018, 539, 29–36 CrossRef.
- M. H. Al-Saleh, Influence of conductive network structure on the EMI shielding and electrical percolation of carbon nanotube/polymer nanocomposites, Synth. Met., 2015, 205, 78–84 CrossRef.
- E. Logakis, P. Pissis, D. Pospiech, A. Korwitz, B. Krause, U. Reuter and P. Pötschke, Low electrical percolation threshold in poly(ethylene terephthalate)/multi-walled carbon nanotube nanocomposites, Eur. Polym. J., 2010, 46, 928–936 CrossRef.
- A. Abdolmaleki, S. Mallakpour and S. Borandeh, Amino acid-functionalized multi-walled carbon nanotubes for improving compatibility with chiral poly(amide-ester-imide) containing l-phenylalanine and l-tyrosine linkages, Appl. Surf. Sci., 2013, 287, 117–123 CrossRef.
- C. Choi, S. Park and H. Choi, Carbon nanotube/polyaniline nanocomposites and their electrorheological characteristics under an applied electric field, Curr. Appl. Phys., 2007, 7, 352–355 CrossRef.
- Y. Zare and K. Y. Rhee, Development of a model for electrical conductivity of polymer graphene nanocomposites assuming interphase and tunneling regions in conductive networks, Ind. Eng. Chem. Res., 2017, 56(32), 9107–9115 CrossRef.
- Y. Zare and K. Y. Rhee, Development of a conventional model to predict the electrical conductivity of polymer/carbon nanotubes nanocomposites by interphase, waviness and contact effects, Composites, Part A, 2017, 100, 305–312 CrossRef.
- Y. Zare and K. Y. Rhee, Development and modification of conventional Ouali model for tensile modulus of polymer/carbon nanotubes nanocomposites assuming the roles of dispersed and networked nanoparticles and surrounding interphases, J. Colloid Interface Sci., 2017, 506, 283–290 CrossRef PubMed.
- Y. Zare and K. Y. Rhee, Development of Hashin–Shtrikman model to determine the roles and properties of interphases in clay/CaCO3/PP ternary nanocomposite, Appl. Clay Sci., 2017, 137, 176–182 CrossRef.
- P. Jahanmard and A. Shojaei, Mechanical properties and structure of solvent processed novolac resin/layered silicate: development of interphase region, RSC Adv., 2015, 5, 80875–80883 RSC.
- Y. Zare, K. Y. Rhee and S.-J. Park, Predictions of micromechanics models for interfacial/interphase parameters in polymer/metal nanocomposites, Int. J. Adhes. Adhes., 2017, 79, 111–116 CrossRef.
- Y. Zare and K. Y. Rhee, Dependence of Z Parameter for Tensile Strength of Multi-Layered Interphase in Polymer Nanocomposites to Material and Interphase Properties, Nanoscale Res. Lett., 2017, 12, 42 CrossRef PubMed.
- Y. Zare, A model for tensile strength of polymer/clay nanocomposites assuming complete and incomplete interfacial adhesion between the polymer matrix and nanoparticles by the average normal stress in clay platelets, RSC Adv., 2016, 6, 57969–57976 RSC.
- G. Mittal, K. Y. Rhee, S. J. Park and D. Hui, Generation of the pores on graphene surface and their reinforcement effects on the thermal and mechanical properties of chitosan-based composites, Composites, Part B, 2017, 114, 348–355 CrossRef.
- G. Mittal, K. Y. Rhee, V. Mišković-Stanković and D. Hui, Reinforcements in multi-scale polymer composites: processing, properties, and applications, Composites, Part B, 2018, 138, 122–139 CrossRef.
- R. Qiao and L. C. Brinson, Simulation of interphase percolation and gradients in polymer nanocomposites, Compos. Sci. Technol., 2009, 69, 491–499 CrossRef.
- H.-x. Li, Y. Zare and K. Y. Rhee, The percolation threshold for tensile strength of polymer/CNT nanocomposites assuming filler network and interphase regions, Mater. Chem. Phys., 2018, 207, 76–83 CrossRef.
- R. Razavi, Y. Zare and K. Y. Rhee, A model for tensile strength of polymer/carbon nanotubes nanocomposites assuming the percolation of interphase regions, Colloids Surf., A, 2018, 538, 148–154 CrossRef.
- F. Du, R. C. Scogna, W. Zhou, S. Brand, J. E. Fischer and K. I. Winey, Nanotube networks in polymer nanocomposites: rheology and electrical conductivity, Macromolecules, 2004, 37, 9048–9055 CrossRef.
- C. Li, E. T. Thostenson and T.-W. Chou, Dominant role of tunneling resistance in the electrical conductivity of carbon nanotube-based composites, Appl. Phys. Lett., 2007, 91, 223114 CrossRef.
- R. Razavi, Y. Zare and K. Y. Rhee, A two-step model for the tunneling conductivity of polymer carbon nanotube nanocomposites assuming the conduction of interphase regions, RSC Adv., 2017, 7, 50225–50233 RSC.
- T. Takeda, Y. Shindo, Y. Kuronuma and F. Narita, Modeling and characterization of the electrical conductivity of carbon nanotube-based polymer composites, Polymer, 2011, 52, 3852–3856 CrossRef.
- F. Deng and Q.-S. Zheng, An analytical model of effective electrical conductivity of carbon nanotube composites, Appl. Phys. Lett., 2008, 92, 071902 CrossRef.
- J. Z. Kovacs, B. S. Velagala, K. Schulte and W. Bauhofer, Two percolation thresholds in carbon nanotube epoxy composites, Compos. Sci. Technol., 2007, 67, 922–928 CrossRef.
- Z. Tu, J. Wang, C. Yu, H. Xiao, T. Jiang, Y. Yang, D. Shi, Y.-W. Mai and R. K. Li, A facile approach for preparation of polystyrene/graphene nanocomposites with ultra-low percolation threshold through an electrostatic assembly process, Compos. Sci. Technol., 2016, 134, 49–56 CrossRef.
- C. Feng and L. Jiang, Micromechanics modeling of the electrical conductivity of carbon nanotube (CNT)–polymer nanocomposites, Composites, Part A, 2013, 47, 143–149 CrossRef.
- L. Berhan and A. Sastry, Modeling percolation in high-aspect-ratio fiber systems. I. Soft-core versus hard-core models, Phys. Rev. E, 2007, 75, 041120 CrossRef PubMed.
- X. L. Ji, K. J. Jiao, W. Jiang and B. Z. Jiang, Tensile modulus of polymer nanocomposites, Polym. Eng. Sci., 2002, 42, 983 Search PubMed.
- J. Li, P. C. Ma, W. S. Chow, C. K. To, B. Z. Tang and J. K. Kim, Correlations between percolation threshold, dispersion state, and aspect ratio of carbon nanotubes, Adv. Funct. Mater., 2007, 17, 3207–3215 CrossRef.
- P. Joshi and S. Upadhyay, Effect of interphase on elastic behavior of multiwalled carbon nanotube reinforced composite, Comput. Mater. Sci., 2014, 87, 267–273 CrossRef.
- M. Zappalorto, M. Salviato and M. Quaresimin, Influence of the interphase zone on the nanoparticle debonding stress, Compos. Sci. Technol., 2011, 72, 49–55 CrossRef.
- M. Mohiuddin and S. V. Hoa, Estimation of contact resistance and its effect on electrical conductivity of CNT/PEEK composites, Compos. Sci. Technol., 2013, 79, 42–48 CrossRef.
- Y. J. Kim, T. S. Shin, H. Do Choi, J. H. Kwon, Y.-C. Chung and H. G. Yoon, Electrical conductivity of chemically modified multiwalled carbon nanotube/epoxy composites, Carbon, 2005, 43, 23–30 CrossRef.
- Y. Mamunya, A. Boudenne, N. Lebovka, L. Ibos, Y. Candau and M. Lisunova, Electrical and thermophysical behaviour of PVC–MWCNT nanocomposites, Compos. Sci. Technol., 2008, 68, 1981–1988 CrossRef.
- F. H. Gojny, M. H. Wichmann, B. Fiedler, I. A. Kinloch, W. Bauhofer, A. H. Windle and K. Schulte, Evaluation and identification of electrical and thermal conduction mechanisms in carbon nanotube/epoxy composites, Polymer, 2006, 47, 2036–2045 CrossRef.
- S. Maiti, N. K. Shrivastava and B. Khatua, Reduction of percolation threshold through double percolation in melt-blended polycarbonate/acrylonitrile butadiene styrene/multiwall carbon nanotubes elastomer nanocomposites, Polym. Compos., 2013, 34, 570–579 CrossRef.
- Y. Zare, The roles of nanoparticles accumulation and interphase properties in properties of polymer particulate nanocomposites by a multi-step methodology, Composites, Part A, 2016, 91, 127–132 CrossRef.
- Y. Zare, K. Y. Rhee and D. Hui, Influences of nanoparticles aggregation/agglomeration on the interfacial/interphase and tensile properties of nanocomposites, Composites, Part B, 2017, 122, 41–46 CrossRef.
- Y. Zare and K. Y. Rhee, A simple methodology to predict the tunneling conductivity of polymer/CNT nanocomposites by the roles of tunneling distance, interphase and CNT waviness, RSC Adv., 2017, 7, 34912–34921 RSC.
- S. Maiti, S. Suin, N. K. Shrivastava and B. Khatua, Low percolation threshold in polycarbonate/multiwalled carbon nanotubes nanocomposites through melt blending with poly(butylene terephthalate), J. Appl. Polym. Sci., 2013, 130, 543–553 CrossRef.
- N. Ryvkina, I. Tchmutin, J. Vilčáková, M. Pelíšková and P. Sáha, The deformation behavior of conductivity in composites where charge carrier transport is by tunneling: theoretical modeling and experimental results, Synth. Met., 2005, 148, 141–146 CrossRef.
| This journal is © The Royal Society of Chemistry 2018 |

