 Open Access Article
Morphology- and pH-dependent peroxidase mimetic activity of nanoceria†
Xiaoshu Wei,
Xiaofeng Li,
Yuqian Feng and
Sen Yang *
*
Beijing Key Laboratory of Farmland Soil Pollution Prevention and Remediation, College of Resources and Environmental Sciences, China Agricultural University, Beijing 100193, PR China. E-mail: syang@cau.edu.cn; Tel: +86 1062733470
First published on 27th March 2018
Abstract
The peroxidase mimetic properties of nanoceria have attracted extensive attention in recent years. In this work, the peroxidase mimetic properties of CeO2 nanocrystals with different morphologies, namely, nanocubes and nanorods, were investigated. Two types of oxidative species, HO˙ radicals and peroxide-like intermediates, were identified in the CeO2/H2O2 systems. The formation of these oxidative species is strongly dependent on the pH value and the morphology of the CeO2 nanocrystals. The origin of the peroxidase mimetic activity of nanoceria was mainly ascribed to the presence of HO˙ under acidic conditions, whereas the peroxide-like species also played a major role under neutral and basic conditions. CeO2 nanorods with excellent redox properties and higher concentration of Ce3+ and oxygen vacancies were more favorable for the generation of both HO˙ and peroxide-like intermediates than that of CeO2 nanocubes, exhibiting excellent peroxidase mimetic activity toward 2,2′-azino-bis(3-ethylbenzothiazoline-6-sulfonic acid) (ABTS), methylene blue (MB), and congo red (CR) in the presence of H2O2.
1 Introduction
Nanoceria has been extensively used in the field of catalysis because of the facile redox cycles between Ce3+ and Ce4+.1–3 Among various catalytic applications of nanoceria, one interesting phenomenon is the peroxidase mimetic behavior, that is, some active oxidative species can be generated and some substrates can be oxidized concurrently during the catalytic decomposition of H2O2.4–6 For example, it has been reported that CeO2 nanoparticles exhibited excellent catalytic oxidation activity towards the classical peroxidase substrate 3,3,5,5-tetramethylbiphenyl dihydrochloride in the presence of H2O2.7 Because of their peroxidase mimetic properties, nanoceria and cerium-containing materials have been widely used in medical diagnosis, biosensing, and Fenton-like processes for the degradation of organic pollutants.8–11Several oxidative species have been detected or proposed during the catalytic decomposition of H2O2 by nanoceria.5,12,13 Liu et al.8 attributed the peroxidase mimetic activity of H2TCPP-CeO2 nanocomposites to the formation of HO·, which was confirmed with a fluorescent probe technique. Lousada et al.14 confirmed the formation of HO· and studied the dynamics of formation of HO·. Besides HO·, the generation of other oxygen-derived free radicals such as HO2·, O2·, and O2− have also been suggested.15,16 However, several researchers have attributed the oxidation ability of nanoceria to some brown peroxide-like intermediates,17–20 which oxidize organic substances through intermolecular rearrangement.17,21,22 Although the exact structure of the active oxidative species responsible for the peroxidase mimetic activity of nanoceria have not been fully elucidated, it is believed that the pH value of the reaction medium has a significant influence on the peroxidase mimetic properties of nanoceria.8 Most studies have shown that nanoceria could be used as a peroxidase mimic in the pH range of 2.0–6.0,7,23 whereas a few studies have shown that the peroxidase mimetic activity of nanoceria could be observed at even higher pH values.13,21 Therefore, further study is still needed to understand the relationship between the pH of the solution and the nature of the oxidative species and their oxidation abilities.
The peroxidase mimetic property of nanoceria originates from the redox cycles between Ce3+ and Ce4+.15,24 Generally, the easier the redox cycles between Ce3+ and Ce4+, the better the peroxidase mimetic activity of nanoceria.12 Up to now, several strategies including doping ceria with heteroatom ions such as Zr4+ and decreasing the particle size of the ceria particles has been used to enhance the peroxidase mimetic activity of ceria.12,17,23 Zhou et al. reported that the redox performance of nanoceria could also be optimized by tuning the crystal planes exposed on the surfaces.25 Since then, a series of studies have been carried out to optimize the catalytic performance of nanoceria for various reactions by tuning the morphology of CeO2 nanocrystals.26–29 However, to the best of our knowledge, the influence of the exposed crystal facet on the peroxidase mimetic activity of nanoceria has only been reported in a recent paper, which found that the Fenton-like reactivity of CeO2 nanocrystal was related to their exposed facets.30 Therefore, it is worth applying nanoceria with different morphologies as peroxidase mimetics to optimize the catalytic activity and understand the underlying mechanisms of the nanoceria mimic enzyme.
In this work, CeO2 nanocubes and nanorods were prepared by a hydrothermal method and their peroxidase mimetic properties were investigated under both acidic and basic conditions. Our studies revealed a strong morphology-dependent peroxidase mimetic activity of nanoceria. The nature of the active oxidative species at different pH values and their oxidation abilities were investigated to gain a deep understanding of the mechanism of the peroxidase-mimetic activity of nanoceria.
2 Experiments
2.1 Materials
Ce(NO3)3·6H2O, NaOH, HCl, H2O2 (30%, w/w), n-butyl alcohol, methylene blue (MB) and congo red (CR) were purchased from Sinopharm Chemical Reagent Co. Ltd (Shanghai, China). Catalase, 2,2′-azino-bis(3-ethylbenzothiazoline-6-sulfonic acid) (ABTS) and 5,5-dimethyl-1-pyrroline N-oxide (DMPO) were obtained from Sigma-Aldrich Co. LLC. (Saint Louis, USA). All reagents were of analytical reagent grade and were used without further purification.2.2 Synthesis of CeO2 nanocubes and CeO2 nanorods
CeO2 nanocatalysts were synthesized through a hydrothermal process.25,31 Typically, Ce(NO3)3·6H2O (1.5 g) was dissolved in distilled water, and an appropriate amount of 10% NaOH solution was rapidly added to give a final NaOH concentration of approximately 2.0 M. After stirring for approximately 15 min, the slurry (approximately 40 mL) was placed into a 50 mL Teflon-sealed autoclave and heated. The morphology of the as-prepared nanoceria depended on the hydrothermal temperature and reaction time, that is, nanocubes were formed by heating at 180 °C for 24 h and nanorods were formed by heating at 120 °C for 12 h. After cooling, the final product was collected by filtration, washed with deionized water, and then dried at 60 °C.2.3 Catalyst characterization
The size and morphology of the nanoceria was characterized with a JEM-2100F high-resolution transmission electron microscope (HRTEM, JEOL, Japan). The powder X-ray diffraction (XRD) patterns were obtained on an D8 Advance X-ray diffractometer (Bruker, Germany) with Ni-filtered Cu Kα radiation (λ = 0.1541 nm). The Brunauer–Emmett–Teller (BET) surface area was evaluated from nitrogen adsorption–desorption data recorded at 77 K using a model NOVA 3200e automated gas sorption system (Quantachrome, USA). X-ray photoelectron spectra (XPS) measurements were performed on an ESCALAB 250Xi high-performance electron spectrometer (Thermo Fisher, USA) using monochromatized Al Kα (hν = 1486.6 eV) as the excitation source. Raman spectra were collected by a Raman spectrometer (Renishaw inVia, UK) with a laser wavelength of 514.5 nm. Hydrogen temperature-programmed reduction (H2-TPR) was conducted with a ChemiSorb 2750 apparatus (Micromeritics, USA) equipped with a TCD detector. TPR was performed by heating the nanoceria samples (50 mg) at 10 °C min−1 from 50–700 °C in a 5 vol% H2–N2 mixture with a flow rate of 25 mL min−1.2.4 Electron paramagnetic resonance (EPR) measurements
To monitor the potential radicals formed in the nanoceria/H2O2 system, DMPO was used as the spin trap and EPR spectra were recorded using a JES-FA200 EPR spectrometer (X-band) with dual cavities (JEOL, Japan). Typical parameters were as follows: modulation frequency, 100 kHz; microwave frequency, 9.05 GHz; sweep width, 50 G; EPR microwave power, 3 mW; modulation amplitude, 1 G; time constant, 0.03 s; and sweep time, 2 min.2.5 Peroxidase mimetics activity of nanoceria
The catalytic reaction was performed at 25 °C using 1 g L−1 CeO2 with 2 mM ABTS, 15 mg L−1 MB or 70 mg L−1 CR as substrate and 20 mM H2O2, unless otherwise stated. Generally, catalyst powder was added into a conical flask containing an aqueous solution of the substrate. Then, a H2O2 solution was added to initiate the oxidation reaction. To avoid the influence of ions on the nanoceria activity, ultrapure water was used in the test, and the initial pH of the reaction system was adjusted using 0.1 M HCl and 0.1 M NaOH solution. The concentration of organics and H2O2 in supernatant was analyzed by using a UV–vis spectrophotometer (Beijing Purkinje General, China). The maximum wavelengths (λmax) of H2O2, ABTS˙+, MB and CR are 240, 734, 664 and 497 nm, respectively.3 Results and discussion
3.1 Characterization of CeO2 nanocubes and nanorods
The morphologies of the as-prepared samples were examined by transmission electron microscopy (TEM). The CeO2 nanocubes had uniform cubic shapes with a size of 20–30 nm (Fig. 1a). The HRTEM image in Fig. 1b shows an interplanar spacing of 0.27 nm, corresponding to the (200) lattice fringe of CeO2, which indicates that the nanocubes were mainly enclosed by the (100) facets.31 As shown in Fig. 1c, CeO2 nanorods had diameters of approximately 15–20 nm and lengths of 100–200 nm. The HRTEM analysis (Fig. 1d) revealed that the nanorods were single-crystalline and their growth direction was (110). This was consistent with the previously reported results that nanorods expose their (110) and (100) facets.25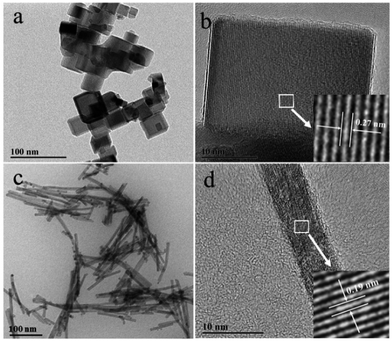 | ||
| Fig. 1 TEM images of (a) CeO2 nanocubes and (c) nanorods, and HRTEM images of (b) CeO2 nanocubes and (d) nanorods. | ||
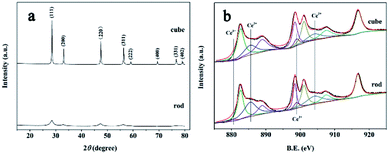
The XRD patterns of the CeO2 nanocubes and nanorods are shown in Fig. 2a. All the diffraction peaks of both samples can be indexed to the pure fluorite structure of CeO2 (JCPDS 34-0394).28 The sharper peaks of the nanocubes indicated their higher crystallinity and bigger crystallite size than those of the nanorods,26 which was consistent with the TEM and HRTEM analysis. The specific surface areas of the nanocerias were measured by a nitrogen gas adsorption–desorption isotherm and calculated by the BET method. The nanorods exhibited a larger specific surface area (89.9 m2 g−1) than that of the nanocubes (39.7 m2 g−1).
The valence state of the Ce ions in the nanocerias was determined by XPS and the results are shown in Fig. 2b. The Ce3d XPS spectra revealed that a mixed valence state (Ce3+ and Ce4+) was present and most of the Ce ions were Ce4+ in both nanoceria samples.32 However, the peaks attributed to Ce3+ in the nanorods, were clearly stronger than those for the nanocubes, as marked in Fig. 2b, indicating that more Ce3+ was on the surface of the nanorods.33,34 The Ce3d spectra were fitted using PeakFit software to calculate the Ce3+ concentration on the surface of both samples. The relative concentration of Ce3+ on the surface of the nanorods was 34.7%, which was much larger than that of the nanocubes (23.3%). The presence of more Ce3+ indicated that there were more oxygen vacancies in the CeO2 nanorods, which was further verified by Raman analysis.
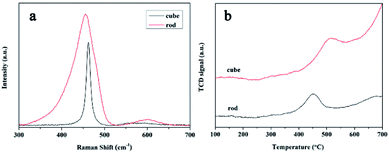
Fig. 3a displays the Raman spectra of the samples; two bands were observed for both samples. The presence of the prominent F2g vibrational mode band at approximately 460 cm−1 was ascribed to the symmetric mode of the oxygen atoms around the cerium ions.28 Compared with that of CeO2 nanorods, the Raman band of the nanocubes displayed a clear increase in symmetry and a decrease in the full width at half maximum, along with an evident shift towards higher wave numbers. This was attributed to the higher degree of crystallinity and larger crystallite size of the nanocubes.35,36 The weak band at approximately 590 cm−1 was associated to the defect-induced mode (D).35 The degree of defect sites on CeO2 was estimated using the relative intensity of D/F2g.28,36 The D/F2g ratio of the CeO2 nanorods was 0.056, which was higher than that of the nanocubes (0.023). This implied that CeO2 nanorods had more defect sites such as oxygen vacancies, which was consistent with the XPS results.
The presence of more Ce3+ and defects in CeO2 nanorods suggested that the nanorods could be more reducible than the nanocubes. Subsequently, the redox properties of the nanoceria samples were examined by H2-TPR. The TPR profiles (Fig. 3b) of both samples showed two reduction bands, one located below 580 °C and one above 600 °C. The low-temperature reduction band is related to the surface oxygen reduction and is of particular interest in catalytic reactions.32 The low-temperature peak position of the CeO2 nanorods was at 450 °C, which was much lower than that of the nanocubes (510 °C), indicating that the CeO2 nanorods were much more reducible than the nanocubes.28 The facile redox performance of the CeO2 nanorods indicated that the CeO2 nanorods should perform well as peroxidase mimetics.
3.2 H2O2 decomposition and probing the possible oxidative species
The decomposition of H2O2 over CeO2 nanocubes and nanorods was first investigated from pH 3.0 to 9.0. This set of data is for 20 mM H2O2 in the presence of 1 g L−1 CeO2 at 25 °C. Fig. 4a shows the H2O2 concentration changes as a function of time. The decomposition of H2O2 in the presence of CeO2 follows first-order kinetics as previous reported (Fig. S1†).14,37 The rate coefficients are given in Table S1.† It is clear that the effect of the pH on the decomposition of H2O2 over nanoceria is not obvious and only a slight increase in conversion can be observed with increasing pH from 3.0 to 9.0.38 However, CeO2 nanorods display higher activity over all reactivity towards H2O2. When the amount of eliminated H2O2 was normalized to the surface area of nanocubes and nanorods, CeO2 nanorods still possessed higher level of activity (Fig. 4b).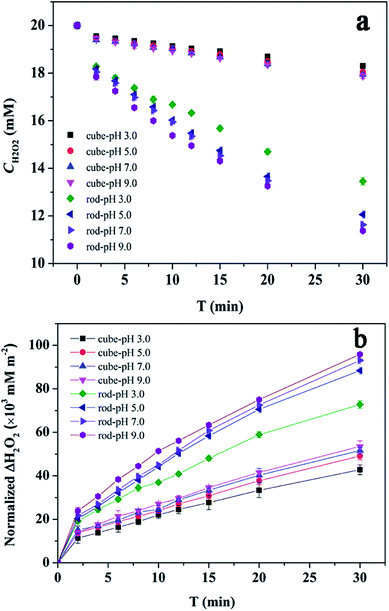 | ||
| Fig. 4 Catalytic activity of CeO2: (a) concentration changes of H2O2 as a function of reaction time and (b) the eliminated H2O2 was normalized to CeO2 surface area (20 mM H2O2, 1 g L−1 CeO2, 25 °C). | ||
It has been reported that nanoceria could facilitate the decomposition of H2O2 to produce HO˙ through a series of reactions analogous to Fenton/Haber Weiss reactions:15,39,40
| Ce3+ + H2O2 + H+ → Ce4+ + OH˙ + H2O | (1) |
| OH˙ + H2O2 → HO2− + H2O | (2) |
| Ce4+ + HO2− → O2 + Ce3+ + H+ | (3) |
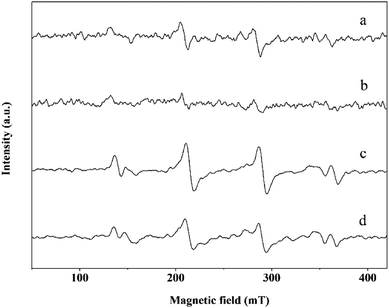
To probe the possible generation of HO˙ during the catalytic decomposition of H2O2 over nanoceria, EPR was performed using the DMPO as a spin trap. As shown in Fig. 5, a 4-line EPR spectrum characteristic of DMPO-OH adducts was detected for a suspension of nanorods upon the addition of H2O2, but the intensity of the DMPO-OH signal decreased from pH 3.0 to pH 9.0. Similar results were obtained for a suspension of nanocubes, except the intensity of the DMPO-OH peaks was significantly lower than those of the nanorods under the same conditions. These results clearly show that HO˙ can be generated in the catalytic decomposition of H2O2 and the yield of HO˙ is decreased with increasing pH from 3.0 to 9.0.22,41 And CeO2 nanorods with better redox properties were more favorable for the generation of HO˙ than their nanocube counterparts. Then the ability of the nanoceria to generate HO˙ strongly depends on its redox properties.40
It should be noted that a rapid color change was observed upon the addition of H2O2 into the nanoceria suspensions: the nanocubes suspension became light yellow and the nanorods suspension became deep yellow (Fig. 6). The color change was attributed to the formation of another type of oxidative species (the peroxide-like intermediates) from the reaction between H2O2 and CeO2.12,19,38 The small variations in the color change of nanoceria from pH 3.0 to 9.0 were almost completely imperceptible to the eye, indicating that the formation of peroxide-like intermediates was independent of the pH value. Compared with the suspension of the nanocubes/H2O2, the deeper color of the nanorods/H2O2 system indicated more peroxide-like species were generated owing to the presence of more Ce3+ and oxygen vacancies, as proved by XPS and Raman analysis. A generally accepted view is that the ease of Ce3+/Ce4+ redox cycles plays a significant role in the decomposition of H2O2 and the generation of peroxide-like intermediates.21 In this process, the rate of Ce3+ oxidation is much faster than that of Ce4+ reduction, and high concentration of Ce3+ would enhance the reducibility of ceria.32,38,42 Therefore, high peroxidase mimetic activity of ceria nanorods can be attributed to the high concentration of Ce3+ and the better reducibility.
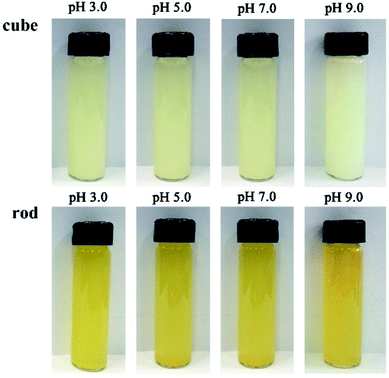 | ||
| Fig. 6 Photographs of nanoceria suspensions after the addition of H2O2 at various pH (50 mM H2O2, 0.5 g L−1 CeO2). | ||
The above results show that there were two types of oxidative species, namely HO˙ and peroxide-like intermediates, which can be generated in the nanoceria/H2O2 systems. The formation of these oxidative species was strongly dependent on the pH value and the morphology of the CeO2 nanocrystals, which determined the peroxidase mimetic performance of nanoceria.
3.3 Peroxidase mimetic activity of CeO2 nanocubes and nanorods
The peroxidase mimetic activity of the CeO2 samples was evaluated semiquantitatively by the oxidation of ABTS in the presence of H2O2 from pH 3.0 to 9.0. ABTS is typically used as a horseradish peroxidase substrate, which develops a green color (ABTS˙+) upon oxidation in aqueous solution. Control experiments showed that the color change of the systems was negligible without the presence of nanoceria or H2O2 (Fig. S2†). As shown in Fig. 7, a distinct and rapid change of the nanoceria/H2O2 suspension to a green color was observed upon the addition of ABTS, indicating that nanoceria did exhibit high peroxidase-mimetic activity, as reported previously.7,10 Compared with the nanocubes, the nanorods exhibited a higher activity under the current conditions, which could be explained by the generation of more HO· and peroxide-like intermediates owing to their better redox property and high concentration of Ce3+ and oxygen vacancies. Moreover, it is evident that the color of the suspensions changes from dark green to lighter with pH value from 3.0 to 9.0, showing a strong pH-dependent peroxidase mimetic activity of nanoceria. Nanoceria display higher peroxidase mimetic activity at acidic conditions and the time-dependent UV-vis spectra of the oxidized product of ABTS (ABTS˙+) at room temperature are shown in Fig. 8. To further understand the peroxidase mimetic behaviors of the ceria nanocubes and nanorods, decolorization of MB and CR were carried out.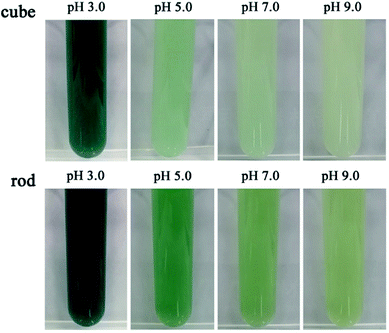 | ||
| Fig. 7 The pH effect on the production of colored product owing to ABTS oxidation in the nanoceria/H2O2 system (0.2 g L−1 CeO2, 10 mM H2O2, 5 mM ABTS, t: 2 min). | ||
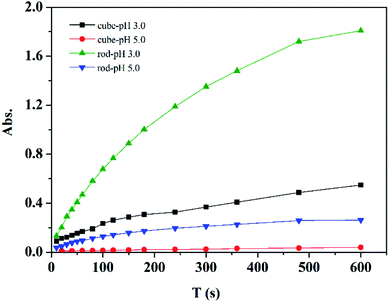 | ||
| Fig. 8 Time-dependent absorbance changes at 734 nm of ABTS in different systems (0.1 g L−1 CeO2, 5 mM H2O2 and 2 mM ABTS). | ||
3.4 Decolorization of MB and CR in nanoceria/H2O2 system
First, decolorization of 15 mg L−1 MB with 1.0 g L−1 nanoceria and 20 mM H2O2 at pH 3.0 was investigated. It turned out that the decolorization of MB over nanorods was 11.6% after 30 min, while only 4.8% was achieved over nanocubes. To investigate the role of HO· and peroxide-like intermediates in the decolorization process, we performed this experiment by adding 200 mM n-butanol as a radical scavenger before the reaction was initiated. Excess n-butanol in solution can scavenge all the HO· produced in the H2O2 decomposition process and inhibit the degradation of MB.40 As expected, the decolorization of MB was completely inhibited in the presence of n-butanol. This result verified that the peroxidase mimetic activity of nanoceria was mainly owing to the formation of HO· under acidic conditions.13,14 It is well known that HO˙ exhibits high reactivity and can non-selectively oxidize most organic compounds at near diffusion-controlled rates under acidic condition.43 Although the peroxide-like intermediates were also present, it seemed they did not work. In fact, Chen et al.44 and Hamoud et al.12 reported that the peroxide-like intermediates were prone to decompose in to HO˙ under acidic conditions. This can be used to explain the complete inhibition decolorization of MB in the presence of n-butanol.Subsequently, the decolorization of MB at pH 9.0 was carried out. Because of the strong adsorption on ceria arising under these conditions (pH 9.0), both adsorption and oxidative degradation contributed to the total decolorization. After eliminating the interference arising from adsorption, the degradation of MB was obtained (more information is provided in the ESI†). After 0.5 h, the degradation of MB in the presence of CeO2 nanorods and nanocubes was only 5.3% and 3.4%, respectively. These results suggested that nanoceria/H2O2 system could degrade MB at pH 9.0 but the peroxidase mimetic reactivity of nanoceria was much lower than that at pH 3.0. To further understand the peroxidase-mimetic activity of nanoceria under basic conditions, the degradation of CR, a typical anionic azodye, was investigated at pH 9.0. The CR (70 mg L−1) could be completely degraded after 1 h in the presence of nanorods, whereas the degradation was only 8.2% in the presence of nanocubes. Interestingly, this time, the addition of n-butanol could not completely inhibit the degradation of both MB and CR under basic conditions, although the degradation rates of dye were decreased with a certain extent. For example, the complete degradation time of CR in nanorods/H2O system was delayed from 1 h to 2.5 h upon addition of n-butanol. These results suggested that both HO· and the peroxide-like intermediates were acting as the oxidative species in the nanoceria/H2O2 system under basic conditions.29 According to previous reports, under neutral and basic conditions, the peroxide-like intermediates can directly function as peroxidase-like active sites23,45 or induce an intermolecular rearrangement to achieve the oxidation of organics.21,22 Because oxidation ability of HO˙ was much weaker under basic conditions than acidic conditions,12,46 the importance of the peroxide-like intermediates was raised.
4 Conclusions
Nanoceria possesses strong morphology- and pH-dependent peroxidase-like activity for the degradation of ABTS, MB and CR. Two types of oxidative species were generated in the nanoceria/H2O2 systems, namely, HO˙ and peroxide-like intermediates. Under acidic conditions, HO˙ are primarily responsible for the peroxidase mimetic activity of nanoceria; under neutral and basic conditions, HO˙ and peroxide-like intermediates are responsible for activity. Compared with CeO2 nanocubes, ceria nanorods exhibited a higher peroxidase activity owing to their excellent redox property and more Ce3+ and oxygen vacancies.Conflicts of interest
There are no conflicts to declare.Acknowledgements
The authors are grateful for the financial support provided by the National Natural Science Foundation of China (Grant No. 21476251).References
- M. Tamura and K. Tomishige, Angew. Chem., Int. Ed., 2015, 54, 864 CrossRef CAS PubMed
.
- T. Montini, M. Melchionna, M. Monai and P. Fornasiero, Chem. Rev., 2016, 116, 5987 CrossRef CAS PubMed
.
- A. Trovarelli, Catal. Rev.: Sci. Eng., 1996, 38, 439 CAS
.
- M. Das, S. Patil, N. Bhargava, J. F. Kang, L. M. Riedel, S. Seal and J. J. Hickman, Biomaterials, 2007, 28, 1918 CrossRef CAS PubMed
.
- W. Lin, Y.-w. Huang, X.-D. Zhou and Y. Ma, Int. J. Toxicol., 2006, 25, 451 CrossRef CAS PubMed
.
- C. Xu and X. G. Qu, NPG Asia Mater., 2014, 6, e90 CrossRef CAS
.
- X. Jiao, H. J. Song, H. H. Zhao, W. Bai, L. C. Zhang and Y. Lv, Anal. Methods, 2012, 4, 3261 RSC
.
- Q. Y. Liu, Y. Y. Ding, Y. T. Yang, L. Y. Zhang, L. F. Sun, P. P. Chen and C. Gao, Mater. Sci. Eng., C, 2016, 59, 445–453 CrossRef CAS PubMed
.
- X. M. Li, L. Sun, A. Q. Ge and Y. S. Guo, Chem. Commun., 2011, 47, 947 RSC
.
- L. F. Sun, Y. Y. Ding, Y. L. Jiang and Q. Y. Liu, Sens. Actuators, B, 2017, 239, 848 CrossRef CAS
.
- H. Issa Hamoud, G. Finqueneisel and B. Azambre, J. Environ. Manage., 2017, 195, 195 CrossRef PubMed
.
- H. I. Hamoud, B. Azambre and G. Finqueneisel, J. Chem. Technol. Biotechnol., 2016, 91, 2462 CrossRef
.
- E. Aneggi, V. Cabbai, A. Trovarelli and D. Goi, Int. J. Photoenergy, 2012, 2012, 694721 CrossRef
.
- C. M. Lousada, M. Yang, K. Nilsson and M. Jonsson, J. Mol. Catal. A: Chem., 2013, 379, 178 CrossRef CAS
.
- T. S. Wu, Y. Y. Zhou, R. F. Sabirianov, W. N. Mei, Y. L. Soo and C. L. Cheung, Chem. Commun., 2016, 52, 5003 RSC
.
- S. M. Hirst, A. S. Karakoti, R. D. Tyler, N. Sriranganathan, S. Seal and C. M. Reilly, Small, 2009, 5, 2848 CrossRef CAS PubMed
.
- W. D. Cai, F. Chen, X. X. Shen, L. J. Chen and J. L. Zhang, Appl. Catal., B, 2010, 101, 160 CrossRef CAS
.
- S. Y. Hao, J. Hou, P. Aprea and F. Pepe, Appl. Catal., B, 2014, 160, 566 CrossRef
.
- F. H. Scholes, A. E. Hughes, S. G. Hardin, P. Lynch and P. R. Miller, Chem. Mater., 2007, 19, 2321 CrossRef CAS
.
- E. Grulke, K. Reed, M. Beck, X. Huang, A. Cormack and S. Seal, Environ. Sci.: Nano, 2014, 1, 429 RSC
.
- P. F. Ji, L. Z. Wang, F. Chen and J. L. Zhang, ChemCatChem, 2010, 2, 1552 CrossRef CAS
.
- F. Chen, X. X. Shen, Y. C. Wang and J. L. Zhang, Appl. Catal., B, 2012, 121, 223 CrossRef
.
- Z. M. Tian, J. Li, Z. Y. Zhang, W. Gao, X. M. Zhou and Y. Q. Qu, Biomaterials, 2015, 59, 116 CrossRef CAS PubMed
.
- L. Artiglia, S. Agnoli, M. C. Paganini, M. Cattelan and G. Granozzi, ACS Appl. Mater. Interfaces, 2014, 6, 20130 CAS
.
- K. B. Zhou, X. Wang, X. M. Sun, Q. Peng and Y. D. Li, J. Catal., 2005, 229, 206 CrossRef CAS
.
- T. Naganuma, Nano Res., 2017, 10, 199 CrossRef CAS
.
- L. Wang, G. Lu, D. Yang, J. Wang, Z. B. Zhu, Z. X. Wang and K. B. Zhou, ChemCatChem, 2013, 5, 1308 CrossRef CAS
.
- H. Y. Tan, J. Wang, S. Z. Yu and K. B. Zhou, Environ. Sci. Technol., 2015, 49, 8675 CrossRef CAS PubMed
.
- T. S. Sreeremya, A. Krishnan, K. C. Remani, K. R. Patil, D. F. Brougham and S. Ghosh, ACS Appl. Mater. Interfaces, 2015, 7, 8545 CAS
.
- C. Zang, X. Zhang, S. Hu and F. Chen, Appl. Catal., B, 2017, 216, 106 CrossRef CAS
.
- Z. Yang, K. Zhou, X. Liu, Q. Tian, D. Lu and S. Yang, Nanotechnology, 2007, 18, 185606 CrossRef
.
- X. W. Liu, K. B. Zhou, L. Wang, B. Y. Wang and Y. D. Li, J. Am. Chem. Soc., 2009, 131, 3140 CrossRef CAS PubMed
.
- D. Yang, L. Wang, Y. Z. Sun and K. B. Zhou, J. Phys. Chem. C, 2010, 114, 8926 CAS
.
- Y. Xue, Q. F. Luan, D. Yang, X. Yao and K. B. Zhou, J. Phys. Chem. C, 2011, 115, 4433 CAS
.
- J. E. Spanier, R. D. Robinson, F. Zheng, S. W. Chan and I. P. Herman, Phys. Rev. B: Condens. Matter Mater. Phys., 2001, 64, 245407 CrossRef
.
- W. H. Weber, K. C. Hass and J. R. McBride, Phys. Rev. B: Condens. Matter Mater. Phys., 1993, 48, 178 CrossRef CAS
.
- A. Hiroki and J. A. LaVerne, J. Phys. Chem. B, 2005, 109, 3364 CrossRef CAS PubMed
.
- Y. J. Wang, H. Dong, G. M. Lyu, H. Y. Zhang, J. Ke, L. Q. Kang, J. L. Teng, L. D. Sun, R. Si, J. Zhang, Y. J. Liu, Y. W. Zhang, Y. H. Huang and C. H. Yan, Nanoscale, 2015, 7, 13981 RSC
.
- E. G. Heckert, S. Seal and W. T. Self, Environ. Sci. Technol., 2008, 42, 5014 CrossRef CAS PubMed
.
- L. J. Xu and J. L. Wang, Environ. Sci. Technol., 2012, 46, 10145 CrossRef CAS PubMed
.
- P. Zhang, D. Sun, M. Wen, J. Yang, K. Zhou and Z. Wang, Adv. Synth. Catal., 2012, 354, 720 CrossRef CAS
.
- R. N. McCormack, P. Mendez, S. Barkam, C. J. Neal, S. Das and S. Seal, J. Phys. Chem. C, 2014, 118, 18992 CAS
.
- A. D. Bokare and W. Choi, J. Hazard. Mater., 2014, 275, 121 CrossRef CAS PubMed
.
- Y. C. Wang, X. X. Shen and F. Chen, J. Mol. Catal. A: Chem., 2014, 381, 38 CrossRef CAS
.
- H. Zhao, Y. M. Dong, P. P. Jiang, G. L. Wang and J. J. Zhang, ACS Appl. Mater. Interfaces, 2015, 7, 6451 CAS
.
- S. H. Bossmann, E. Oliveros, S. Gob, S. Siegwart, E. P. Dahlen, L. Payawan, M. Straub, M. Worner and A. M. Braun, J. Phys. Chem. A, 1998, 102, 5542 CrossRef CAS
.
Footnote |
| † Electronic supplementary information (ESI) available. See DOI: 10.1039/c8ra00622a |
| This journal is © The Royal Society of Chemistry 2018 |

