 Open Access Article
Shock response of condensed-phase RDX: molecular dynamics simulations in conjunction with the MSST method
Ni-Na Ge *a,
Sha Baib,
Jing Changc and
Guang-Fu Jib
aState Key Laboratory Cultivation Base for Nonmetal Composites and Functional Materials, Southwest University of Science and Technology, Mianyang 621010, Sichuan, P. R. China. E-mail: genina911@163.com
bLaboratory for Shock Wave and Detonation Physics Research, Institute of Fluid Physics, Chinese Academy of Engineering Physics, Mianyang, 621900, P. R. China
cInstitute of Solid State Physics, Sichuan Normal University, Chengdu 610101, P. R. China
First published on 11th May 2018
Abstract
We have performed molecular dynamics simulations in conjunction with the multiscale shock technique (MSST) to study the initial chemical processes of condensed-phase RDX under various shock velocities (8 km s−1, 10 km s−1 and 11 km s−1). A self-consistent charge density functional tight-binding (SCC-DFTB) method was used. We find that the N–NO2 bond dissociation is the primary pathway for RDX with the NO2 groups facing (group 1) the shock, whereas the C–N bond scission is the dominant primary channel for RDX with the NO2 groups facing away from (group 2) the shock. In addition, our results present that the NO2 groups facing away from the shock are rather inert to shock loading. Moreover, the reaction pathways of a single RDX molecule under the 11 km s−1 shock velocity have been mapped out in detail, NO2, NO, N2O, CO and N2 were the main products.
1. Introduction
Energetic materials like RDX have rather a long history of interest because they have been widely used in both military and industry applications. One of the major objectives in the area of energetic materials is to reduce sensitivity to detonation initiated by unintentional external stimuli, for example, impact, shock, friction etc. In previous theoretical and experimental studies, the sensitivity of RDX is correlated with the strength of trigger bonds. It has been shown that the possible initial reaction mechanisms during the RDX decomposition process are: (1) concerted triple ring fission to produce three methylenenitramine (CH2NNO2) fragments, (2) homolytic N–N bond scission, and (3) elimination of HONO.1–6 Although there is no conclusive agreement by anyone as to the definitive pathway, the majority of studies3–6 indicate that the most probable initial decomposition step for RDX is N–N bond homolysis, and NO2 has been identified as a reaction product, since the weakest bond in RDX is the N–N bond.The abovementioned experimental and theoretical work on reaction mechanisms of RDX is largely restricted to relatively low temperature and pressure regimes. In fact, we observed the temperature and pressure dependent reactions in RDX crystals. Wang et al.7 reported that condensed-phase RDX is thermally decomposed through the elimination of HNO2 under high pressure. It is accompanied by three five-membered ring formations and hydrogen transfer from the CH2 group to the –NO2 group; that is to say, C–H bond rupture is involved in the rate-determining step under high pressure. In addition, ultrafast photodecomposition experiments also suggested a very different mechanism for RDX thermal decomposition, where NO was observed as an early reaction product rather than NO2,8,9 which is consistent with the result that the initial decomposition of the shocked HMX is triggered by the N–O bond breaking.10
High shock and collision can also cause the decomposition of condensed-phase RDX in practical applications, with both high temperature and high pressure. The decomposition of energetic materials (EMs) under shock loading can be a criterion to characterize the shock sensitivity. Thus, in order to improve the mechanism for RDX decomposition, understand the initial chemical events induced by shock loading is essential. Based on the time-resolved spectroscopy measurements, the shock decomposition mechanism of RDX reported by Miao et al.11 is consistent with the experiment done by Patterson et al.,12 but the shock under different velocities was not considered. Strachan and Selles2,13 studied shock propagation at various velocities based on non-equilibrium molecular dynamics (MD) using the ReaxFF and DPD-RX, respectively. Meantime, the chemical responses of shocked 1,3,5-trinitro-1,3,5-triazinane (RDX) crystals were performed by Xue et al.,14,15 using the ReaxFF force field combined with the multiscale shock technique. Nevertheless, this method needs larger systems for longer simulations.16,17 Recently, Yuan et al.18 have studied the initial chemical processes of RDX under shock loading via MD simulations in conjunction with the multi-scale shock technique (MSST), nevertheless, shockwave initial decomposition of energetic materials is a complicated physical and chemical process and the fundamental chemical reactions that take place during decomposition is not easily identified.
In our earlier study, the MD simulations in conjunction with the multi-scale shock technique (MSST) has been successfully tested on HMX and has been shown to accurately predict chemical processes.19–21 On the basis of previous work, we are also interested in the initial decomposition of RDX under shock loading. We hope that we could further understand the initial chemical reaction under shock loadings and improve the mechanism of RDX decomposition through our work. This paper is organized as follows: the theoretical methods and computational details are given in Sec. II. The results and discussions are presented in Sec. III. The summary of the main results is given in Sec. IV.
2. Methods and computational details
In this work, we have performed quantum molecular dynamics simulations in conjunction with the multi-scale shock technique (MSST) in the CP2K software package.22 The multi-scale shock technique (MSST) is based on the Navier–Stokes equations for compressible flow.23 Instead of simulating a shock wave within a large computational cell with many atoms (the direct approach), the computational cell of the multi-scale technique follows a Lagrangian point through the shock wave, which could be simulated with fewer atoms and lower computational cost.16 The multi-scale shock technique simulates steady shock waves (that is, constant shock speed) by the time-evolving equations of motion for atoms and volume of the computational cell to constrain the shock-propagation-vector stress to the Rayleigh line and energy to the Hugoniot relation. For a specified shock speed, the Hugoniot relation E − E0 = 1/2(P + P0) (V0 − V) could be obtained by the conservation of mass, momentum, and energy across the shock front.24,25 Where E is the energy, P is the negative of the diagonal component of the stress tensor in the vector of the shock, and V is the volume. A subscript 0 refers to the pre-shocked state, while quantities without subscripts refer to the post-shocked state. The thermodynamic path connecting the initial state of the system to its final (Hugoniot) state could be described by the Rayleigh line P − P0 = U2ρ0(1 − ρ0/ρ) (where U is the shock velocity and ρ is the density).26 These two relations describe a steady planar shock wave within continuum theory, which have to obey for steady shock waves.In this study, the simulation unit cell was taken from the experimentally determined X-ray crystal structure.27 It is well known that RDX is an orthorhombic molecular crystals, each RDX molecule consists of 21 atoms, and the unit cell of the RDX crystal contains 8 RDX molecules [Fig. 1(a)]. a, b, c represent the three orthorhombic crystallographic axes of RDX in a space group Pbca, respectively. To obtain the equilibrium structure of the unit-cell RDX, the conjugate gradient which has been described in detail in our previous papers19–21 was used for the geometry optimization. The wave function was converged to less than 10−6 a.u. We obtain lattice parameters of a = 12.650 Å, b = 12.0300 Å, c = 10.9609 Å when initial temperature and pressure were set as 300 K and 0 GPa, respectively, which is in good agreement with the experimental values (a = 13.182 Å, b = 11.574 Å, c = 10.9609 Å).27
In our simulation, the simulations cell consists of 24 RDX molecules, corresponding to 3 × 1 × 1 unit cell. We take the shock to be propagating in the x direction. Planar shocks are described by 1D Euler equations so only a is allowed to vary, providing a uniaxial strain condition. In our simulation, the uniaxial compression of the shock wave propagates along the lattice vector a for 37.815 Å, (the schematic sketches of the shock compression along the lattice vectors a is shown in Fig. 1(b)). The simulations were performed for shock velocity of 8 km s−1, 10 km s−1 and 11 km s−1, respectively, which is below/above the experimentally determined steady detonation shock speed,28,29 i.e., about 8.7 km s−1. For the shock compression simulations, the fictitious cell mass was set to 1.296 × 10⁸ a.u. The wave function convergence criteria was 10−6 au, For the shock speeds 8 km s−1, the time step was 0.05 fs for up to 10 ps, then for the shock speeds of 10 km s−1 and 11 km s−1, the time step was 0.05 fs for up to 3.7 ps and 6.9 ps, respectively (as shown in Fig. 2). It shows the time-dependence of average temperature, shock-propagation-direction stress and volume rate for shock wave propagates along lattice vectors a at shock velocity 11 km s−1. In order to follow the chemical processes as the shock wave propagates through the RDX, we implemented a procedure to identify individual molecules based on bond-length and lifetime criteria in the simulation. This method is also used in the previous literature.19–21,30 The configurations were drawn from the trajectory file: when two atoms are closer than a given cutoff distance rc for a time of greater than 100 fs, they belong to the same molecule.
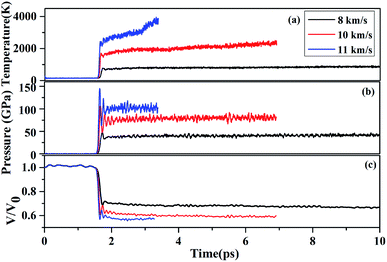 | ||
| Fig. 2 The time-dependence of average temperature (a), shock-propagation-direction stress (b) and volume rate (c) for shock wave propagates along lattice vectors a at shock velocity 11 km s−1. | ||
3. Results and discussion
3.1. RDX decomposition mechanism
We perform simulations of the following shock velocities (km s−1): 8, 10, and 11, which is near the experimentally measured steady detonation shock speed. During the initial shock compression of condensed-phase RDX under various shock wave, it is found that the NO2 groups facing away from the shock are rather inert to shock loading, whereas, the NO2 groups facing the shock have a dramatic bending due to mechanical deformation and results in the breakage of the chemical bond.Fig. 3 shows the snapshots of the RDX decomposition reaction for shock velocity 11 km s−1 at 1.65 ps and 1.94 ps, respectively. It contains 12 RDX molecules, half of them in group 1, and the remaining in group 2. The molecules 1–6 represent group 1, which presents the NO2 groups faces towards from the shock plane. The molecules 7–12 represent group 2, which presents the NO2 groups faces away from the shock plane. During the initial shock compression, it is found that the group 2 molecules are rather inert to shock loading and reactions are more likely initiated within group 1 molecules. At 1.65 ps, two group 1 molecules decomposed through the N–NO2 bond dissociation and one group 1 molecule decomposed by C–N scission. The initial decomposition products include NO2. However, group 2 molecules only represent a distortion, there is no bond broking. Until at 1.94 ps, the group 2 molecules began to decompose, the initial decomposition of shocked RDX is mainly triggered by C–N scission, while the group 1 molecules have been decomposed many small fragments.
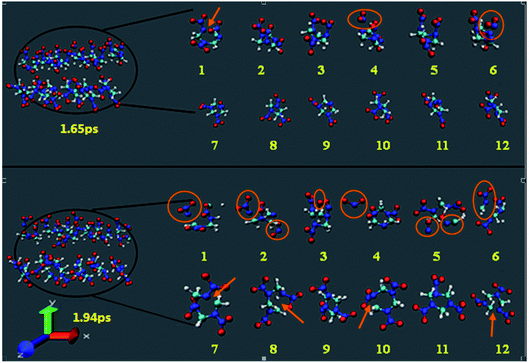 | ||
| Fig. 3 The snapshots of the RDX decomposition reaction for shock velocity 11 km s−1 at 1.65 ps and 1.94 ps, respectively. | ||
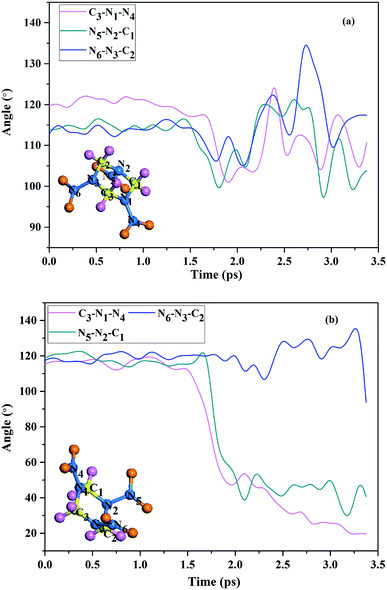
Compared with group 2 molecules, the group 1 molecules are easier to be decomposed. In fact, the N–NO2 bond dissociation in group 1 is attributed to mechanical deformation.31,32 Fig. 4 shows the C3–N1–N4, N5–N2–C1, and N6–N3–C2 bond angles as function of the time under shock loading. Fig. 4(a) shows the time variations of the bond angles in group 2 at shock velocities 11 km s−1. It presents that the magnitude of bond angles of group 2 varies in a regular manner around equilibrium point for up to 3.4 ps. However, there is an evident change in magnitude of the bond angles (C3–N1–N4 and N5–N2–C1) in group 1 molecules under shock loading, as is shown in Fig. 4(b). The C3–N1–N4 and N5–N2–C1 easily bent during the dynamical simulation, so that they have a significant decrease in magnitude between the 1.5 ps and 3.4 ps. The simulation reveals the coexistence of two qualitatively different molecular responses to shock loading, which indicates group 2 molecules are rather inert to shock loading, in well with the result Nomura33 calculated with ReaxFF MD. This also reveals that the initial decomposition product of shocked RDX crystal is NO2.
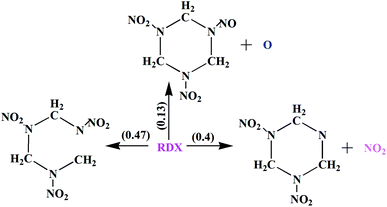
In our present work, we find three distinct initial decomposition channels for RDX in condensed phase under the nohydrostic compression, which is: (1) N–NO2 bond dissociation, (2) C–N bond scission of the ring, and (3) N–O bond dissociation. The branching ratios of three primary reaction pathways in this work as shown in Fig. 5. It was shown that both N–NO2 bond dissociation and C–N bond scission of the ring are the dominant primary channels in the initial decomposition.
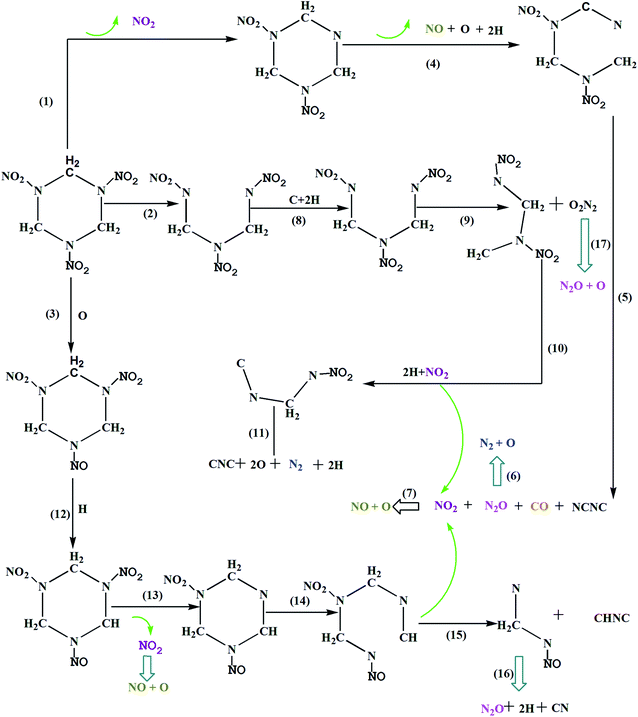
In order to try to answer is how shock waves trigger chemical reactions, Fig. 6 shows the primary chemical reaction pathways. Actually, the chemical process in condensed phase under the shock loading is very complicated, different RDX molecules experienced various reaction paths under shock loading. In order to make specific analysis of the three distinct decomposition stages, we investigate the molecule where chemical reaction first occurs for three distinct decomposition stages, respectively. They represent three chemical reaction path for shock wave induced decomposition of condense phase RDX.
Reaction 1 leads to the production of NO2, which is one of the dominant primary channels in the initial decomposition under shock loading. In previous experiments, the NO2 has been identified as a reaction product.6,8,34–36 In our simulation, it was shown that the initial decomposition of group 1 molecules is mainly triggered by the N–NO2 bond dissociation. At 1.51 ps, the first vibrations of the nitro group caused a distortion in the RDX: N–N bond broke and formed NO2. After that, the NO2 would not be very stable and should undergo further dissociation to smaller more stable species O and NO (R4). At the same time, many C–H bonds were broken, produced many H. As the simulation continued, at 1.85 ps, RDX ring was opened through the C–N bond scission, forming a long radical chain. At 2.0 ps, the long chain further decomposed through reaction (R5) with increasing temperature and pressure, then, the NO2, N2O and CO combined to generate the short radical chain NCNC, as shown below:
| CH2N(NO2)CH2N(NO2)CN → NO2 + N2O + CO + NCNC + 4H | (R5) |
| N2O → N2 + O | (R6) |
| NO2 → NO + O | (R4&R7) |
The C–N bond scission is proposed to be favorable in group 2 molecules. Reaction 2 represents that the RDX ring was opened through the C–N bond scission and formed a radical chain CH2N(NO2)CH2N(NO2)CH2N(NO2), which is supported by some other experimental studies.6,37 It is worth mentioning, Zhao el al. suggested the RDX decomposed into three CH2NNO2 during the initial decomposition, and the branching ratios of C–N is about 0.67. In this paper, at 1.64 ps, the RDX ring was opened though the C–N bond scission, forming a long radical chain. At 1.75 ps, C–H bonds and C–N bond were broken, produced two H and a free C. After that, another C–N bond ruptures leading to the elimination of N2O2. The N2O2 is a short-lived intermediate, which undergo further decomposition instantaneously by breaking the N–O bond to form N2O, and perhaps that is why the N2O2 not be observed in experiment. On the other hand, the long chain CH2N(NO2)CH2N(NO2) further decomposed through reaction (R10) and reaction (R11), respectively, as shown below:
| CH2N(NO2)CH2N(NO2) → CNCH2N(NO2) + NO2 | (R10) |
| CNCH2N(NO2) → CNC + 2O + N2 + 2H | (R11) |
| N2O2 → N2O + O | (R17) |
Reaction 3 shows that the initial decomposition of shock RDX is triggered by the N–O bond breaking at 1.74 ps. Then, the C–H bond is unstable and break to form a H. As the simulation continued, the NO and N2O can be found in a subsequent reaction. It is evident that pressure accelerates the breaking of N–O and C–H bonds. The conclusion applies to RDX as well as HMX, Zhu10 suggested that the initial decomposition of shocked HMX was triggered by the N–O bond breaking under the impact speed 6.5 km s−1. In summary, it is found that the NO2 is observed as one of the major products in almost all these reaction pathways, thus R13 plays a key role in forming NO2. Once NO2 forms, it can then decompose by breaking the N–O bond to form NO (at 1.8 ps). At 1.82 ps, the RDX ring was opened by C–N bond scission and formed long chain CHNCH2N(NO2)CH2NNO. Finally, the long chain further decomposed and lead to many small molecules, as shown in reaction 15 and 16
| CHNCH2N(NO2)CH2NNO → NCH2NNO + CHNC + NO2 | (R15) |
| NCH2NNO → N2O + 2H + CN | (R16) |
As already mentioned above, we present the major decomposition pathway under shock loading. Experimentally observed small mass fragments such as NO2, N2O, NO and N2 can be explained based on our scheme. Other small mass fragments detected experimentally such as H2O, CO and CO2 are also be found as an important major species under high temperature and pressure. The related chemical pathways are:
| H + H → H2 | (R18) |
| OH + H → H2O | (R19) |
| C + O → CO | (R20) |
| C + 2O → CO2 | (R21) |
Under extreme condition, there are many number of free H. Some free H combined to form H2 via R18, but most as free H ions play an important role during the initial decompression progress which will enhance chemical reaction of energetic material RDX. There are many free OH, which has been extensively considered as the major decomposition products in both the thermal decomposition and the shock decomposition of all energetic material. This is also considered as the basis for formation of water molecules, as shown in R19. In addition, such as CO and CO2, which are common reaction products in the previously theoretical simulation and experimental studies, results from related chemical pathways R20 and R21.
3.2. Species analysis under impact loading conditions
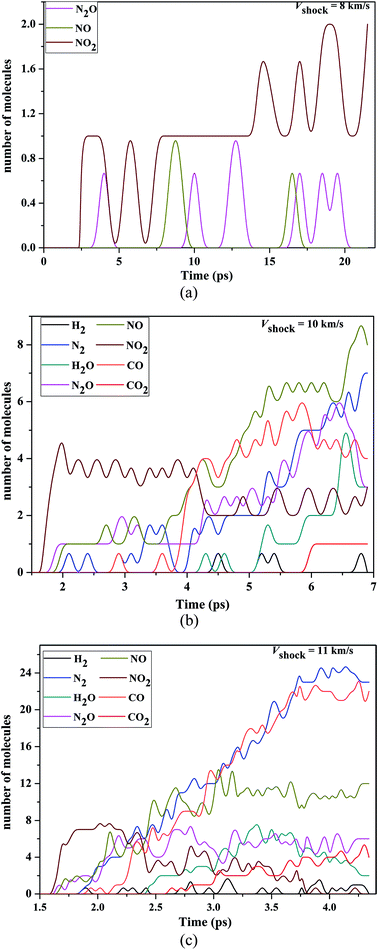
In Fig. 7, we shown the time evolution of the population of various key fragments (H2, N2, H2O, N2O, NO, NO2, CO and CO2) from VS = 8 to 11 km s−1. For VS = 8 km s−1, there were little chemical reactions, only ∼2 NO2, ∼1 N2O and ∼1 NO were formed during the course of simulation, as shown in Fig. 7(a). Dobratz and Crawford29 have reported the limiting detonation velocity is 8.639 km s−1 for RDX, above our shock velocity, and perhaps that is why there were little chemical reactions. The NO2 has been identified as the first reaction product and the number of NO2 is much larger than that of N2O and NO, which suggested that the N–N bond homolysis is the first decomposition step. This is consistent with the previous theoretical and experimental results.2,34,35,38,39Compared with VS = 8 km s−1, the decomposition process had a significantly enhancement in VS = 10 km s−1. Fig. 7(b) shows the time evolution of the population of key molecules at the VS = 10 km s−1, which RDX further decomposed. During the early stage (up to ∼4 ps), the NO2 is also be identified as the first reaction product, moreover, the dominant molecules include NO2, N2O, and NO. After the time ∼4 ps, the number of the NO2 decreased with the increasing time, but in contrast N2O and NO increased significantly with the increasing time. Compared with the products at the Vs = 8 km s−1, It is worth noting that there are some new reaction products at 10 km s−1, such as N2, CO, H2O and CO2 which are common reaction products in the previously theoretical simulation2,40–42 and experimental studies.8,43,44 The dominant reaction products of the N2 and CO have a dramatic increasing with time (from the time ∼4 ps). H2O, H2 and CO2 are formed after the appearance of NO2, NO, N2O, N2 and CO. For H2O, it increases with the time (after time 5 ps), and reached a maximum value at 6.5 ps. Compared with other small fragments, the amounts of H2 and CO2 were smaller and the CO2 reached a final balance.
At VS = 11 km s−1 shock velocity, there were a larger quantity of CO (∼23), N2 (∼24), NO (∼12), N2O (∼6) and CO2 (∼4) in the expansion stage (Fig. 6(c)). As the impact velocity increases, we found the significant reaction intermediate at very early stage was still NO2, which was said to result from N–NO2 bond breakage in the initial stages of shock detonation. So, we think that the initial step of decomposition was the homolysis of N–NO2 bond both under weak and strong shock compression. Most notably, the dominant reaction product is NO2 at very early stage, whose population reached a maximum value at 2.0 ps and then decreased with increasing time thereafter. The amounts of the NO, CO and N2 were larger than other products during the expansion stage in shock velocity 10 km s−1, however, with the increasing shock velocity, the amounts of the H2, N2 and CO were larger than other products during the expansion stage. These present that the populations of H2, N2 and CO (NO) increase (decreases) significantly with the increasing shock velocity. In addition, compared with the shock velocity 10 km s−1, the population of the N2O, H2O and CO had a significantly increasing in shock velocity 11 km s−1 and reached a final balance.
During the detonation, the shockwave passed through the material and generated high pressures and temperatures. By summarizing our current and other previous work, we found that the decomposition pathway of nitramines and nitrosamines are closed related to the pressure and temperature of system upon shock loading. From Fig. 7, it can be seen that the most reactive gases were still the NO2 at early stage in shock velocity 10 km s−1 and 11 km s−1. Then, with increasing time, it can be seen that the global nitrogen schemes of NO2 → NO(N2O) → N2 was the final steady production pathway at higher pressure and high temperature, i.e., the NO, N2O decreasing extent with the N2 reached to a greater with increasing shock velocity.
3.3. Pair correlation functions (PCFs) of the RDX with the different impact velocity
To clarify the structural change of the HMX under shock conditions, we calculated the pair correlation functions (PCFs) for each pair of atom types, which give probability of finding an atom of a given type at a given distance from a reference atom. The PCFs of the CO, CO2, N2, N2O, H2O and NO for Vimp = 10 km s−1 and Vimp = 11 km s−1 are presented in Fig. 8, respectively. It is commonly considered that the C–O bond in CO (CO2) molecule, H–O bond in H2O molecule, N–N bond in N2 (or N2O) molecule, as well as N–O bond in NO (or N2O) are approximate to 1.13 Å (or 1.16 Å), 1.0 Å, 1.42 Å (or 1.186 Å) and 1.15 Å, respectively. From Fig. 8(a), it can be seen that compared with gC–O(r) for 10 km s−1 the height of peaks increase at 1.14 and 3.45 Å and decrease at 2.75 Å. The peak of C–O PCFs gC–O(r) locates around 1.14 Å, which suggests that the C–O distribution is the mixture of the CO and CO2. The maximum of the PCFs gC–O(r) for 11 km s−1 is larger than that for 10 km s−1, which indicates the number of CO (CO2) increase with increasing temperature. This is consistent well with preceding study about species analysis for VS = 10 km s−1 and VS = 11 km s−1. From Fig. 8(b), the maximum of the PCFs gN–N(r) for 10 km s−1 is larger than that for 11 km s−1, since part of the N–NO2 bond have not been dissociated. With the increase of the shock velocity, the main peak of PCF gN–N(r) becomes reduced in amplitude due to the N–NO2 bond further dissociated. Fig. 8(c) presents the radial distribution function for O–H atoms pairs, It can be seen that gH–O(r) around 1.0 Å appears a maximum peak, which indicates H2O molecules are form and also presents that the number of the water will increase when the shock velocity passed through the material with 11 km s−1. At the same time, N–O bond length locates around 1.2 Å at 10 km s−1 and 11 km s−1, respectively, which is close to the value of nitrogen oxide, nitrous oxide, as shown in Fig. 8(d). The above analysis again suggest that decomposition of RDX generates small molecules CO, CO2, H2O, NO2, NO and N2O under the 10 km s−1 and 11 km s−1 velocity impact. | ||
| Fig. 8 Calculated pair radial distribution functions under shock velocities 10 km s−1 and 11 km s−1: (a) C–O; (b) N–N; (c) H–O; (d) N–O. | ||
4. Conclusions
We have performed molecular dynamics simulations in conjunction with the multiscale shock technique (MSST) to study the initial chemical processes of condensed-phase RDX under shock wave loading. A self-consistent charge density functional tight-binding (SCC-DFTB) method was used. We find that the N–NO2 bond dissociation is the primary pathway for RDX with the NO2 groups facing (group 1) the shock, whereas the C–N bond scission is the dominant primary channel for RDX with the NO2 groups facing away from (group 2) the shock. Moreover, our results present the NO2 groups facing away from the shock are rather inert to shock loading. It was indicated that the initial step was the N–N bonds dissipation under the 8 km s−1, 10 km s−1 and 11 km s−1 shock velocities. The gaseous products such as NO2, NO and N2O can be identified under 8 km s−1, but with a little amounts. As the shock velocity increases, the decomposition process had a significantly enhancement, NO2, NO, N2O, H2O, CO, CO2 and N2 were the main products under the 10 km s−1 and 11 km s−1. The populations of N2, N2O, H2O and CO had a significantly increasing with the increasing shock velocity, while that of NO decreases significantly with the increasing shock velocity.Conflicts of interest
There are no conflicts to declare.Acknowledgements
The authors would acknowledge the National Natural Science Foundation of China (Grant No. 11504304 and 11304211), the Open Project of State Key Laboratory Cultivation Base for Nonmetal Composites and Functional Materials (15zxfk08) and Funded by Longshan academic talent research supporting program of SWUST No. 17LZX674, Supported by Sichuan Science and Technology Program 2018GZ0333 and 2017TD0020. Science Challenging Program JCKY2016212A501.References
- J. P. Lewis, K. R. Glaesemann, K. V. Opdorp and G. A. Voth, J. Phys. Chem. A, 2000, 104, 11384–11389 CrossRef CAS.
- A. Strachan, A. C. T. van Duin, D. Chakraborty, S. D. Dasgupta and W. A. Goddard III, Phys. Rev. Lett., 2003, 91, 098301 CrossRef PubMed.
- T. R. Botcher and C. A. Wight, J. Phys. Chem., 1994, 98, 5441–5444 CrossRef CAS.
- T. R. Botcher and C. A. Wight, J. Phys. Chem., 1993, 97, 9149–9153 CrossRef CAS.
- C. A. Wight and T. R. Botcher, J. Am. Chem. Soc., 1992, 114, 8303–8304 CrossRef CAS.
- X. S. Zhao, E. J. Hintsa and Y. T. Lee, J. Chem. Phys., 1988, 88, 801–810 CrossRef CAS.
- J. Wang, K. R. Brower and D. L. Naud, J. Org. Chem., 1997, 62, 9055–9060 CrossRef CAS.
- M. Greenfield, Y. Q. Guo and E. R. Bernstein, Chem. Phys. Lett., 2006, 430, 277 CrossRef CAS.
- Y. Q. Guo, M. Greenfield and E. R. Bernsteina, J. Chem. Phys., 2005, 122, 244310 CrossRef CAS PubMed.
- W. H. Zhu and H. Huang, J. Chem. Phys., 2012, 136, 044516 CrossRef PubMed.
- M. S. Miao, Z. A. Dreger, J. E. Patterson and Y. M. Gupta, J. Phys. Chem. A, 2008, 112, 7383 CrossRef CAS PubMed.
- J. E. Patterson, Z. A. Dreger, M. S. Miao and Y. M. Gupta, J. Phys. Chem. A, 2008, 112, 7374 CrossRef CAS PubMed.
- M. S. Sellers, M. Lísal, I. Schweigert, J. P. Larentzos and J. K. Brennan, in AIP Conference Proceedings, 2017, vol. 1793, p. 040008 Search PubMed.
- X. G. Xue, Y. S. Wen, X. P. Long, J. S. Li and C. Y. Zhang, J. Phys. Chem. C, 2015, 119, 13735–13742 CAS.
- Y. Li, R. K. Kalia, A. Nakano and P. Vashishta. in AIP Conference Proceedings, 2017, vol. 1793, p. 030007 Search PubMed.
- K. Kadau, T. C. Germann, P. S. Lomdahl and B. L. Holian, Science, 2002, 296, 1681 CrossRef CAS PubMed.
- J. D. Kress, S. R. Bickham, L. A. Collins, B. L. Holian and S. Goedecker, Phys. Rev. Lett., 1999, 83, 3896 CrossRef CAS.
- J. N. Yuan, Y. K. Wei, X. Q. Zhang, X. R. Chen, G. F. Ji, M. K. Kotni and D. Q. Wei, J. Appl. Phys., 2017, 122, 135901 CrossRef.
- N. N. Ge, Y. K. Wei, G. F. Ji, X. R.Cheng, F. Zhao and D. Q. Wei, J. Phys. Chem. B, 2012, 116, 13696–13704 CrossRef CAS PubMed.
- N. N. Ge, Y. K. Wei, Z. F. Song, X. R.Cheng, G. F. Ji, F. Zhao and D. Q. Wei, J. Phys. Chem. B, 2014, 118, 8691–8699 CrossRef CAS PubMed.
- N. N. Ge, Y. K. Wei, F. Zhao, X. R.Cheng and G. F. Ji, J. Mol. Model., 2014, 20, 2350 CrossRef PubMed.
- The CP2K developers group, http://cp2k.berlios.de/, 2007.
- E. J. Reed, L. E. Fried and J. D. Joannopoulos, Phys. Rev. Lett., 2003, 90, 235503 CrossRef PubMed.
- N. Goldman, E. J. Reed, I. F. W. Kuo, L. E. Fried, C. J. Mundy and A. Curioni, J. Chem. Phys., 2009, 130, 124517 CrossRef PubMed.
- C. J. Mundy, A. Curioni, N. Goldman and I. F. W. Kuo, J. Chem. Phys., 2008, 128, 184701 CrossRef PubMed.
- E. J. Reed, M. R. Manaa, L. E. Fried and K. R. A. Glaesemann, Nat. Phys., 2008, 4, 72–76 CrossRef CAS.
- C. S. Choi and E. Prince, Acta Crystallogr. Sect.B, 1972, 28, 2857 CrossRef CAS.
- C. L. Mader, Numerical Modeling of Water Waves, CRC Press, Boca Raton, 1998, p. 55 Search PubMed.
- B. M. Dobratz and P. C. Crawford, LLNL Explosives Handbook, Lawrence Livermore National Laboratory, University of California, 1985 Search PubMed.
- M. R. Manaa, E. J. Reed, L. E. Fried and N. Goldman, J. Am. Chem. Soc., 2009, 131, 5483–5487 CrossRef CAS PubMed.
- Q. Cui, M. Elstner, E. Kaxiras, T. Frauenheim and M. Karplus, J. Phys. Chem. B, 2001, 105, 569–585 CrossRef CAS.
- M. R. Manaa, L. E. Fried, C. F. Melius, M. Elstner and T. Frauenheim, J. Phys. Chem. A, 2002, 106, 9024–9029 CrossRef CAS.
- K. I. Nomura, R. K. Kalia, A. Nakano and P. Vashishta, Phys. Rev. Lett., 2007, 99, 148303 CrossRef PubMed.
- T. R. Botcher and C. A. Wight, J. Phys. Chem., 1994, 98, 5441 CrossRef CAS.
- F. J. Owens and J. Sharmar, J. Appl. Phys., 1980, 51, 1494–1979 CrossRef CAS.
- M. D. Pace and W. B. Moniz, J. Magn. Reson., 1969, 47, 510 Search PubMed.
- T. B. Brill, H. Arisawa, P. J. Brush, P. E. Gongwer and G. K. Williams, J. Phys. Chem., 1995, 999, 1384 CrossRef.
- G. F. Adams and R. W. Shaw, Annu. Rev. Phys. Chem., 1992, 43, 311 CrossRef CAS.
- N. J. Harris and K. Lammertsma, J. Am. Chem. Soc., 1997, 119, 6583 CrossRef CAS.
- Z. H. Yan, W. Liu, C. C. Zhang, X. M. Wang, J. S. Li and Z. W. Yang, J. Hazard. Mater., 2016, 313, 103–111 CrossRef CAS PubMed.
- D. Z. Guo, S. V. Zybin, Q. An, W. A. Goddard III and F. L. Huang, Phys. Chem. Chem. Phys., 2016, 18, 2015–2022 RSC.
- H. Muthurajan, R. Sivabalan, M. B. Talawar and S. N. Asthana, J. Hazard. Mater., 2004, 112, 17–33 CrossRef CAS PubMed.
- S. H. Kim, B. W. Nyande, H. S. Kim, J. S. Park and W. J. Lee, J. Hazard. Mater., 2016, 308, 120–130 CrossRef CAS PubMed.
- Y. Oyumi and T. B. Brill, Combust. Flame, 1985, 62, 213–224 CrossRef CAS.
| This journal is © The Royal Society of Chemistry 2018 |


