
 Open Access Article
 This Open Access Article is licensed under a Creative Commons Attribution-Non Commercial 3.0 Unported Licence
Linearly descending viscosity for alkaline–surfactant–polymer flooding mobility modification in multilayer heterogeneous reservoirs†
Yunfei Ma ab,
Jirui Hou*ab,
Fenglan Zhaoab and
Zhaojie Songab
ab,
Jirui Hou*ab,
Fenglan Zhaoab and
Zhaojie Songab
aEnhanced Oil Recovery Research Institute, China University of Petroleum, Beijing, China. E-mail: houjirui@126.com
bBeijing Key Laboratory of Greenhouse Gas Sequestration and Oil Exploitation and Application, China
First published on 22nd February 2018
Abstract
Alkaline–surfactant–polymer (ASP) flooding is considered to be one of the most promising tertiary oil recovery techniques. Nevertheless, its low sweep efficiency in a multilayer heterogeneous reservoir limits field applications. In this work, linearly descending viscosity, a novel injection pattern of ASP flooding, was used for mobility control. Three-dimensional multilayer heterogeneous core models were designed and fabricated. ASP flooding experiments were conducted in the laboratory, and the remaining oil distribution was measured during flooding. Fluid samples obtained from production wells were used for the viscosity measurement. Contrast experiments were made using another two injection patterns including constant viscosity fluid injection and linearly ascending viscosity fluid injection. The results indicated that ASP flooding with linearly descending viscosity improved oil recovery by over 25%, which was a better performance than that obtained using the other two injection patterns. As the different injection patterns presented a similar recovery in the high permeability layer, the sweep efficiency of ASP fluid in the middle and low permeability layers contributed to the difference in the ultimate oil recoveries. In addition, the initial viscosity of the ASP slug had the greatest effect on the mobility modification. Linearly descending viscosity had the highest initial viscosity, leading to the highest fluid distribution rate in the middle and low permeability layers. In addition, higher effluent viscosity was obtained and an earlier viscosity peak occurred in ASP flooding with linearly descending viscosity. Therefore, the sweep efficiency in middle and low permeability layers was remarkably enlarged by using linearly descending viscosity. Thus, increasing the viscosity of the displacement agent as early as possible was found to be significantly in a multilayer heterogeneous reservoir. This study provides an insight into ASP flooding in multilayer heterogeneous reservoirs.
1 Introduction
Oil extraction using natural energy contained in the gas in solution, edge/bottom water, gravity, and so on, is referred to primary recovery. Afterwards, secondary recovery technologies are used which involve supplementing the external energy by injecting fluid into the reservoirs. After the secondary stage, utilizing other displacement agents to change the interaction of the oil, water, gas and rock for further development is called tertiary recovery or enhanced oil recovery (EOR). Under the current circumstances, increase in oil consumption is a major issue, and exploration of new oilfields is very limited. Most of the reservoirs are already at or approaching the matured state with a high water cut and low production.1 Meanwhile, approximately two-thirds of the original oil in place (OOIP) in a reservoir is still not recovered. Thus, efficient EOR techniques are urgently required for the further development of oilfields.2EOR technologies mainly include carbon dioxide flooding, hydrocarbon miscible-phase displacement, vapour flooding, in situ combustion, microbial driving, and chemical flooding. Chemical flooding is a type of mature technology which is widely used for enhancing oil recovery in oilfield development. In the last three decades, chemical flooding technology has developed rapidly and many pilot and industrial tests have been implemented. Chemical EOR was used in 11% of the world EOR projects by 2010, and the percentage is still growing.3
Chemical EOR technologies can be subdivided into polymer flooding, surfactant solution flooding, micellar-microemulsion flooding, surfactant–polymer binary combination flooding (SP flooding), alkaline–surfactant–polymer (ASP) flooding, and foam combination flooding.4 ASP flooding, based on polymer flooding, is one of the most promising chemical EOR methods. ASP flooding can both improve displacement efficiency and control mobility, not only by combining the advantages of alkaline, surfactant, and polymer together, but also by their synergistic effect.5,6 ASP flooding was conducted in the early 1980s, and the pilot tests were first implemented in West Kiehl oilfield in 1987.7 Since then, extensive ASP flooding field tests have been carried out, which account for nearly 20% of world chemical EOR projects.3 With technology improvement, ASP flooding is replacing polymer flooding as the leading technology of tertiary recovery in China.8,9 Over 60% of global ASP flooding pilot tests are carried out in China. In addition, the commercial production of ASP flooding has been implemented in the Daqing oilfield since 2014, making China the first and the unique industrial application country in the world. The oil output by ASP flooding in Daqing was 3.5 million ton in 2015, accounting for 9% of the total production in the Daqing oilfield. By 2016, ASP flooding had been commercially performed in 22 blocks with 7231 wells in the Daqing oilfield.10 These tests obtained an average incremental oil recovery of about 20%. For example, the incremental oil recovery was 18.2% OOIP in Xing II-middle ASP flooding industrial tests and more than 23.5% OOIP was recovered in North-I block-east.11
The role of the polymer is to reduce the mobility ratio of the aqueous phase and the oil phase. The role of the surfactant is to reduce the interfacial tension (IFT) between the oil and water which promotes the mobilization of trapped oil. The alkaline agent is intended to react with the acids to generate a cosurfactant for oil solubilization. In addition, both surfactant and alkaline agent can alter the wettability of the rock. The advantages of polymer, surfactant and alkaline agent are combined in the ASP flooding technique. ASP flooding also benefits from the synergistic effects between the components. For example, the cosurfactant generated by the alkaline agent helps overcome the surfactant depletion, and the high viscosity generated by using a polymer can reduce the diffusion of alkaline and surfactant in the aqueous phase. With the previously described mechanisms, ASP flooding gave an impressive performance both in laboratory experiments and pilot tests. After years of effort, the research topic of ASP flooding has moved on from the achievement of ultra-low IFT and extreme recovery to elaborate, efficient and economical chemical agent development12 and scheme optimization.13 Among these, optimization of the injection pattern has gained extensive attention from researchers. In the conventional injection pattern of ASP flooding, the viscosity of the ASP slug remains unchanged. A polymer pre-slug and post-slug might be added in front of and behind the main ASP slug for protection. The conventional injection pattern of ASP flooding meets the basic needs for common homogeneous reservoirs. However, because of multicomponent and complex flow, many factors impact on ASP flooding efficiency, including permeability, heterogeneity, crossflow, surfactant sorption and wettability,14,15 and these impacts bring challenges for using this technique in further practical applications of conventional ASP flooding. The conventional injection pattern has defects including heavy loss of chemical agents, insufficient sweep effect and weak profile conformance, which would be particularly problematic in heterogeneous reservoirs.16 In consideration of the limitations mentioned previously, it is important to optimize the injection pattern of the ASP flooding. On the basis of alternative injection of polymer and alkaline/surfactant solution,17 a new concept – P/ASP flooding was suggested where high viscosity polymer slugs and low viscosity ASP slugs are injected alternatively.18 Small size ASP slugs coorperated with polymer slugs substitute for huge slug of ASP fluid. As a result, the total injection volume of ASP was reduced. Besides, the vertical sweep efficiency is improved using this method. Further study was conducted so that the size and concentration of the protection slug was optimized using physical simulation.19 In addition, a gel slug was utilized as a substitute for the polymer solution slug to enhance the profile control in the P/ASP flooding for use in heavy oil reservoirs.20 An adjusted injection pattern with an linearly ascending viscosity, i.e., the ASP slug was divided into several slugs with their viscosity varying from low to high, in ASP flooding has proven to be effective using laboratory experiments. The ASP pilot tests with the linearly ascending viscosity started in 2008 in the North-II-west block of the Daqing oilfield have also achieved a certain effectiveness.21
Unfortunately, the current optimization methods of the injection pattern have flaws. For example, P/ASP flooding needs a frequent switch of fluid injection, which causes intermittent production stagnation and heavy electricity wastage. ASP flooding with linearly ascending viscosity depends on the protection of the pre-slug which leads to a cost increase, and the effect on oil recovery decreases in vertical heterogeneous reservoirs. Nevertheless, with the development of major oil bearing layers reaching the super high water cut stage in the Daqing oilfield, the effective exploitation of the sub-layers is becoming a matter of extreme urgency. Sub-layers of the Daqing oilfield, i.e., Class II layers, have a thinner layer thickness (1–4 m), lower permeability (0.15–0.70 μm2), heavier heterogeneous reservoirs (permeability ratio 1.4–13) and lower reservoir abundance compared to the major oil bearing layers.22 Thus, the application of the ASP flooding technique on the sub-layers is difficult, and the injection pattern problems also need to be solved.
Allowing for the factors mentioned previously, ASP flooding with linearly descending viscositywas suggested for use in injection optimization. The linearly descending viscosity refers to an ASP injection pattern by which the main ASP slug was divided into several slugs with their viscosity varying from high to low. Meanwhile, the total ASP dosage remains the same as that of the conventional injection pattern, and the polymer pre-slug is removed. The optimization method is aiming at improving sweep efficiency, simplifying slug combination and saving chemical dosage. In this study, multilayer heterogeneous core models with and without crossflow were designed and built that show similar geometry and identical physical properties as the Daqing oilfield sub-layers. A series of core flooding experiments was performed. The effect of ASP flooding with linearly descending viscosity on enhancing the oil recovery was evaluated. In contrast, conventional ASP flooding and ASP flooding with linearly ascending viscosity were examined under the same conditions. During flooding, the effluent was collected for monitoring the viscosity of the displacement agent. On the basis of a quantitative description of the remaining oil saturation and areal sweep efficiency, the dominant factor of ultimate oil recovery in heterogeneous reservoirs was determined in this study. The feasibility of using linearly descending viscosity injection pattern as a substitute for conventional ASP flooding is discussed.
2 Experiments
2.1 Materials
Partially hydrolyzed polyacrylamide (HPAM) purchased from the Daqing Refining & Chemical Company was used as the polymer for ASP flooding, with an average molecular weight of 25 × 106 Da. Heavy alkyl benzene sulfonate (HABS) used as a surfactant with an active matter content of 50% was purchased from the Daqing Refining & Chemical Company. Reagent grade sodium hydroxide (NaOH; 96% purity) was obtained from Macklin Biochemical Ltd and was used as the alkaline agent. Simulated oil was prepared by mixing crude oil from the Daqing oilfield and aviation kerosene. The volume ratio of oil/kerosene was 1.65![[thin space (1/6-em)]](https://www.rsc.org/images/entities/char_2009.gif) :1, and the viscosity was 10.0 mPa s at 45 °C. The simulated oil was used as oil for the coreflooding experiments. Brine was prepared for the experiments with a salinity of 4456 g L−1. The mineral composition of the brine is shown in Table 1.
:1, and the viscosity was 10.0 mPa s at 45 °C. The simulated oil was used as oil for the coreflooding experiments. Brine was prepared for the experiments with a salinity of 4456 g L−1. The mineral composition of the brine is shown in Table 1.
| Inorganic salts | NaCl | KCl | CaCl2 | MgCl2·6H2O | Na2SO4 | NaHCO3 |
|---|---|---|---|---|---|---|
| Content (g L−1) | 2.294 | 0.013 | 0.042 | 0.172 | 0.075 | 1.86 |
2.2 Physical models
The three-dimensional heterogeneous models with a positive rhythm were used for the coreflooding experiments. Intralayer heterogeneity and interlayer heterogeneity models with a five-spot well spacing pattern were designed. The models had a similar geometry and identical physical properties as the Daqing sub-layers (Fig. 1). The model size was 50 cm × 50 cm × 5 cm, and the air permeability of the three vertical layers was 300, 500, 800 md, respectively. The three layers were named K3, K2 and K1, respectively, with permeabilities from low to high. The thicknesses of the three layers were 1.0, 2.0, and 2.0 cm, respectively. The model was sealed with epoxy resin. Measurement probes (81 pairs made of enamelled wire) were uniformly arranged on the core (27 pairs per layer, probe spacing 1 cm, group spacing 6 cm) for the measurement of electrical resistivity, and thus, the oil saturation could be calculated.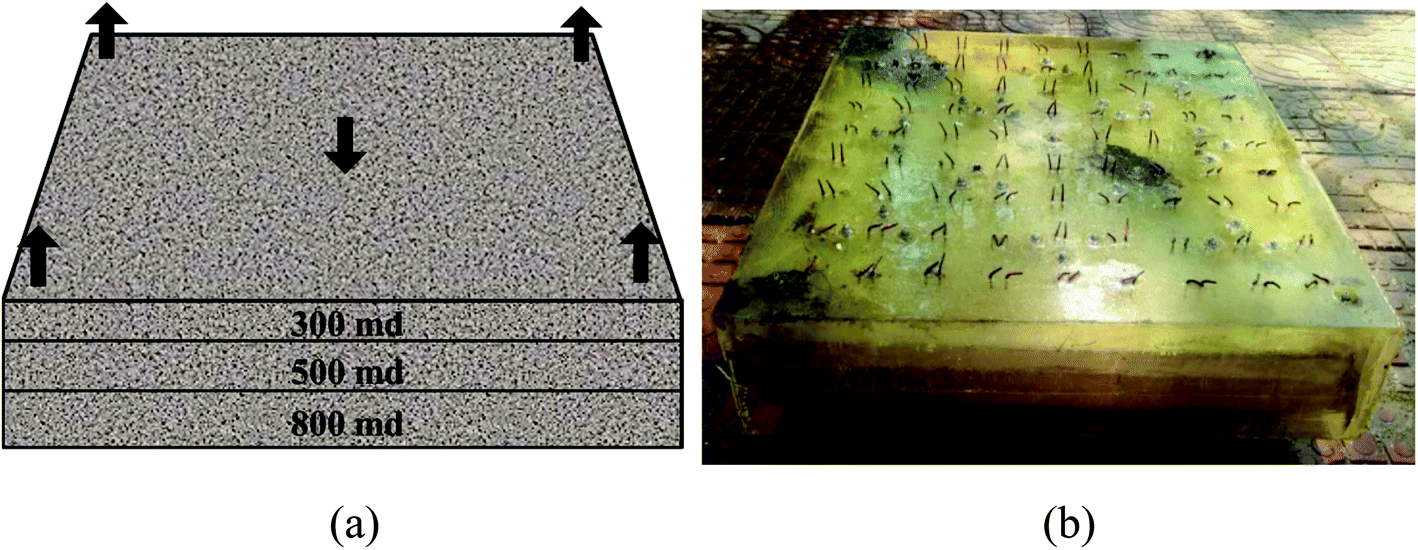 | ||
| Fig. 1 (a) Schematic diagram and (b) photograph of the heterogeneous model. | ||
The intralayer heterogeneity core models were formed integrally to consider the impact of cross flow between the adjacent layers. Five vertical wells, including one injection well and four production wells, were used to model the five-spot well spacing pattern.
The individual layers of interlayer heterogeneity models were separated using solidified epoxy resin (5 mm) to prevent cross flow. The injection well was a vertical well that was drilled through three layers. To measure the production separately, production wells were drilled horizontally in each layer instead of drilling through three layers. A schematic diagram and photograph of the model are shown in Fig. 1.
2.3 Experiment set-up
Fig. 2 shows the flow chart of coreflooding experimental setup. The power driving system consisted of a HAS-100HSB duplex constant flux pump (Huaan Scientific Instrument, Co., Ltd., Jiangsu). Three intermediate containers (Haian Petroleum Scientific Instrument, Co., Ltd., Jiangsu) were used to contain brine, oil and ASP fluid. During coreflooding experiments, a JYB-KRB pressure sensor (ColliHigh Sensing Technology Co., Ltd, Beijing) with a range of 0–10 MPa was installed in the injection well of the model to measure the real-time injection pressure. The data acquisition system was comprised of a data module (ColliHigh Sensing Technology Co., Ltd, Beijing) and an M-80 resistivity collector (Corexpert Laboratory, Co., Ltd., Beijing), that enabled the fluid injection pressure and electrical resistivity of different locations in the models to be displayed and recorded on the computer in real time. A HW-II Thermotank (Haian Petroleum Scientific Instrument, Co., Ltd., Jiangsu) was used to provide an environment with a constant temperature. In addition, a DV-II+Pro viscometer (Brookfield Engineering Labs. Inc., Middleboro, MA, USA) was used for viscosity measurement of the fluid samples.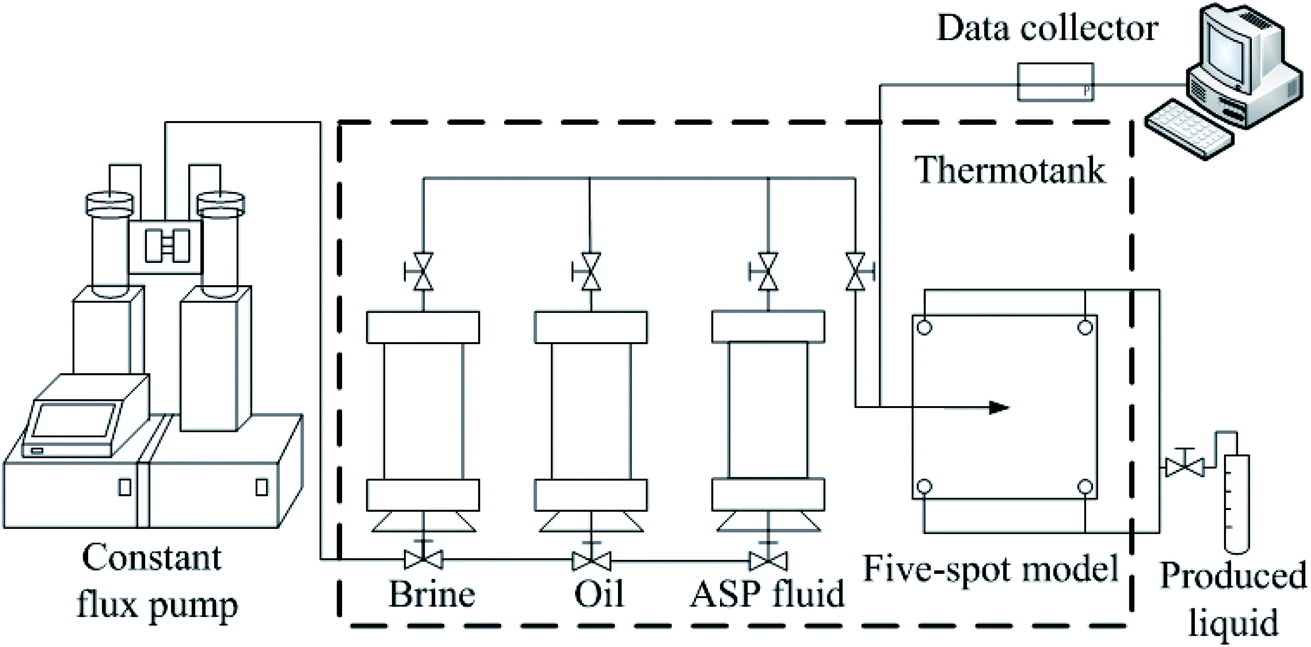 | ||
| Fig. 2 Experimental set-up for the coreflooding experiments. | ||
2.4 Experimental procedures and schemes
The experimental procedure was as follows:(1) The experimental equipment was set up as shown in Fig. 2, and leakproofness was examined.
(2) The core was vacuumed and saturated with the brine, and then the pore volume (PV) and porosity (Φ) were calculated.
(3) The oil was injected until no water was further produced which indicated that the initial water saturation condition had been reached. The amount of saturated oil was recorded, and the initial oil saturation then was calculated.
(4) The simulated oil was aged in the model for 7 d.
(5) Primary water flooding was performed until the water cut reached 98%.
(6) After primary water flooding, a total of 0.3 PV ASP slug and a 0.2 PV polymer post-slug were injected in sequence. For convenience, the whole ASP slug was artificially divided into three slugs: first slug, second slug and the third slug, and the volume was 0.1 PV for each slug, as shown in Table 2. In Model RI and WI, a conventional injection pattern was used so that the ASP slug was injected under a constant viscosity of 30 mPa s. In Model RII and WII, linearly ascending viscosity was used as the injection pattern and the viscosity of the three slugs was 20, 30 and 42 mPa s, respectively. In Model RIII and WIII, linearly descending viscosity was used as the injection pattern and the viscosity of the three slugs was 42, 30 and 20 mPa s, respectively.
| Modela | Injection pattern | Φ (%) | Soi (%) | ASP solution propertiesb | Slug size (PV) | |
|---|---|---|---|---|---|---|
| CHPAMc (mg L−1) | Viscosity (mPa s) | |||||
| a RI–RIII refers to intralayer heterogeneity models and WI–WIII refers to interlayer heterogeneity models.b CHABS = 0.3 wt% and CNaOH = 1.2 wt% in the ASP slug, CHPAM = 1000 mg L−1 in the polymer post-slug.c The total injection quantity of HPAM under different injection patterns is constant. | ||||||
| RI | Constant viscosity | 23.73 | 62.74 | 1250 | 30.4 | 0.3 |
| RII | Linearly ascending viscosity | 24.56 | 64.21 | 850 | 19.7 | 0.1 |
| 1250 | 30.9 | 0.1 | ||||
| 1650 | 42.1 | 0.1 | ||||
| RIII | Linearly descending viscosity | 24.22 | 64.98 | 1650 | 41.9 | 0.1 |
| 1250 | 29.6 | 0.1 | ||||
| 850 | 19.2 | 0.1 | ||||
| WI | Constant viscosity | 23.82 | 64.57 | 1250 | 31.1 | 0.3 |
| WII | Linearly ascending viscosity | 24.31 | 63.41 | 850 | 20.2 | 0.1 |
| 1250 | 30.6 | 0.1 | ||||
| 1650 | 43.1 | 0.1 | ||||
| WIII | Linearly descending viscosity | 23.26 | 64.09 | 1650 | 42.5 | 0.1 |
| 1250 | 30.3 | 0.1 | ||||
| 850 | 19.7 | 0.1 | ||||
(7) After ASP flooding, chase water flooding was performed until the water cut reached 98%. Water production, oil production, and injection pressure were monitored and recorded in real time.
All the procedures were conducted under a constant temperature of 45 °C, and every type of fluid was injected at a constant flow rate of 0.3 mL min−1. The parameters of the physical model and the properties of the solution are listed in Table 2.
2.5 Sample collection and analysis
During and after the injection of the ASP system, fluid samples were obtained from the production wells. A 15 mL sample was taken from every outlet when every 0.1 PV was injected. The viscosity was measured as soon as the samples were obtained.A rotary viscometer was used for the viscosity measurement of the petrochemical and its additive according to the industrial standard.23 The sheer rate of 7.34 s−1 was recommended by the Daqing oilfield.24 A Brookfield viscometer is a typical rotary viscometer and the sheer rate is 7.34 s−1 when using the no. S00 rotor (a column with a radius of 12.50 mm and the container was a cylinder with a radius of 13.57 mm) under a rotation rate of 6 rpm. Thus, the fluid sample viscosity was measured using a Brookfield viscometer. The procedure was as follows:
(1) Start the constant temperature system, and set the temperature at 45 °C.
(2) Turn on the power of the viscometer and initialize the electromotor.
(3) Install the no. S00 rotor and conduct zero correction.
(4) Inject the fluid sample into the sample container, install the container and wait for temperature stabilization.
(5) Start measuring under a rotation rate of 6 rpm and note the viscosity reading when the data is stable.
The relative uncertainty of the viscosity measurement using the viscometer was 2.0%. For the temperature, the relative uncertainty was 2.0045%, 2.0032% and 2.0012% in ASP solution with a polymer concentration of 1650 mg L−1, 1250 mg L−1 and 850 mg L−1, respectively. The effect of error on the viscosity measurement was small and can be neglected. The average viscosity of the effluent from the four outlets was used for the study in the intralayer heterogeneity models, and the viscosity of the effluent from each layer was measured separately in the interlayer heterogeneity models.
3 Results and discussion
3.1 Production performance
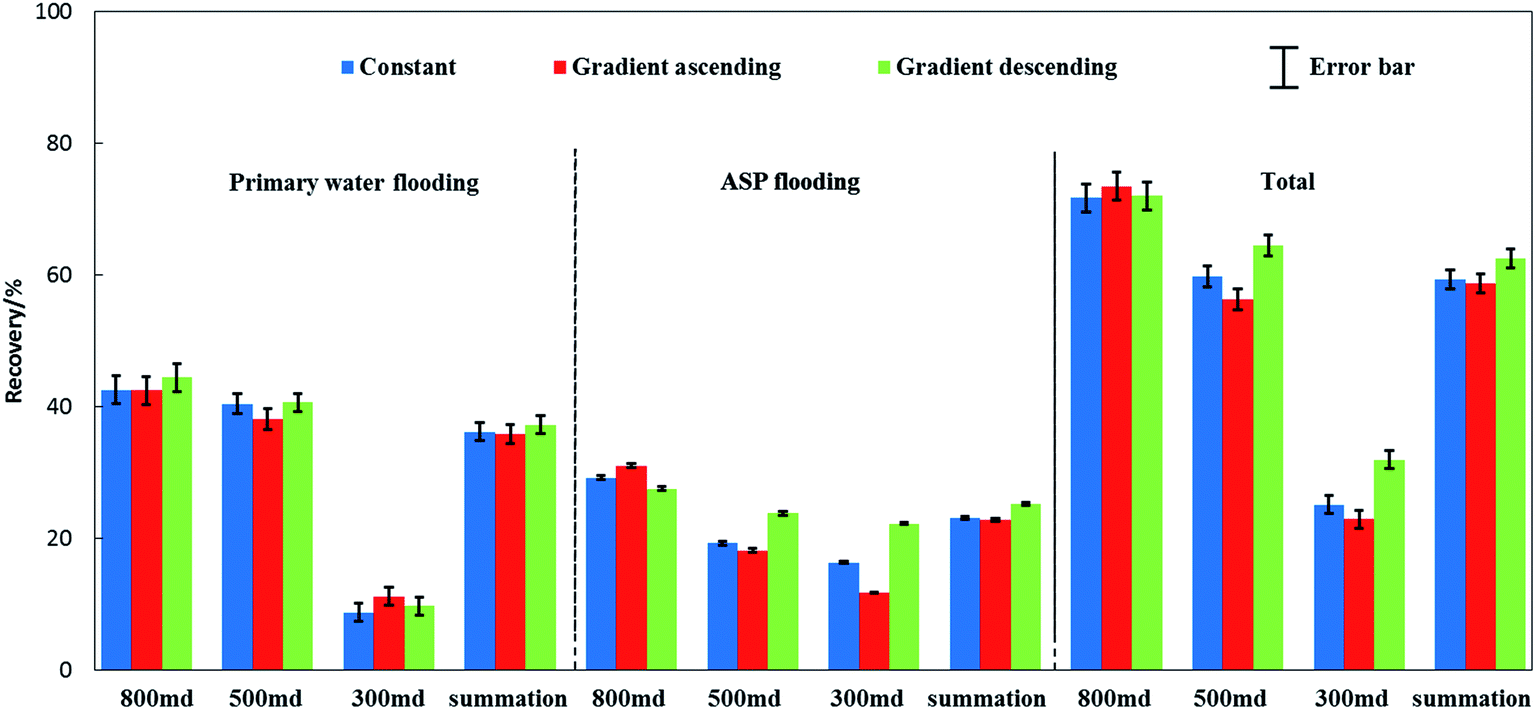
Coreflooding experiments were performed in heterogeneous reservoir models with a five-spot pattern. The results of flooding experiments on the intralayer heterogeneity models, RI, RII and RIII are shown in Table 3. On the basis of a similar recovery during primary water flooding, ASP flooding with constant viscosity, linearly ascending viscosity and linearly descending viscosity increased the recovery by 28.25%, 26.01% and 30.76%, respectively. The increase in oil recovery using linearly descending viscosity was better than the other two injection patterns. The oil recovery of each layer in the interlayer heterogeneity models, WI, WII and WIII are also shown in Table 3. Similar to the results obtained with the intralayer heterogeneity models, the increase in oil recovery in the interlayer heterogeneity models using linearly descending viscosity ASP flooding was higher than that obtained for the other two injection patterns. ASP flooding with constant viscosity, linearly ascending viscosity and linearly descending viscosity increased the recovery by 23.17%, 22.87% and 25.24%, respectively. During the experiments, the errors caused by equipment and measurement technique could affect the uncertainty of the oil recovery. The uncertainty of oil recovery was calculated by considering the uncertainty for the flux pump, thermotank, measuring cylinder and core models. As a result, the standard uncertainty of the enhanced oil recovery measurement was 0.2901% in the intralayer heterogeneity model and 0.2309% in interlayer heterogeneity model according to the uncertainty propagation formula. Under the experimental conditions used, the accuracy was acceptable and the impact on the results was insignificant. Thus, the experimental reproducibility can be assured.| Model | Oil recovery (%) | |||
|---|---|---|---|---|
| Primary water flooding | Increase by ASP flooding | Total | ||
| a Oil recovery in interlayer heterogeneity models refers to monolayer recovery. | ||||
| RI | 31.29 | 28.25 | 59.54 | |
| RII | 29.86 | 26.01 | 55.87 | |
| RIII | 30.10 | 30.76 | 60.87 | |
| WI | Total | 36.22 | 23.17 | 59.39 |
| 800 md | 42.54 | 29.23 | 71.77 | |
| 500 md | 40.46 | 19.29 | 59.75 | |
| 300 md | 8.76 | 16.36 | 25.12 | |
| WII | Total | 35.81 | 22.87 | 58.68 |
| 800 md | 42.46 | 31.05 | 73.51 | |
| 500 md | 38.16 | 18.18 | 56.34 | |
| 300 md | 11.20 | 11.75 | 22.95 | |
| WIII | Total | 37.27 | 25.24 | 62.51 |
| 800 md | 44.47 | 27.58 | 72.05 | |
| 500 md | 40.63 | 23.81 | 64.44 | |
| 300 md | 9.71 | 22.25 | 31.96 | |
ASP flooding with linearly descending viscosity showed the best results for decreasing water cut in the three injection patterns, as shown in Fig. 3. In addition, water cut during ASP flooding with linearly descending viscosity increased slower than in the other two schemes. ASP flooding with linearly descending viscosity showed the largest increasing range of pressure in the initial stage of ASP injection, as shown in Fig. 4. The pressure did not decrease markedly when the viscosity reduced. Sustaining a high pressure led to a long period of high resistance efficiency, which promoted mobility control.
 | ||
| Fig. 3 Water cut under different injection patterns in the intralayer heterogeneity models. | ||
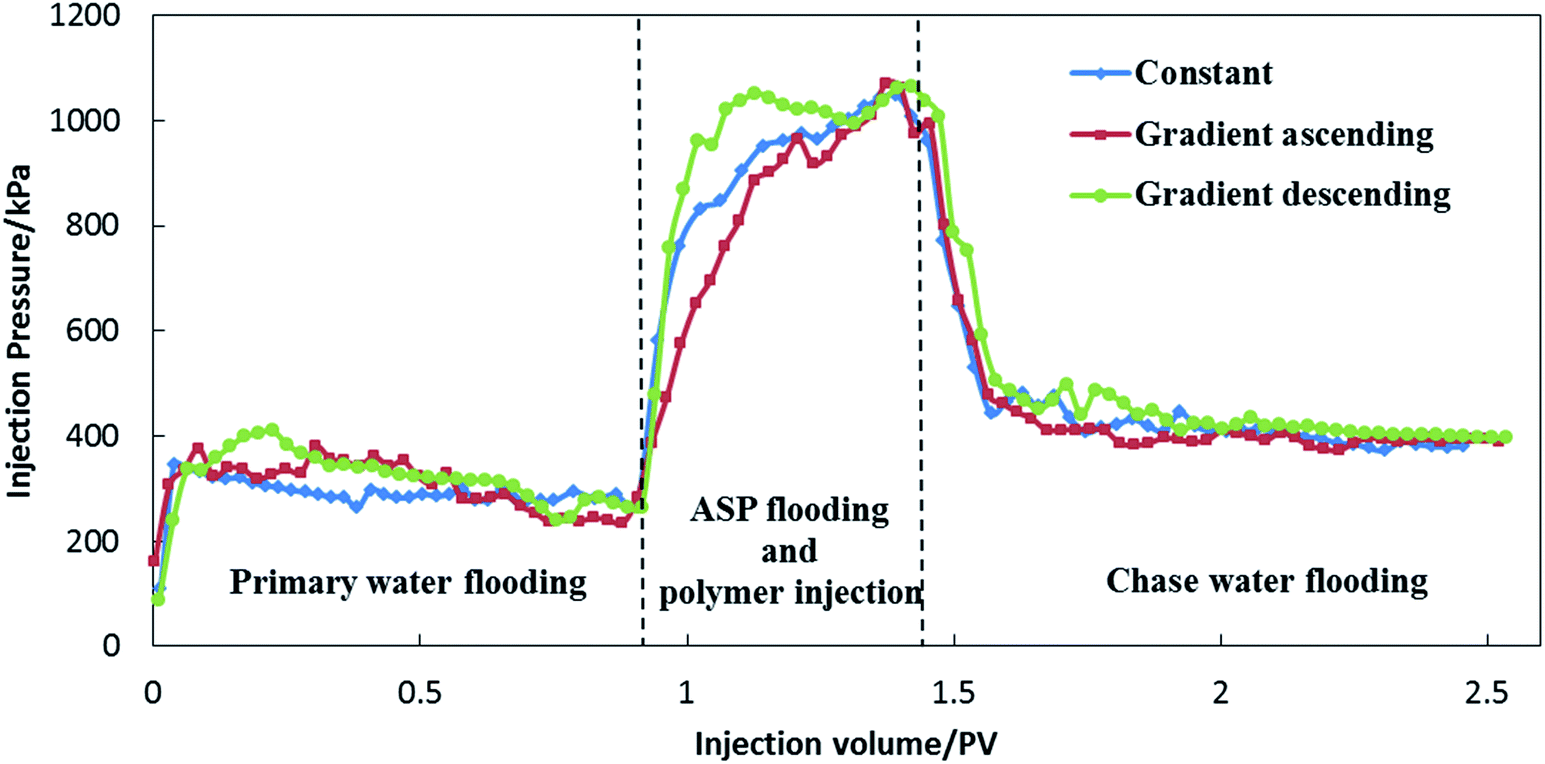 | ||
| Fig. 4 Injection pressure under different injection patterns in the intralayer heterogeneity models. | ||
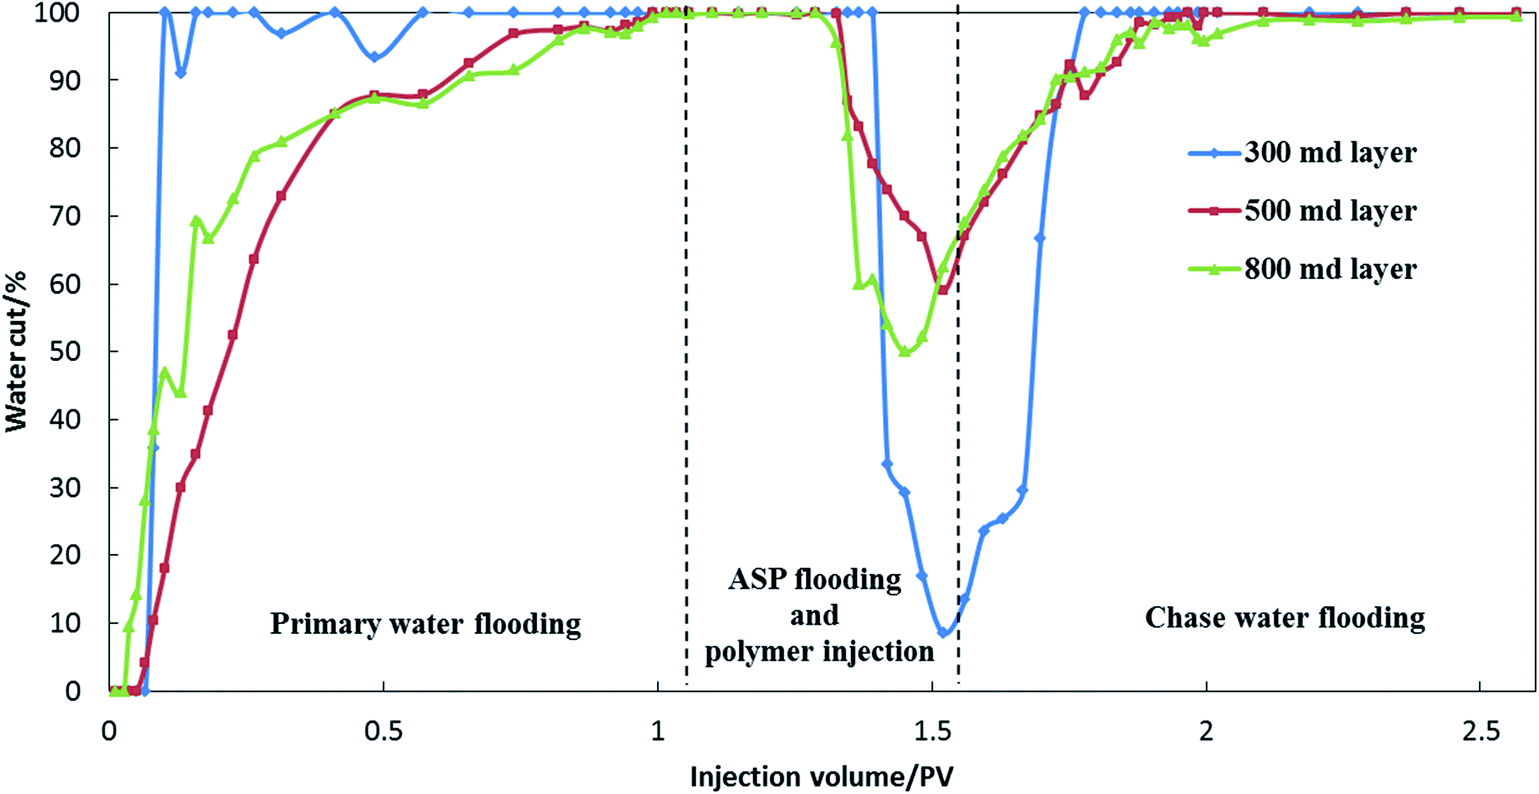
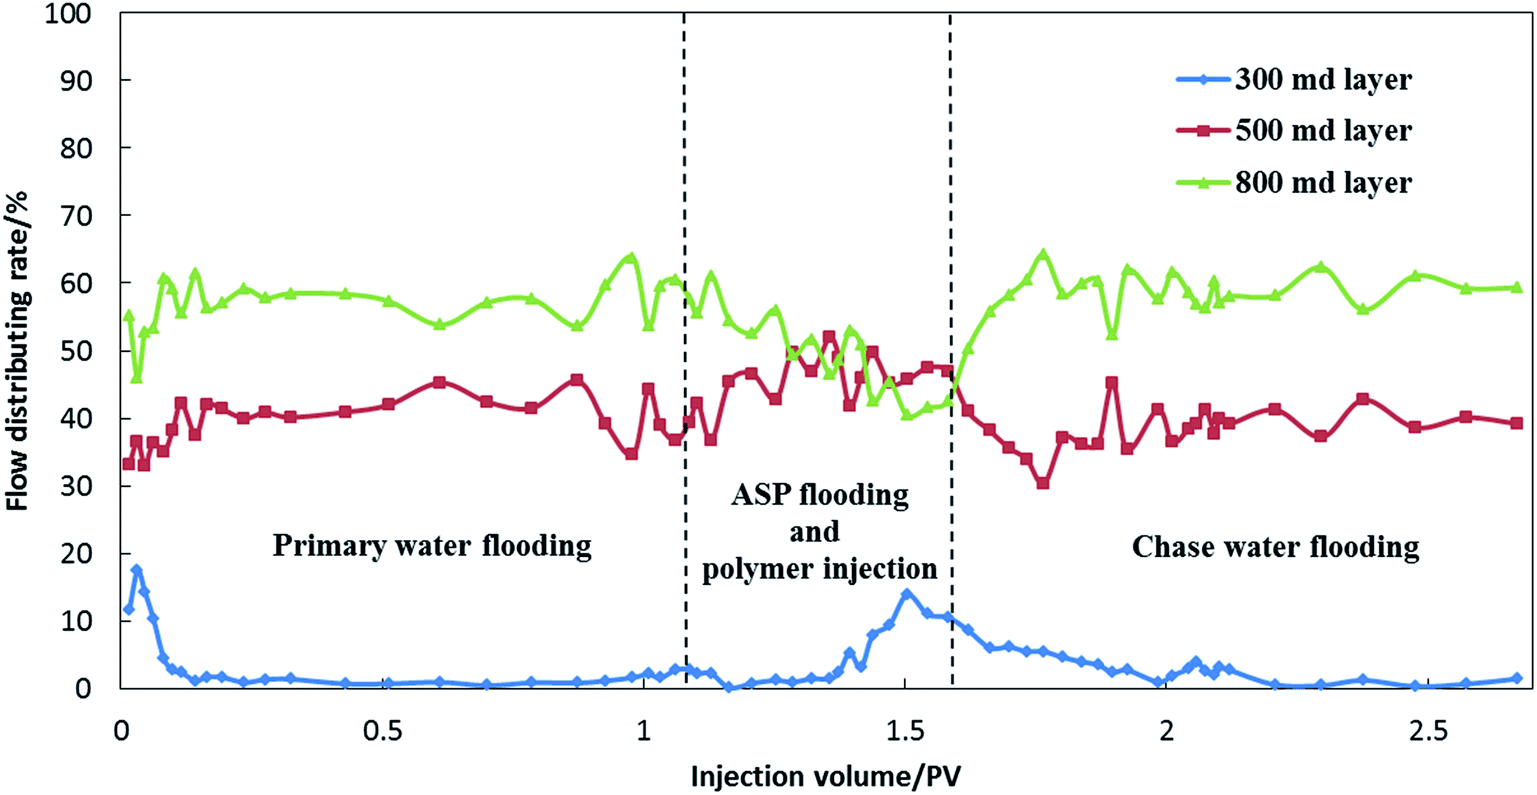
Fig. 5 and 6 show the changing curves of the water cut and fractional flow rate of every layer in ASP flooding with constant viscosity. The water cut in every layer was reduced with the injection of the ASP slug. However, the water cut reduction in the 300 md layer occurred later than in the other two layers for about 0.07 PV. In addition, the fractional flow rate of the 500 md layer and 300 md layers increased during ASP flooding, indicating that the conformity in interlayer model was improved to a certain extent.
 | ||
| Fig. 5 Water cut during ASP flooding with constant viscosity in the interlayer heterogeneity model WI. | ||
 | ||
| Fig. 6 Fractional flow rate of ASP flooding with constant viscosity in the interlayer heterogeneity model WI. | ||
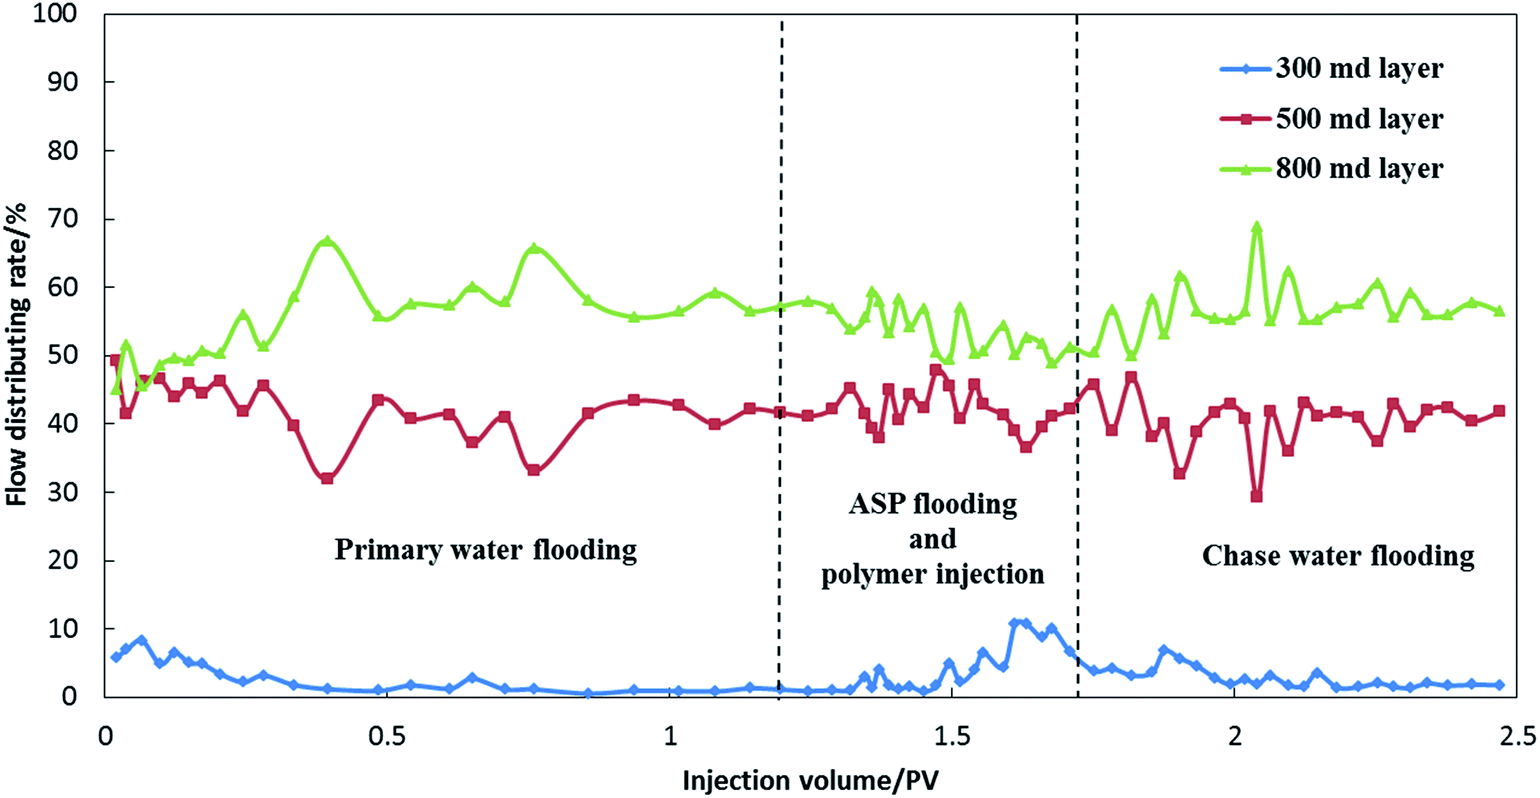
Fig. 7 shows the water cut of every layer in ASP flooding with linearly ascending viscosity. The water cut in every layer was lowered during ASP flooding, nevertheless, the water cut reduction in the 300 md layer occurred later than that in the other two layers for about 0.12 PV. As shown in Fig. 8, the fractional flow rate of the 500 md layer and the 300 md layer increased with the injection of ASP and the polymer slug, which indicated that the mobility ratio had improved.
 | ||
| Fig. 7 Water cut of ASP flooding with linearly ascending viscosity in the interlayer heterogeneity model WII. | ||
 | ||
| Fig. 8 Fractional flow rate of ASP flooding with linearly ascending viscosity in the interlayer heterogeneity model WII. | ||
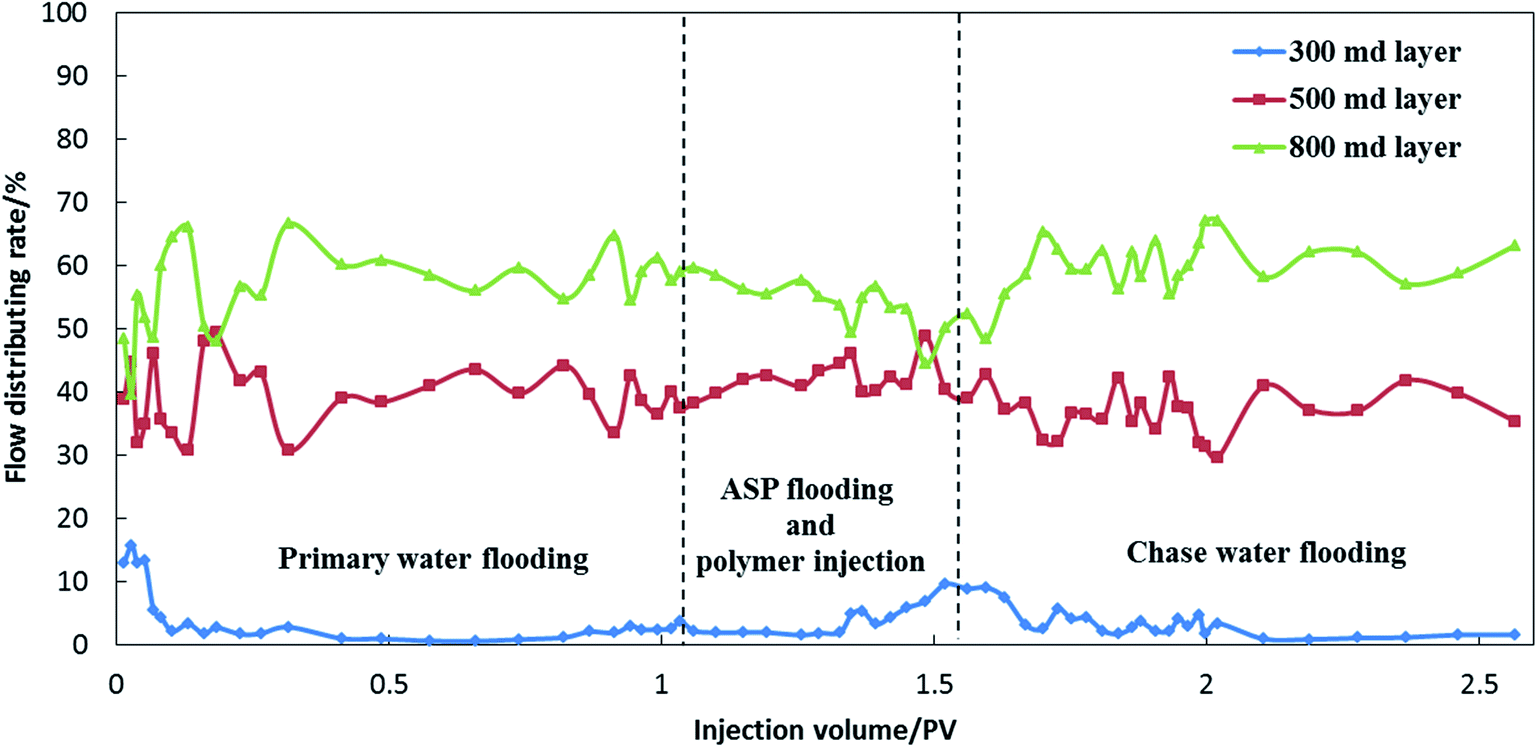
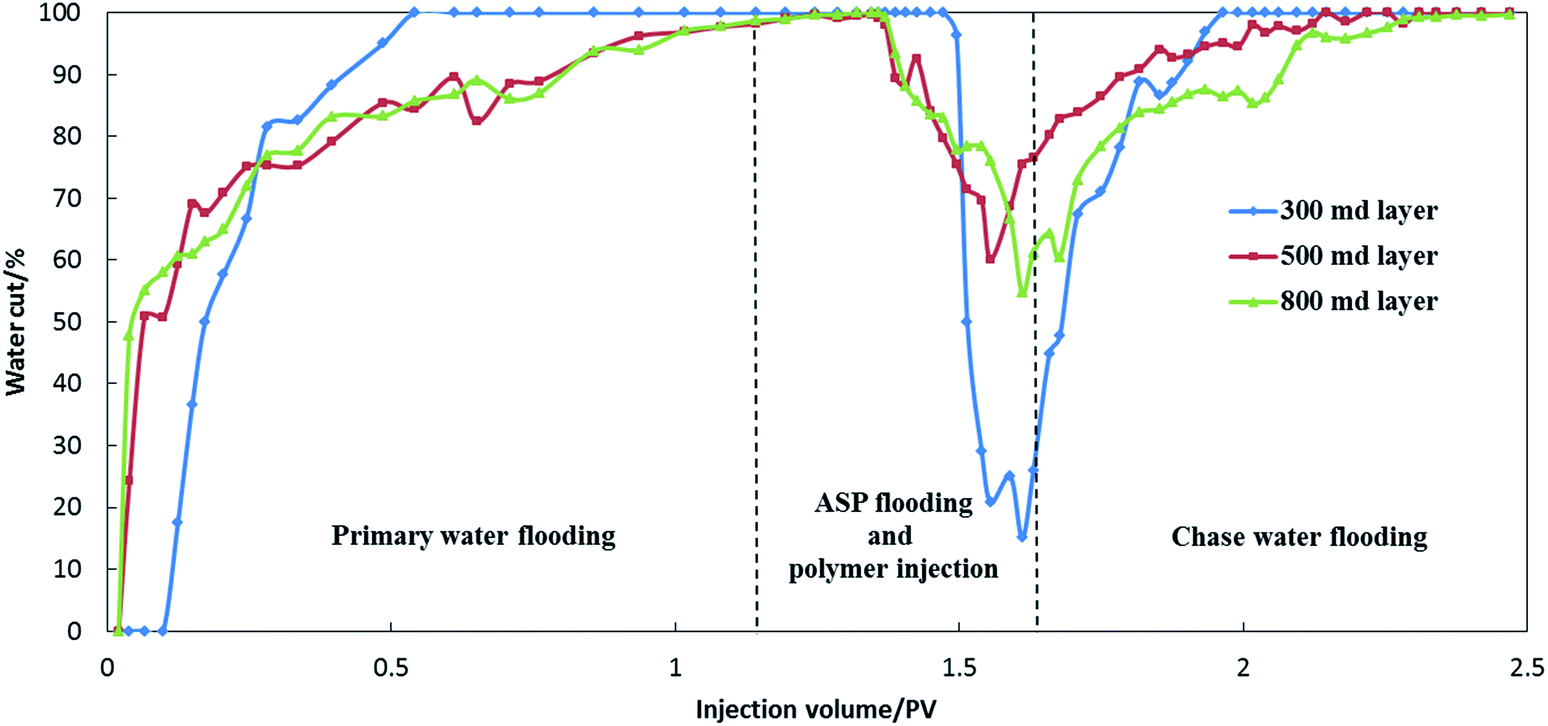
Fig. 9 shows the water cut of every layer in the ASP flooding with linearly descending viscosity. The water cut in every layer decreased during ASP flooding, and the water cut reduction in the 300 md layer did not occur later than that of the other two layers compared with the other two injection patterns. The linearly descending viscosity swept the low permeability layer earlier. The first 0.1 PV slug had the highest viscosity (about 42 mPa s), resulting in the best vertical sweep efficiency of the three injection patterns. In a similar way to the results mentioned previously, the fractional flow rate of the 500 md layer and the 300 md layer increased during ASP flooding, as shown in Fig. 10.
 | ||
| Fig. 9 Water cut of ASP flooding with linearly descending viscosity in the interlayer heterogeneity model WIII. | ||
 | ||
| Fig. 10 Fractional flow rate curves of ASP flooding with linearly descending viscosity in interlayer heterogeneity model WIII. | ||
Using the effluent volume and pore volume, the actual injection volume of ASP/polymer slug in each layer was obtained, as shown in Fig. 11. The combined uncertainty of injection volume can be calculated using the uncertainty propagation formula. The uncertainty of actual injection volume was 0.0290 PV in the 800 md layer, 0.0137 PV in the 500 md layer and 0.0079 PV in the 300 md layer. The error bars are shown in Fig. 11, and the effect of uncertainty on the experimental results was not great. Under the influence of gravity, permeability and the thickness of the layers, the injection volume showed an uneven distribution. Compared to the designed injection volume, i.e., 0.5 PV (0.3 PV ASP and 0.2 PV polymer), the actual injection volume was obviously higher in the 800 md and 500 md layers, and much lower in the 300 md layer. From the three injection patterns, it can be seen that the linearly descending viscosity presented the highest injection volume in the 300 md layer and the lowest in the 800 md layer. This indicated that the linearly descending viscosity achieved good results in profile control.
 | ||
| Fig. 11 Actual injection volume distribution of ASP/polymer slug in each layer. | ||
Fig. 12 shows the oil recovery in each layer at different displacement stages. The similar recovery of primary water flooding indicated that the models were consistent with each other. For the approximate recovery in the 800 md layer, the increase in oil recovery in the 500 md and 300 md layers determined the ultimate displacement efficiency. Considering the uncertainty, the linearly descending viscosity gave an increased oil recovery of 23.81 ± 0.33% in the 500 md layer, which was obviously higher than the constant viscosity (19.29 ± 0.32%) and the linearly ascending viscosity (18.18 ± 0.32%). However, the linearly descending viscosity improved oil recovery by 22.25 ± 0.16% in the 300 md layer, and the incremental recovery was 16.36 ± 0.13% using constant viscosity and 11.75 ± 0.12% using linearly ascending viscosity in the same layer. In addition, the uncertainty caused by measurement techniques and the instruments used had little effect on the comparison of the injection patterns.
 | ||
| Fig. 12 Comparison of oil recovery in the interlayer heterogeneity models. | ||
Table 4 summarizes the recovery of each layer and the whole model. Then using these data the contribution to the ultimate recovery of each layer could be obtained. The contribution of the 500 md and 300 md layers was 36.64% and 14.49%, respectively, in ASP flooding with linearly descending viscosity, and both were the highest in the three injection patterns. This indicated that using different injection patterns in the ASP system showed little effect on the recovery of the 800 md layer but a remarkable effect on the recovery of the 500 md and 300 md layers. The higher oil recovery obtained for the 500 md and 300 md layers gave a better overall oil recovery. From these results, ASP flooding with linearly descending viscosity was the optimal injection pattern.
| Injection pattern | Layer | Recovery (%) | Contribution rate by ASP flooding (%) | ||
|---|---|---|---|---|---|
| Primary water flooding | ASP flooding | Total | |||
| Constant viscosity | 800 md | 18.64 | 12.81 | 31.45 | 55.28 |
| 500 md | 16.16 | 7.70 | 23.86 | 33.25 | |
| 300 md | 1.42 | 2.66 | 4.08 | 11.47 | |
| Total | 36.22 | 23.17 | 59.39 | 100.00 | |
| Linearly ascending viscosity | 800 md | 18.96 | 12.73 | 31.69 | 59.21 |
| 500 md | 15.34 | 6.90 | 22.24 | 32.11 | |
| 300 md | 1.78 | 1.87 | 3.65 | 8.68 | |
| Total | 36.08 | 21.50 | 57.58 | 100.00 | |
| Linearly descending viscosity | 800 md | 19.89 | 12.34 | 32.23 | 48.87 |
| 500 md | 15.78 | 9.25 | 25.03 | 36.64 | |
| 300 md | 1.60 | 3.65 | 5.25 | 14.49 | |
| Total | 37.27 | 25.24 | 62.51 | 100.00 | |
3.2 Remaining oil distribution
The electrical resistivity of different locations in the core models was obtained during the coreflooding experiments. Correlations between saturation and resistivity were derived using the Archie equation:25
 | (1) |
Ro, b and n are related to the oil, brine and core used in the experiments, which can be measured or calculated using a one-dimensional flow model.26 By inputting known quantities, n and b (n = 2.593, and b = 1.055 in this study) into saturation collector, So can be obtained by measuring Rt at different times.
With measurement probes arranged in the core models, the Rt of each layer was measured, and then the oil saturation was calculated. It should be noted that only the results in the interlayer heterogeneity models are shown for correlation with the monolayer recovery. The remaining oil distribution in each layer at different stages could be plotted using the Surfer 13 software (Golden Software, Co, USA), as shown in Fig. 13–15. Using horizontal comparison, the oil saturation reduced with the displacement. The low So area was located along the main flow direction between the injector and the producer. The reduction of So in the swept region suggested that ASP flooding could enhance the displacement efficiency, and the enlargement of the swept region indicated its effect on improving the sweep efficiency. Using vertical comparison, the lower the permeability was, the poorer the sweep effect was by both primary water flooding and ASP flooding. In addition, the sweep efficiency by water flooding was quite poor in the 300 md layer, but the situation could be improved to a certain extent, by using ASP flooding.
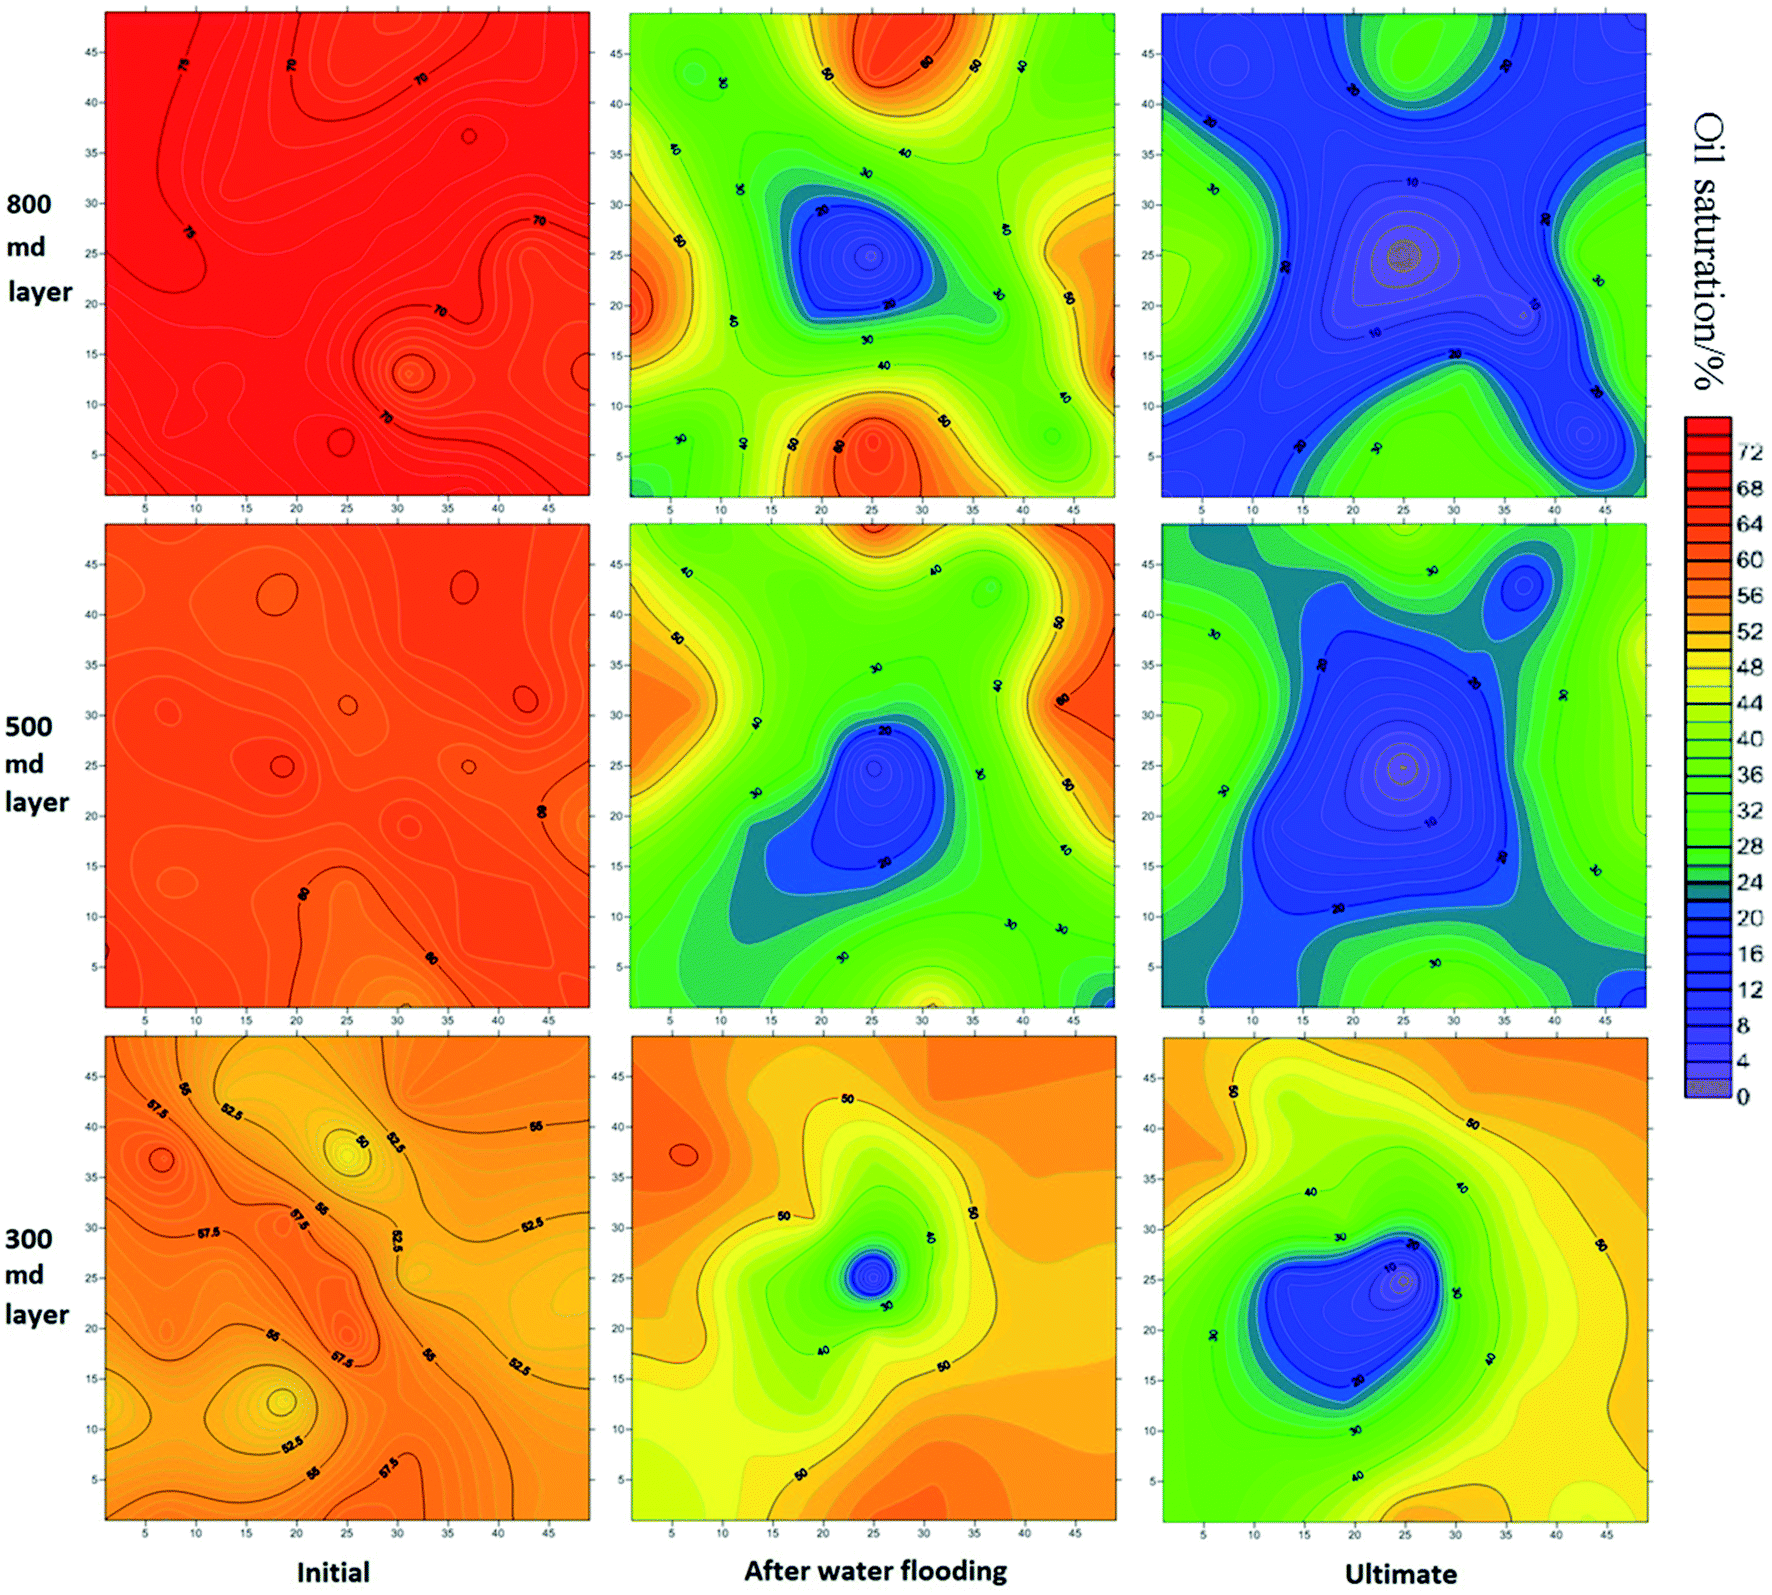 | ||
| Fig. 13 Oil saturation distribution in different layers with ASP flooding with constant viscosity. | ||
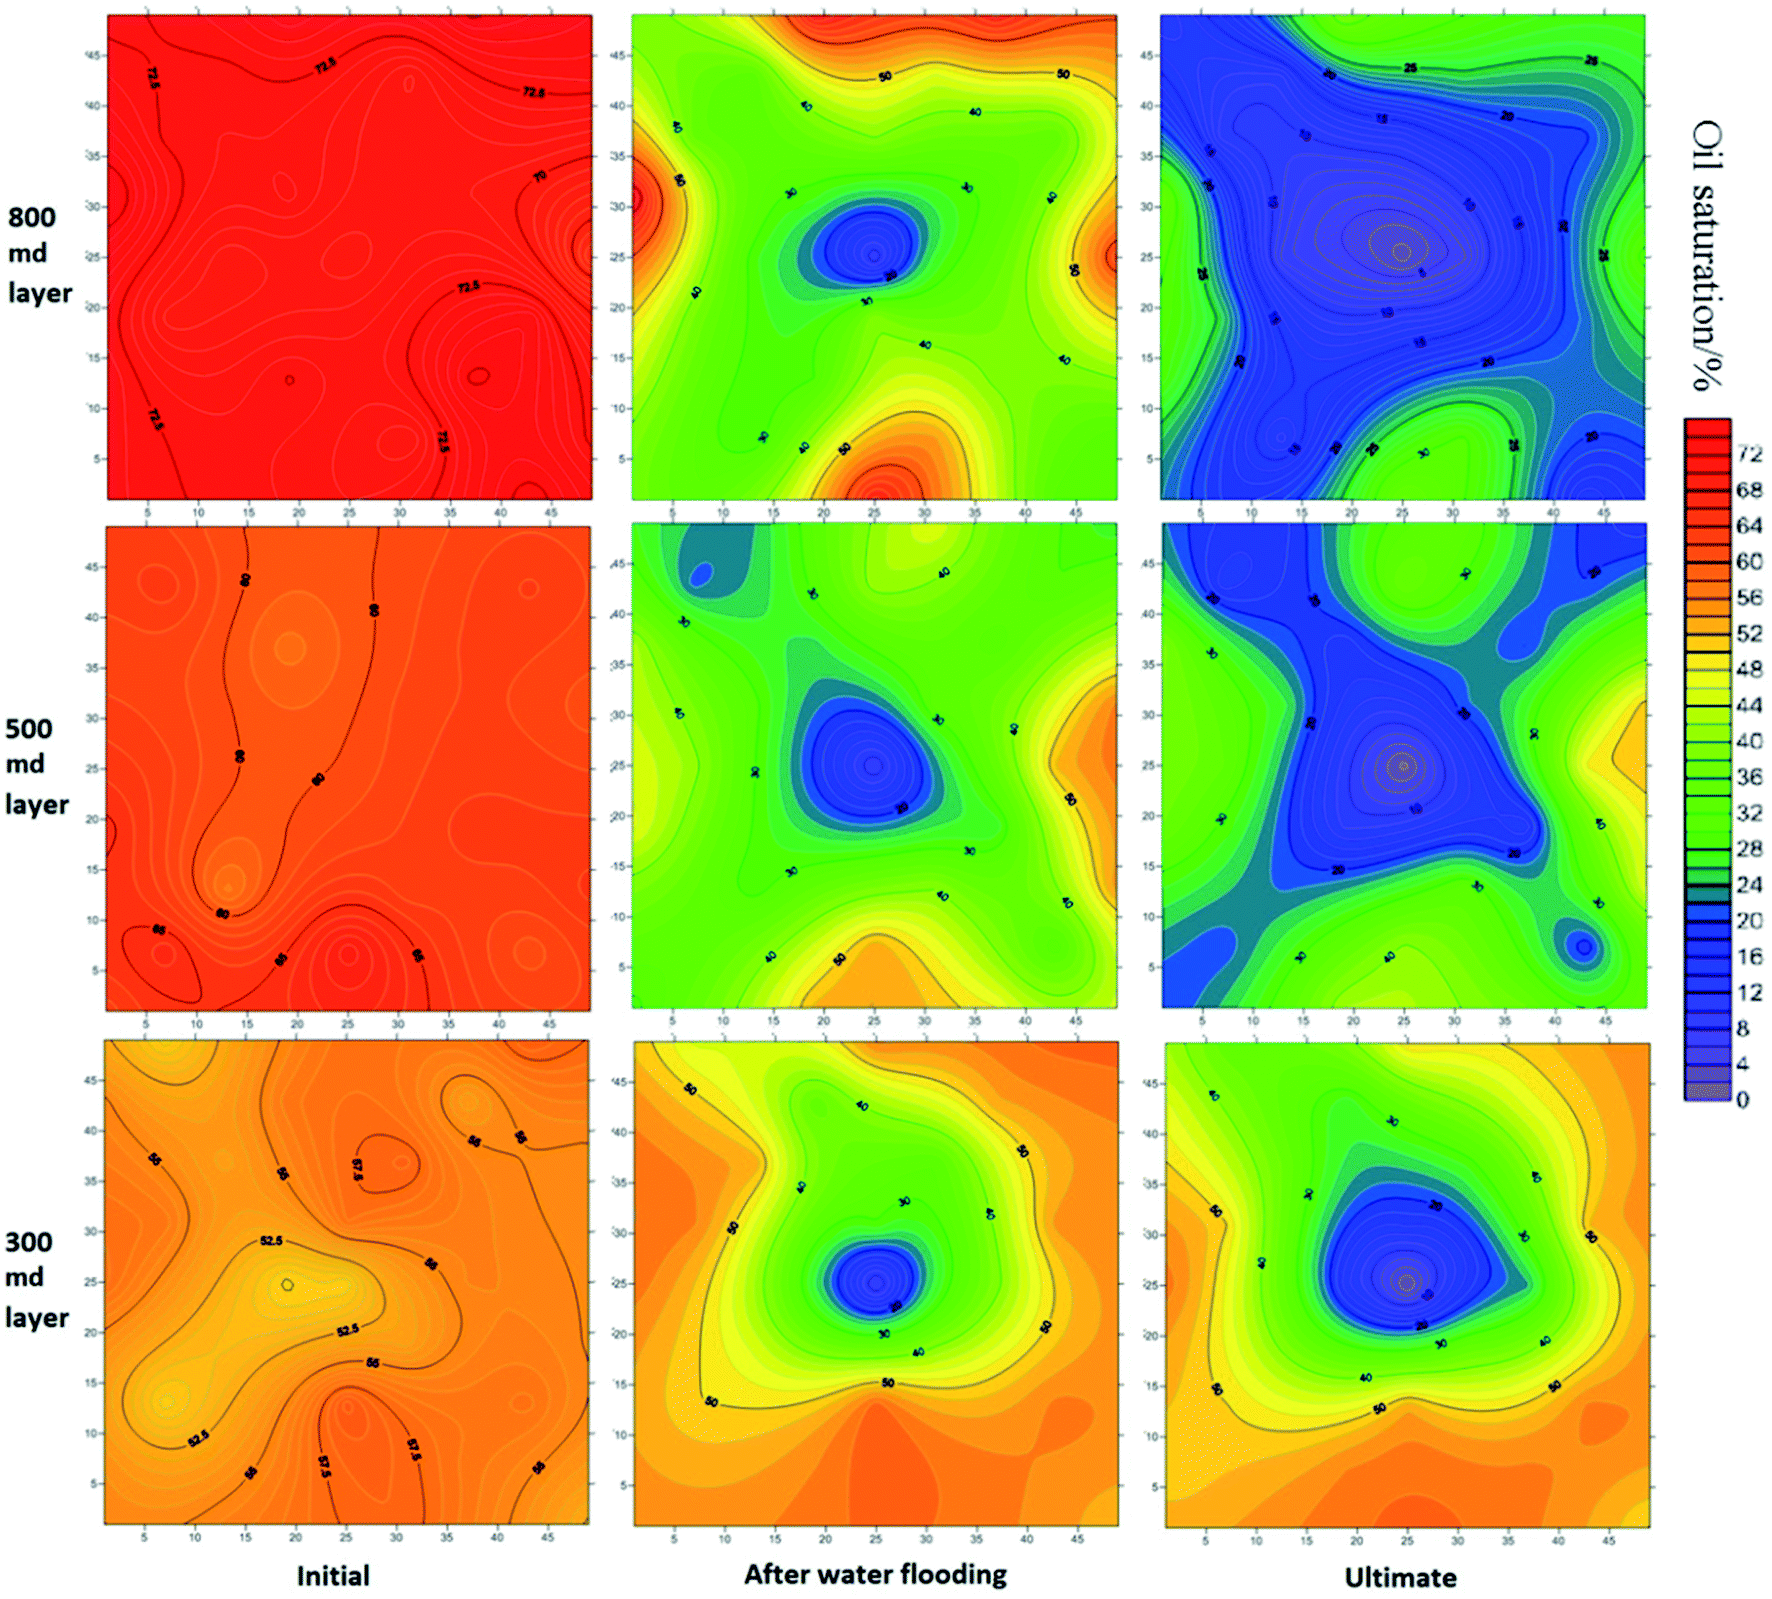 | ||
| Fig. 14 Oil saturation distribution in different layers in ASP flooding with linearly ascending viscosity. | ||
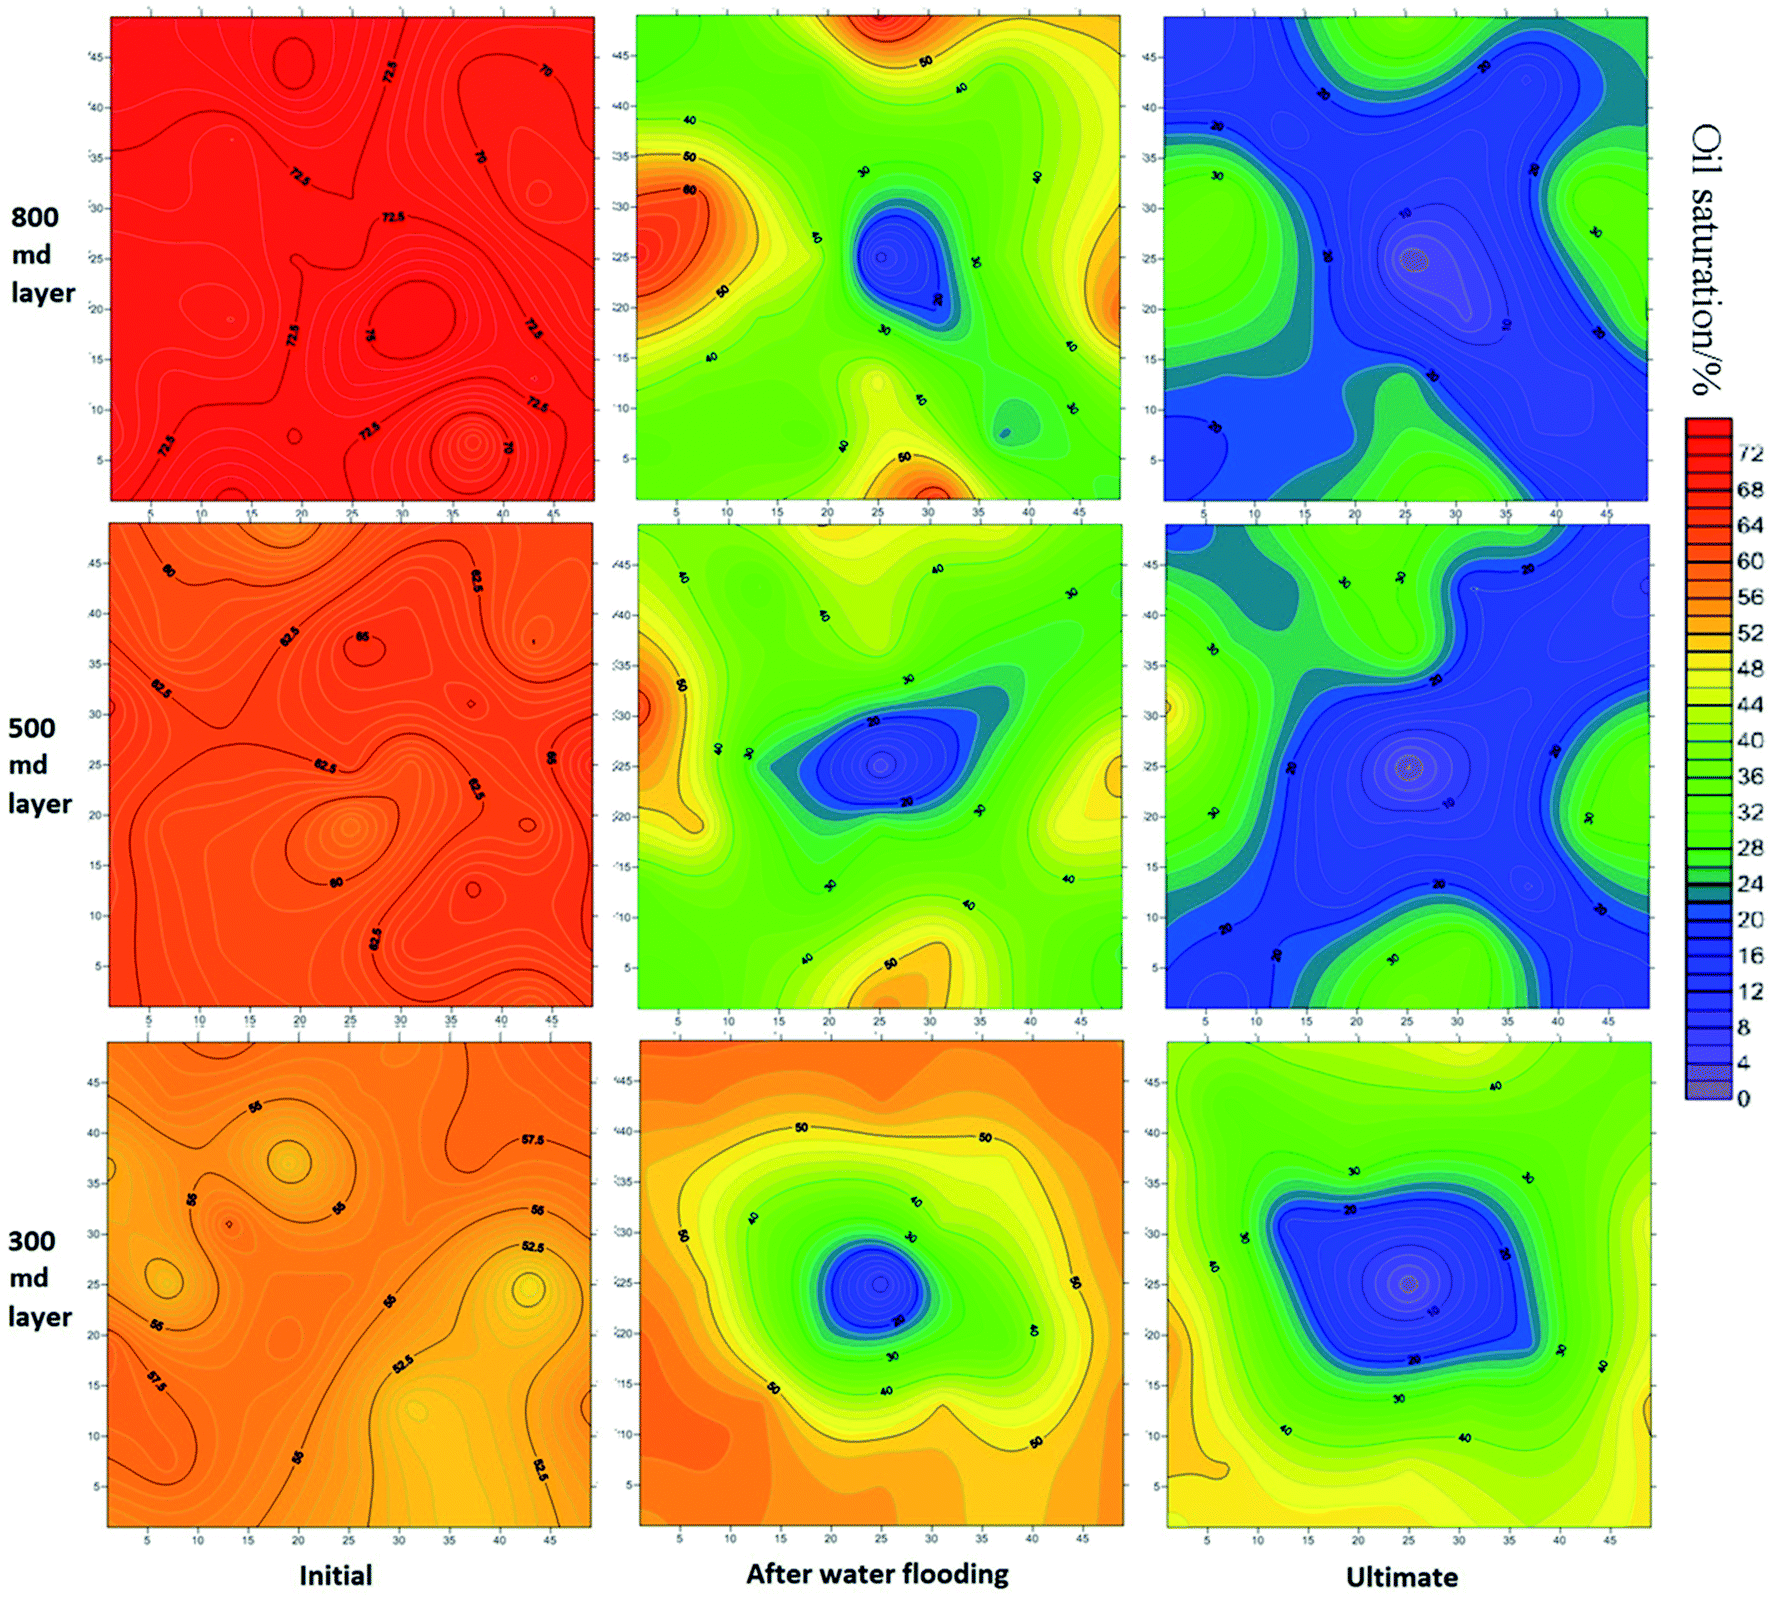 | ||
| Fig. 15 Oil saturation distribution in different layers in ASP flooding with linearly descending viscosity. | ||
The resistivity, Rt, between a pair of probes decreased with the increase of injection volume, as shown in Fig. 16. Rt would barely reduce at first, and then dropped significantly with the injection of the displacement agent. On the basis of this, the derivative of Rt was calculated and the derivative curve was obtained. The peak value of the derivative curve was used to determine a corresponding value of Rt, with which the displacement front can be located.27
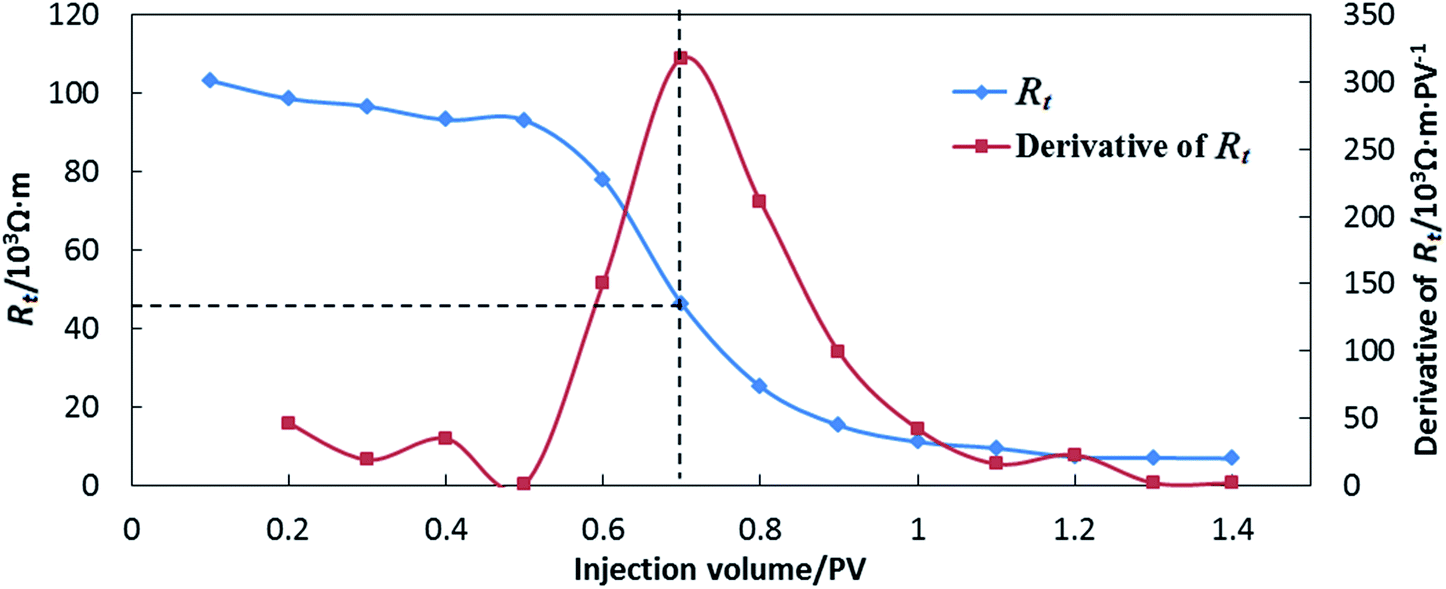 | ||
| Fig. 16 Rt and derivative of Rt as a function of injection volume (schematic diagram). | ||
For the displacement front, the sweep efficiency was shown distinctly on the isoline graphs, and the sweep efficiency was obtained by calculating the integral area of the swept region. Taking the 300 md layer as an example, under a similar sweep efficiency of primary water flooding, the sweep efficiency was increased after ASP flooding, as shown in Fig. 17. After ASP flooding with a constant viscosity, the sweep efficiency was enhanced to 0.422, but the swept region appeared to be an uneven shape. The sweep efficiency of ASP flooding with an linearly ascending viscosity was 0.374, which was even lower than that obtained using constant viscosity injection. By contrast, the sweep efficiency after ASP flooding with linearly descending viscosity increased up to 0.687, which showed a wide and homogeneous swept region.
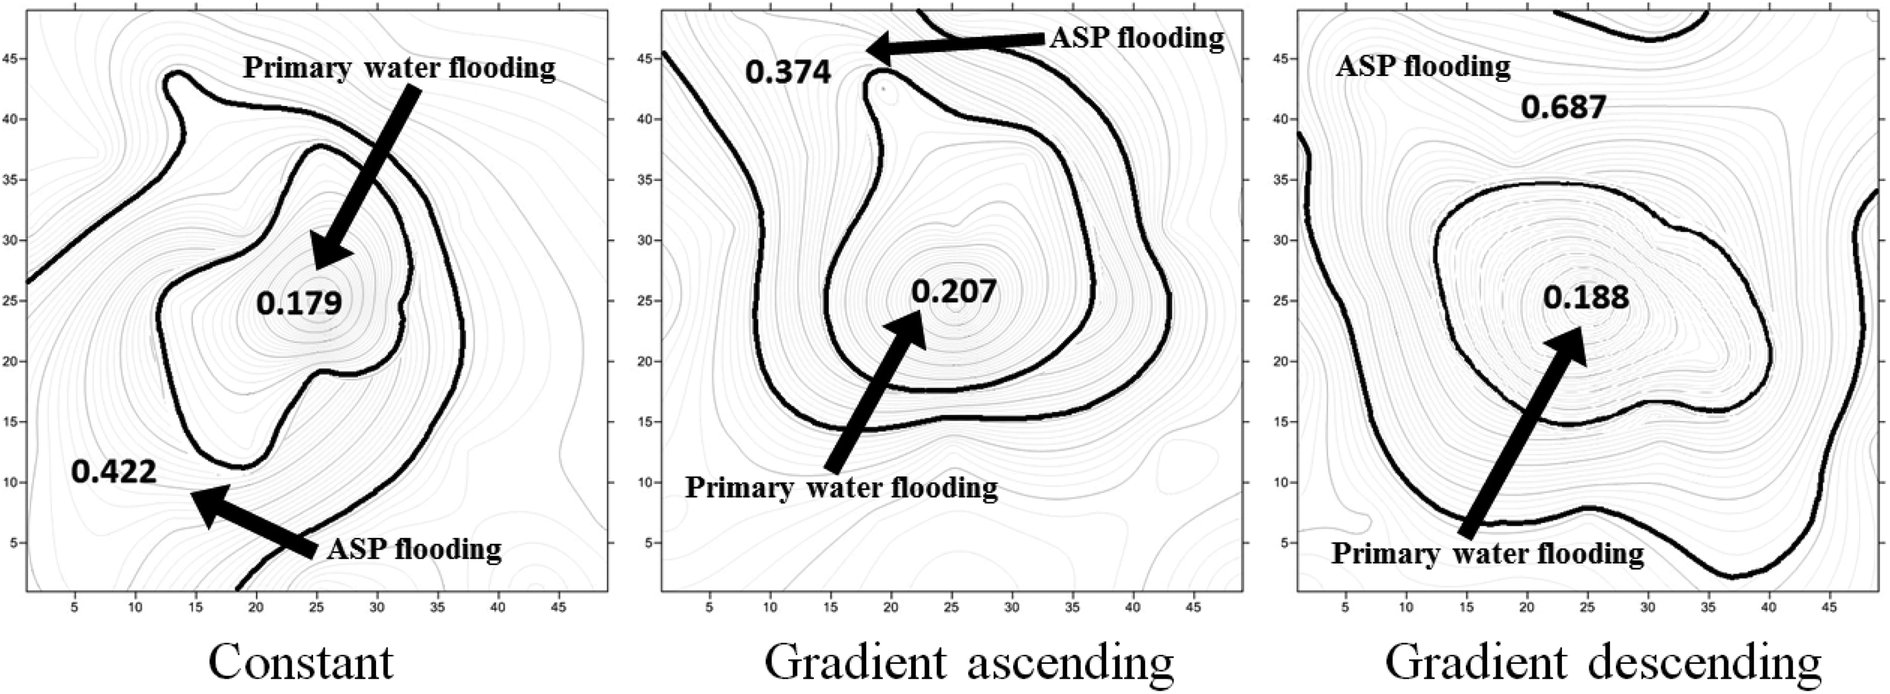 | ||
| Fig. 17 Sweep efficiency at different displacement stages in the 300 md layer (inside: primary water flooding; outside: ASP flooding). | ||
Using this method, the sweep efficiency of water flooding and ASP flooding in different layers can be obtained, as shown in Table 5. As a consequence of the large injection rate, the ultimate sweep efficiency of the 500 md layer and the 800 md layer reached 1.0. Therefore, to a great extent, the sweep effect of the 300 md layer impacted on the overall recovery. From these results ASP flooding with linearly descending viscosity showed a great potential.
| Injection pattern | Layer | Sweep efficiency | |
|---|---|---|---|
| Water flooding | ASP flooding | ||
| Constant viscosity | 800 md | 0.789 | 1.0 |
| 500 md | 0.714 | 1.0 | |
| 300 md | 0.179 | 0.422 | |
| Linearly ascending viscosity | 800 md | 0.821 | 1.0 |
| 500 md | 0.733 | 1.0 | |
| 300 md | 0.207 | 0.374 | |
| Linearly descending viscosity | 800 md | 0.830 | 1.0 |
| 500 md | 0.725 | 1.0 | |
| 300 md | 0.188 | 0.687 | |
3.3 Variation of viscosity
To research the viscosity variation trend of displacement agent during ASP flooding, fluid samples were obtained from production wells for viscosity measurement. To study the effect of injection pattern on production in intralayer heterogeneity models, water cut and effluent viscosity were plotted in the same coordinate system, as shown in Fig. 18–20. The effluent viscosity rose at the first stage, and then decreased. The loss of polymer caused by diffusion, adsorption and retention led to the decline of viscosity. As a consequence, the peak value of effluent viscosity was around 25 mPa s, which was lower than the initial viscosity. The water cut curve exhibited a “V” shape, and it took about 0.3 PV to reach the valley after injection.For the different injection patterns, the shape and occurrence of the effluent viscosity peaks differed from each other. The effluent viscosity peak occurred later than water cut valley for 0.27 PV in ASP flooding with constant viscosity, as shown in Fig. 18.
 | ||
| Fig. 18 Water cut and effluent viscosity as a function of injection volume in ASP flooding with constant viscosity in an intralayer heterogeneity model. | ||
This gap was even enlarged to 0.38 PV in ASP flooding with linearly ascending viscosity, as shown in Fig. 19. The increase of viscosity was slow as the viscosity of displacement agent increased step by step from 20 to 42 mPa s. Thus, the viscosity was still increasing as the water cut began to rise. This showed that the increase of viscosity after the valley of water cut was reached, failed to reduce the water cut further.
 | ||
| Fig. 19 Water cut and effluent viscosity as a function of injection volume in ASP flooding with linearly ascending viscosity in an intralayer heterogeneity model. | ||
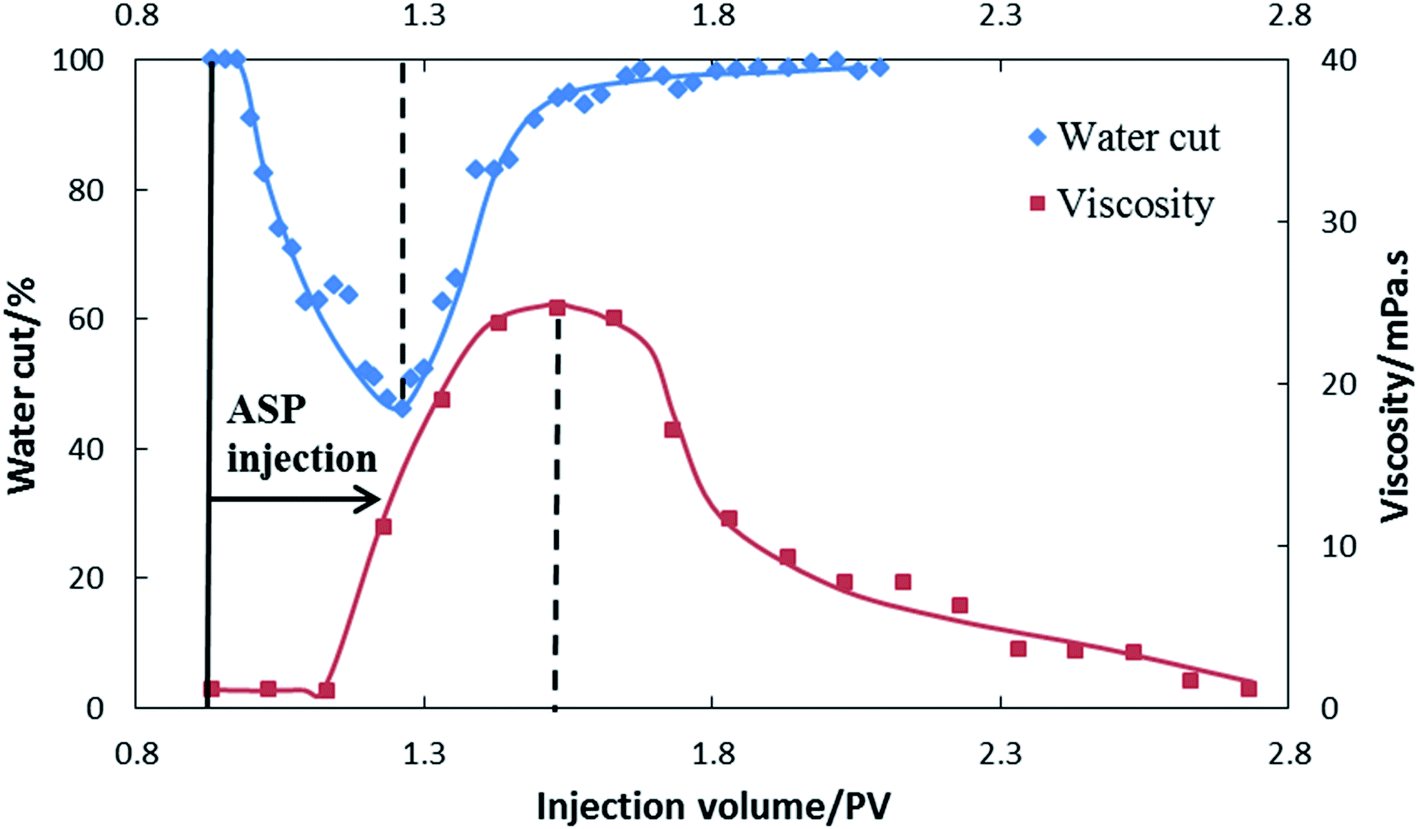
By contrast, the effluent viscosity peak and valley of water cut occurred almost at the same time in ASP flooding with linearly descending viscosity, as shown in Fig. 20. The viscosity curve rose sharply because the initial ASP slug exhibited the highest viscosity.
 | ||
| Fig. 20 Water cut and effluent viscosity as a function of injection volume in ASP flooding with linearly ascending viscosity in an intralayer heterogeneity model. | ||
For different injection patterns, a large gap between water cut valley and effluent viscosity peak led to low incremental oil recovery, as shown in Table 6. This result indicated that a rapid increase of viscosity could improve sweep volume at early and therefore bring great development effect.
| Injection pattern | Peak or valley position/PV | Gap between peak and valley (PV) | Incremental oil recovery (%) | |
|---|---|---|---|---|
| Water cut valley | Effluent viscosity peak | |||
| Constant viscosity | 1.26 | 1.53 | 0.27 | 28.25 |
| Linearly ascending viscosity | 1.24 | 1.62 | 0.38 | 26.01 |
| Linearly descending viscosity | 1.27 | 1.29 | 0.02 | 30.76 |
To study the effect of injection pattern on the viscosity of displacement agent in different layers, the data collected from the interlayer heterogeneity models were analysed. As shown in Fig. 21, because of the distribution of injected fluid between the layers, the viscosity decreased with the decrease of permeability. The average effluent viscosity of ASP flooding with linearly descending viscosity in the 500 md and 300 md layers was 8.50 mPa s and 3.65 mPa s, respectively. In comparison, the average effluent viscosity of constant viscosity was 7.37 mPa s in the 500 md layer and 2.38 mPa s in the 300 md layer. The ASP flooding with linearly ascending viscosity gave an average effluent viscosity of 6.46 mPa s in the 500 md layer and 2.28 mPa s in 300 md layer. This indicated that the linearly descending viscosity had a higher mobility modification ability than the other two injection patterns in the middle and low permeability layers.
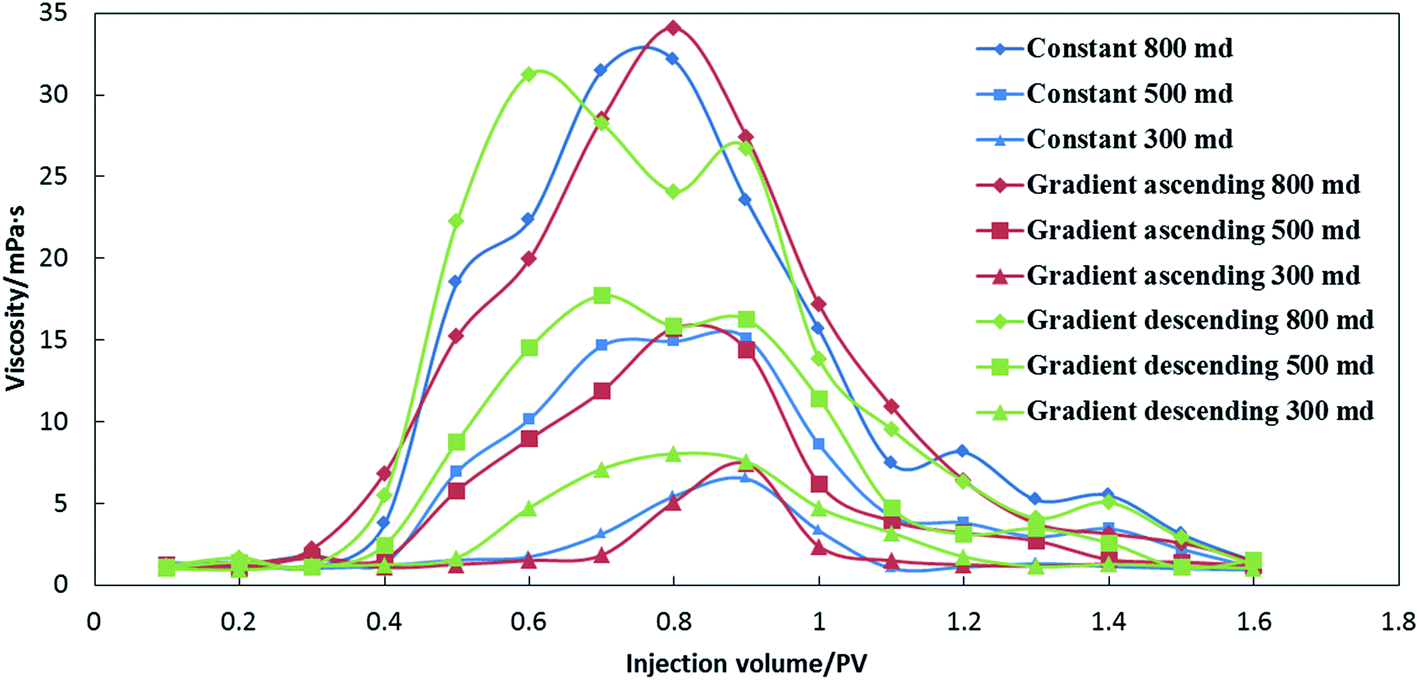 | ||
| Fig. 21 Effluent viscosity in different layers as a function of injection volume injection volume at ASP flooding stage in interlayer heterogeneity models. | ||
3.4 Mechanism analysis
By comparing the three types of ASP injection patterns, a linearly descending viscosity technique gave the best performance, and linearly ascending viscosity had the least effect on improving oil recovery. Because the same dosage of chemicals was injected for three injection patterns, the only difference was the arrangement of the different viscosity slugs.For convenience, the whole ASP slug (0.3 PV) was artificially divided into three slugs: first slug, second slug and the third slug, and the volume was 0.1 PV for each slug. It could be perceived that the injection pattern with the highest viscosity in first slug (about 42 mPa s) achieved the highest oil recovery. In this study, vertical sweep efficiency was the dominating factor to oil recovery. In other words, although the 800 md layer contributed the most to oil recovery, the development effect of the 500 md and 300 md layer was the key point which determined the ultimate oil recovery.
As shown in Fig. 22, because of the permeability difference in the three layers, the injected fluid penetrated into the 800 md layer preferentially, and then into the 500 md layer and finally into the 300 md layer. With the injection of the first slug, the flow resistance in each layer was enlarged, particularly for the 800 md layer. The different viscosity of the first slug led to the difference in the flow resistance increase, and the increase of resistance directly affected the fractional flow of the subsequent slugs in the three layers. In other words, the high viscosity of the first slug led to the high flow resistance of the 800 md layer, and then the subsequent fluid was tuned to flood the 500 md and 300 md layers. Therefore, the viscosity of the first slug had the greatest impact on vertical sweep efficiency and thus the increased oil recovery in the 500 md and 300 md layers, as shown in Fig. 11, Tables 3 and 4.
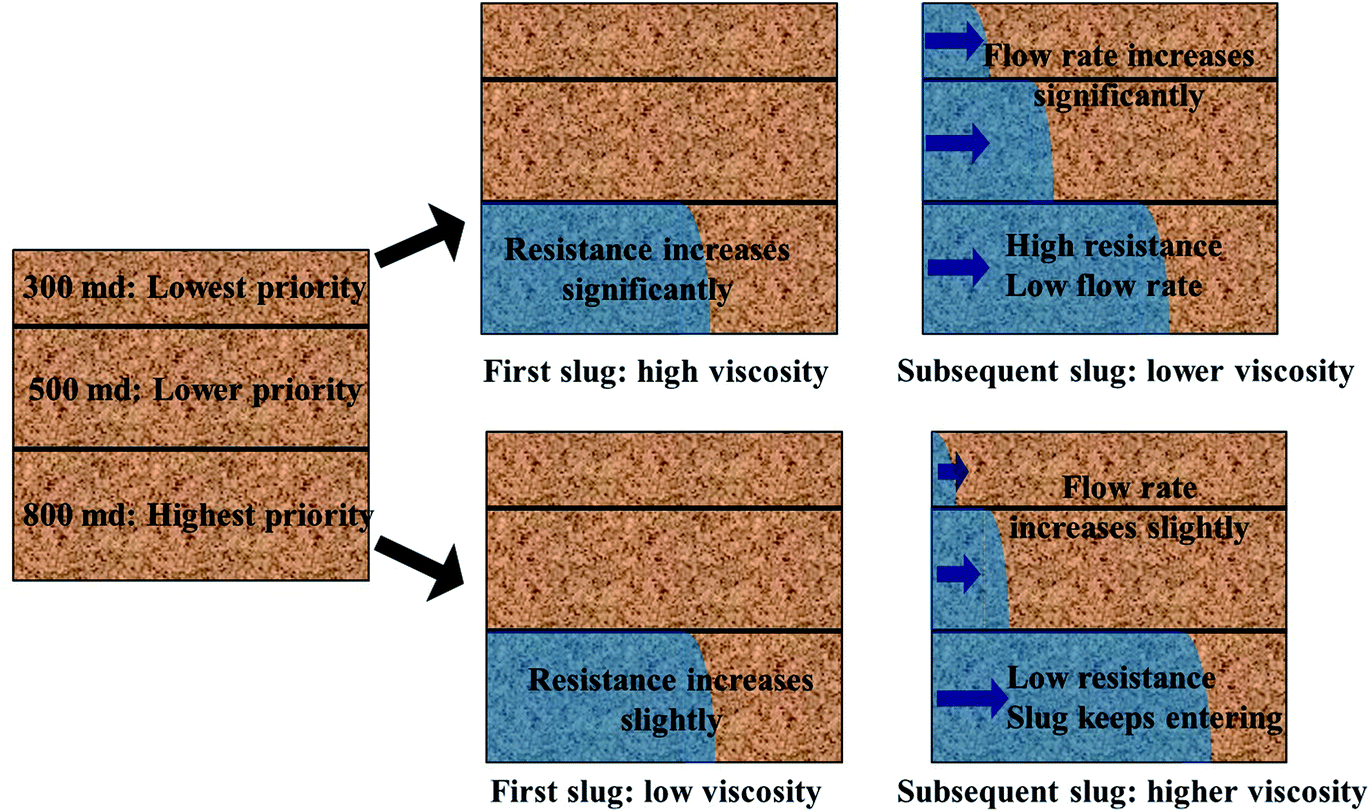 | ||
| Fig. 22 Schematic diagram of ASP flooding with linearly descending viscosity. | ||
4 Conclusion
ASP flooding in multilayer heterogeneous models was performed using three injection patterns including ASP flooding with constant viscosity, ASP flooding with linearly ascending viscosity and ASP flooding with linearly descending viscosity. Production performance, remaining oil saturation, effluent viscosity, and the mechanisms behind them are discussed next to determine the effect of the injection pattern of ASP flooding.(1) Linearly descending viscosity had the best performance on ASP mobility modification in the three injection patterns, and the highest oil recovery was obtained using the same dosage of chemicals.
(2) For the heterogeneous model, the sweep efficiency and displacement efficiency of the layers with middle and low permeability were the dominating factor for total oil recovery. ASP flooding with linearly descending viscosity produced the best sweep effect in the middle and low permeability layers.
(3) The high viscosity of the first slug led to a high fractional flow rate of the middle and low permeability layers. Thus, preferentially, and rapidly increasing the viscosity of the displacement agent was of great significance for the enhanced oil recovery.
ASP flooding with linearly descending viscosity is recommended as a substitute for the conventional injection pattern of ASP slugs. In addition, it is strongly suggested that the sweep efficiency be given priority over the displacement efficiency in multilayer heterogeneous reservoirs in practical applications.
Conflicts of interest
There are no conflicts to declare.Acknowledgements
We would like to thank the National Science and Technology Major Project of China (No. 2017ZX05009-004) for the financial support to carry out this research.References
- J. Cheng, Q. Li and G. Liao, et al., Review of ASP flooding pilot tests in Daqing oilfield, Pet. Geol. Oilfield Dev. Daqing, 2001, 20(2), 46–49 Search PubMed.
- A. Mandal, Chemical flood enhanced oil recovery: a review, Int. J. Oil, Gas Coal Technol., 2015, 9(3), 241–264 CrossRef CAS.
- A. A. Adasani and B. Bai, Analysis of EOR projects and updated screening criteria, J. Pet. Sci. Eng., 2011, 79(1–2), 10–24 CrossRef.
- X. Yue, Foundation of enhanced oil recovery, Petroleum Industry Press, Beijing, 2007, vol. 4–5, pp. 145–149 Search PubMed.
- W. B. Gogarty, Mobility Control with Polymer Solutions, SPEJ, Soc. Pet. Eng. J., 1967, 7(2), 161–173 CrossRef CAS.
- M. H. Sedaghat, A. Hatampour and R. Razmi, Investigating the role of polymer type and dead end pores' distribution on oil recovery during ASP flooding, Egypt. J. Pet., 2013, 22(2), 241–247 CrossRef.
- J. J. Meyers, M. J. Pitts and K. Wyatt, et al., Alkaline-Surfactant-Polymer Flood of the West Kiehl, Minnelusa Unit, Spe/doe Enhanced Oil Recovery Symposium, 1992 Search PubMed.
- A. A. Olajire, Review of ASP EOR (alkaline surfactant polymer enhanced oil recovery) technology in the petroleum industry: Prospects and challenges, Energy, 2014, 77(C), 963–982 CrossRef CAS.
- Y. Zhu, Q. Hou and G. Jian, et al., Current development and application of chemical combination flooding technique, Pet. Explor. Dev., 2013, 40(1), 90–96 CAS.
- H. Guo, Y. Li and F. Wang, et al., ASP Flooding: Theory and Practice Progress in China, J. Chem., 2017, 2017(5), 1–18 Search PubMed.
- J. Cheng, D. Xu and W. Bai, Commercial test of ASP Flooding in Daqing Oil Field, Abu Dhabi International Petroleum Exhibition and Conference, Abu Dhabi, UAE, 2008 Search PubMed.
- P. Liyanage, S. Solairaj and H. Linnemeyer, et al., Alkaline Surfactant Polymer Flooding using a Novel Class of Large Hydrophobe Surfactants, SPE Improved Oil Recovery Symposium, Tulsa, Oklahoma, USA, April 2012, pp. 14–18 Search PubMed.
- L. I. Ai-Fen, C. Kai and Z. Lin, et al., Optimization and visualization of the injection patterns of foam system, Journal of Xian Shiyou University, 2011, 26(5), 49–52 Search PubMed.
- G. Paul, L. Lake and G. Pope, et al., A Simplified Predictive Model for Micellar-Polymer Flooding, SPE California Regional Meeting, San Francisco, CA, March 24–26, 1982 Search PubMed.
- Z. Wang, T. Yu and X. Lin, et al., Chemicals loss and the effect on formation damage in reservoirs with ASP flooding enhanced oil recovery, J. Nat. Gas Sci. Eng., 2016, 33, 1381–1389 CrossRef CAS.
- X. U. Hui, J. S. Qin and H. Q. Jiang, 3D physical simulation about macroscopic flow mechanisms for multi-component foam flooding, Pet. Geol. Oilfield Dev. Daqing, 2008, 27(1), 110–113 Search PubMed.
- P. H. Han, Physical Simulation Experimental Study on Alternative Injection of Polymer and Alkali/surfactant, Pet. Geol. Oilfield Dev. Daqing, 2006, 25(1), 95–97 Search PubMed.
- G. Chen, Y. Tian and X. Zhao, et al., Optimization of the ASP flooding injection pattern for sub-layers in Daqing oilfield, Acta Pet. Sin., 2012, 33(3), 459–464 Search PubMed.
- Y. Wenhua, W. Dongying and W. Ningyu, Experimental study on influences of the dosage of injection method on heavy oil displacement efficiency, Chem. Eng., 2017, 4, 41–43 Search PubMed.
- X. Changliang, Research on optimization of injected medium and method for heavy oil chemical flood on block L, Northeast Petroleum University, 2016 Search PubMed.
- L. Xiuping, Exploration characteristics and influencing factors of weak base ASP flooding, Unconventional oil & gas, 2014,(3), 37–42 Search PubMed.
- L. Yiqiang and S. Weiming, The optimal adjustment moment of polymer flooding for different injection-production types in class II oil layers, Acta Pet. Sin., 2012, 33(4), 647–652 Search PubMed.
- Ministry of Energy of the People's Republic of China, Viscosity determination of crude petroleum-Equilibrium method by rotational viscometer, Oil and gas industrial standard of the People's Republic of China, 2008, SY/T 0520—2008 Search PubMed.
- S. Y. Wu, Research on Viscosity Measuring Method of Polymer Solution, Pet. Geol. Oilfield Dev. Daqing, 2006, 25(2), 84–85 Search PubMed.
- G. E. Archie, The Electrical Resistivity Log as an Aid in Determining Some Reservoir Characteristics, Well Logging Technol., 2007, 146(3), 54–62 Search PubMed.
- S. Pingping, W. Jialu and T. Yuling, et al., Saturation measurement technique for 3D reservoir physical modeling, Pet. Explor. Dev., 2004, 31(1), 71–76 Search PubMed.
- L. Yiqiang, Experimental study on sweep efficiency of polymer flooding with longitudinal heterogeneous plane model, Acta Pet. Sin., 2005, 26(2), 77 Search PubMed.
Footnote |
| † Electronic supplementary information (ESI) available. See DOI: 10.1039/c8ra00362a |
| This journal is © The Royal Society of Chemistry 2018 |